warwick.ac.uk/lib-publications
Original citation:Hartas, Dimitra. (2017) Setting for English and Maths : 11 year olds' characteristics and teacher perceptions of school attitudes. Research Papers in Education .
Permanent WRAP URL:
http://wrap.warwick.ac.uk/88449
Copyright and reuse:
The Warwick Research Archive Portal (WRAP) makes this work by researchers of the University of Warwick available open access under the following conditions. Copyright © and all moral rights to the version of the paper presented here belong to the individual author(s) and/or other copyright owners. To the extent reasonable and practicable the material made available in WRAP has been checked for eligibility before being made available.
Copies of full items can be used for personal research or study, educational, or not-for profit purposes without prior permission or charge. Provided that the authors, title and full bibliographic details are credited, a hyperlink and/or URL is given for the original metadata page and the content is not changed in any way.
Publisher’s statement:
This is an Accepted Manuscript of an article published by Taylor & Francis in Research Papers in Education on 22 May 2017, available online:
http://www.tandfonline.com/10.1080/02671522.2017.1329338
A note on versions:
The version presented here may differ from the published version or, version of record, if you wish to cite this item you are advised to consult the publisher’s version. Please see the ‘permanent WRAP url’ above for details on accessing the published version and note that access may require a subscription.
1 Abstract
As a way to raise attainment, schools are encouraged to form ability groups across classes for particular subjects. There is limited evidence however about the relationship between setting and primary school children’s characteristics and how teachers perceive them. The aim of this study was to investigate associations between set positioning for English and Maths and teachers’ perceptions about 11 year olds’ behaviour and school attitudes and future education goals, and children’s psychosocial and cognitive characteristics and background through secondary data analyses of the fifth sweep of the Millennium Cohort Study (MCS). The study employed binary logistic regression analyses and revealed strong associations between set positioning and teacher perceptions of 11 year olds’ behaviour and attitudes and future education goals. Associations between set position and teacher perceptions of children’s identity as learners were stronger than those for children’s self- reported attitudes and behaviour. Also, family income and gender emerged as strong predictors of children’s position in sets. Set positioning is not a neutral act; it has implications about children’s personal agency and their identity as learners.
Keywords: ability grouping, setting, children’s decision making, psychosocial factors, teacher perceptions
Setting for English and Maths: 11 year olds’ characteristics and teacher perceptions of school attitudes
Introduction
Since the 90s, raising attainment has been a site for UK policy decision making and intervention. This is driven by concerns about the educational level and skills of the UK population, critical for developing a productive workforce and increasing social mobility. Although ability grouping in the form of setting (ability grouping across classes for particular subjects) is not a new
development, it has been resurfaced as a way to raise attainment, with schools being encouraged to introduce it (Department for Education, 1993). This was reinforced by the White Paper
Excellence in Schools, which argued that setting could be beneficial in raising standards, suggesting that ‘setting should be the norm in secondary schools. In some cases, it is worth considering in primary schools’ (Department for Education and Employment, 1997). With New Labour, as Abraham observed, setting became ‘the dominant form of organising secondary schooling in Britain in most subjects and the preferred approach by governments’ (2008 p855).
The creation of an educational market has also encouraged setting as schools compete to attract and retain students from middle class families (Ball, Bowe and Gewirtz, 1994).Araujo argued that New Labour’s endorsement of ability grouping was ‘to attract middle-class parents to, and restore their confidence in, the state sector’ by creating havens within urban comprehensives where middle class children can be undisturbed by the undesirables anchored firmly in the lower sets (2007 p254). Middle class families encourage schools to set because they see it to be
2
involved in setting decisions experience tensions triggered by policy agendas, being mindful of the performativity agenda that determines accountability in percentages of SAT levels and GCSE passes.
In spite of the broad commitment to raising attainment across the political spectrum, the perceived and actual factors that associate with ability grouping in schools are not well understood. Also, research on the effectiveness of setting in raising attainment remains inconclusive. The academic benefits of ability grouping and setting in particular have been contested. Hallam and Ireson (2007) argued that setting favours high attainers at the expense of lower attainers. Moreover, nearly four times as many low-set students reported their teachers’ expectations to be too low (Boaler et al 2000). Teachers’ views about children’s learning are influenced by their behaviour at school, with poorly behaving children more likely to be found in low sets. However, as Hallam and Parsons (2013) argued, placing children in low sets merely relocates the problem and limits the academic opportunities offered to them in that ‘both teachers and students respond poorly to low track classroom learning environments’ (Kelly and
Carbonaro, 2012 p273).
Furthermore, we know very little about the characteristics and family background of children in different ability groups and how their teachers perceive them. Few studies have brought together children’s family background and psychosocial and cognitive characteristics (eg, self-esteem, wellbeing, decision making, behaviour and attitudes to school) and their teachers’ views of them to examine their relationship to set positioning. Children’s social / emotional competencies such as emotion regulation, control of attention and prosocial behaviour have been linked to sustained learning and school success. Young people’s ability to manage their own behaviour and
emotions regulates their behaviour in ways that are consistent with classroom rules and display prosocial behaviour in terms of showing empathy to and collaborating with their peers can help them learn from and with others and do well at school (McClelland, Acock, and Morrison 2006). Children’s cognitive processes such as decision making are also likely to influence their learning. Studies on decision-making in young children and adolescents have suggested a progressive development in their ability to make advantageous choices over the course of a task (Mata et al 2011). Most research in this area has examined the links between young people’s decision making and pathological behaviour (eg, addictions), with a small number of studies examining decision making in relation to students’ learning and academic adjustment (eg, Germeijs et al 2011; Wild and Musser 2013). Germeijs and colleagues showed that students’ capacity to
broaden their exploration of alternatives and commit to a specific decision was found to associate with better school adjustment. Young people’s decision making about future education are goal-oriented whereby possible options are weighed to reach a desired goal. In this context, it is of interest to examine whether young people’s decision making relates to their position in sets.
3
using the Millennium Cohort Study (MCS). Child characteristics and teacher perceptions of them offer a lens through which set positioning is viewed. Considering that individual schools are responsible for making decisions about setting, it is important to understand the factors likely to surround these decisions.
The study addressed the following research question:
What are the unique and cumulative contributions of 11 year olds’ psychosocial, cognitive and background characteristics and teachers’ perceptions of their behaviour and attitudes to learning and future education to explaining variation in their set positions for English and Maths?
Sub-questions include:
Are 11 year olds who attract negative behaviour and attitude ratings from their teachers more likely to be found in the middle/lowest sets for English and Maths?
Are 11 year old boys and girls living below the poverty line more likely to be in the middle/ lowest sets?
Are 11 year olds more likely to be placed in the middle/ lowest sets based on whether they are a boy or a girl?
Do teacher expectations for 11 year olds to stay on in education post 16 associate with set positioning for English and Maths?
Are 11 year olds’ psychosocial and cognitive characteristics (ie, general wellbeing, self- esteem, decision making and verbal reasoning) related to set positioning for English and Maths?
Method
Sample
The data for this study came from the fifth sweep of the Millennium Cohort Study (MCS), a longitudinal birth cohort study, which offers a large-scale information about the ‘New Century’s Children’ and their families in the UK. The fifth sweep was carried out in 2012-2013 when the cohort child reached the age of 11, achieving a response rate of 69% of the target sample
(slightly lower than in the previous sweeps). The data were collected between January 2012 and February 2013. The working sample derived from the home-based surveys was 10,159 singleton cohort children. Teacher surveys (from England and Wales only) were carried out after the home-based interviews for 9,610 pupils. The final sample, after the home and teacher survey data were merged, included 9,610 pupils. The sample design allowed for over-representation of families living in areas with a high rate of socio-economic disadvantage, which increased the power of the study to analyse socio-economic effects. To ensure that the study is representative, the data were weighed to account for over-representation, non-response in the recruitment of the original sample and sample attrition. Data were weighed because the sample differs from the population in scale and proportion; the application of weights aims to make the sample more like the population by correcting for scale and proportion. Full details about the origins and
objectives of the MCS can be obtained from the UK Data Archive at Essex University (Hansen 2008). Ethical approval for the MCS was gained and parents gave informed consent before interviews took place and a written consent for the cognitive assessments.
4
This study examined 11 year olds’ likelihood of being placed in the middle/ lowest sets for English and Maths based on their psychosocial/ cognitive and background factors and teachers’ perceptions of their behaviour, attitudes, educational goals and parent interest in education. To this end, four sets of measures were formed, namely teacher perceptions of child behaviour, attitudes and post-16 education goals and parental interest in school; child psychosocial and cognitive characteristics; child family background; and set position (Highest, Middle / Lowest) for English and Maths. Child psychosocial and cognitive characteristics included self-reported behaviour and attitudes towards school; decision making; self-esteem and wellbeing; and verbal reasoning. Background variables included children’s gender and subjective experience of family’s SES and family’s income.
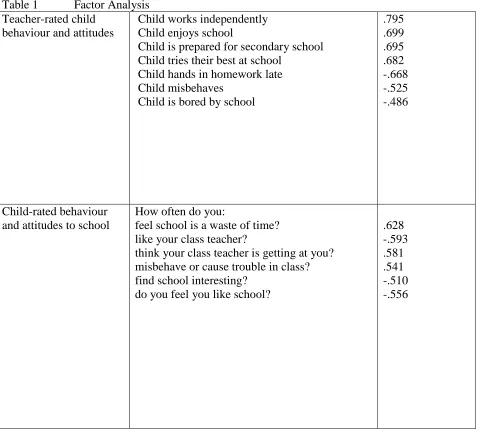
A number of variables (i.e., self-esteem, wellbeing, teacher and child-rated behaviour and attitudes to school) in this study emerged from factor analysis, used to reduce the data set on child-related variables to a more manageable size while retaining as much of the original information as possible. As such an exploratory factor analysis (i.e., Principal Component Analysis with varimax rotation) was conducted to identify patterns among young peoples’ and teachers’ questionnaire items. Through this analysis, factors related to teacher- and child-rated behaviour and attitudes to school and children’s general wellbeing and self-esteem were identified. While items have been conceptually grouped in the 11 year olds’ and teachers’ questionnaires, it is important that the factor scores employed in the analysis emerged from the empirical data rather than being imposed in a-priori manner. Also, statistically, factor analysis helps reducing multicollinearity by combining variables that are collinear and measure aspects of the same underlying dimension to create distinct factors (Table 1). This is important especially if these factors are subsequently included in regression analyses. To check whether the factor analysis yielded distinct and reliable factors, the KMO statistic (the ratio of the squared correlation to the squared of partial correlation between variables) was examined. Its value ranges between 0 and 1. The KMO=.836 value was close to 1, indicating that patterns of
correlations between variables are compact. Also, the Bartlet’s test of sphericity shows whether the correlation matrix is significantly different from the identity matrix (Field, 2009). If it is significantly different, as with this analysis Χ2 (1081) = 5513.2, p<.000, then the correlations
between variables are significantly different from zero. These tests pointed out that the data were appropriate for factor analysis, with the variance explained by the emerging factors being 62% of the total variance.
Insert Table 1 here
Teacher perceptions of child school attitudes, behaviour and post-16 education goals
Teacher ratings of child behaviour difficulties and prosocial behaviour: The Strengths and
5
be marked "not true", "somewhat true" or "certainly true". In eachsubscale, scores for each of the five items were summed, givinga range of 0–10, and the total difficulties score, which is the sum of all problem SDQ domains (i.e., hyperactivity, emotional symptoms, conduct problems, and peer problems) hada range of 0–40. The prosocial score is not incorporated in the reverse direction into the total difficulties score since the absence of prosocial behaviours is conceptually different from the presence of psychological difficulties. The SDQ has a good test-retest
reliability of .85 (Goodman et al, 1998). In this study, SDQ was completed by the teachers in England and Wales (N=9340) during the data collection year (total difficulties; M=5.92, SD=5.8).
Teacher-rated child behaviour and attitudes to school: Items such as ‘Child works
independently’ or ‘Child enjoys school’ were clustered under this factor (Table 1). Their values ranged from ‘always’ to ‘never’.
Teachers’ predictions about 11 year olds’ staying on in post-16 education were obtained through questions such as: ‘how likely is for child to stay on in education post 16?’ and ‘how likely is it for child to pursue higher education?’ The values for the first item ranged from ‘very likely’ (31.9%) to ‘fairly likely’ (30.4%) to ‘unlikely’ (37.7%). For the second item the values were ‘very likely’ (46.3%), ‘fairly likely’ (32.5%) and ‘unlikely’ (21.3%) (N=9209).
Teacher views on parents’ interest in school: Teachers were asked to rate the interest of 11 year olds’ mothers and fathers in school: 83% mothers and 56.6% fathers were seen as being fairly interested, 6.2% mothers and 6.3% fathers as neutral and 10.9% mothers and 37.1% fathers as fairly uninterested (N=9310).
Child psychosocial and cognitive characteristics and educational aspirations
Decision making and risk-taking: this was assessed by using the Cambridge Gambling Task (CGT) (Rogers et al. 1999). The CGT is part of the Cambridge Neuropsychological Test Automated Battery (CANTAB) and is presented on a touch-screen computer. In this task, ten boxes (a mixture of red and blue boxes) are displayed at the top of a computer screen. At the bottom of the screen, children choose a rectangle with either the word red or blue displayed on the inside. The yellow token has an equal chance of being under any one of the ten boxes. The children were told that the computer has hidden a yellow token inside one of ten red or blue boxes aligned in a row at the top of the screen and their task is to guess the colour of the box that is hiding the token. They were instructed to choose whether the token is hidden in a red or blue box and then to decide how many points (from an initial 100 points) they wish to gamble on being correct. They were asked to try to win as many points as possible. The likelihood of each choice being correct is indicated on each trial by the ratio of red to blue boxes displayed and hence results in outcomes of more likely (9:1, 8:2, 7:3) or almost equally likely (6:4, 5:5)
6
SD=1.02); CGTdelay aversion (the difference between the risk-taking score in the descend and the ascend condition; M=.29, SD=.24); CGT overall proportion bet (the mean proportion of the current points total that children choose to risk on each trial regardless of the likely outcome; M=.49, SD=.15) (N=9535).
Child self-reported school attitudes and behaviour: Items such as ‘How often do you feel school is a waste of time?’ were clustered under this factor. Their values ranged from ‘all of the time’ to ‘never’ (Table 1).
General wellbeing: Items referring to general well-being (eg, ‘how often do you feel happy?’; ‘how often do you worry about what would happen?’) with values ranging from ‘completely happy’ to ‘not at all happy’ (Table 1).
Self-esteem: Items such as ‘I feel that I have a number of good qualities’ were clustered under self -esteem. Their values ranged from ’strongly agreed’ to ’strongly disagree’ (Table 1).
Child educational aspirations: this was measured through the item ‘Do you want to stay on at school or college full-time when you are 16?’ with dichotomous values of ‘Yes’ (54.5%) and ‘No’ (45.5%).
Verbal Similarities: Children’s verbal reasoning was measured through a standardised test (BAS) with M=58.27 and SD=9.9 (N=9600).
Family background
Gender and family socio-economic status: There were 50.9% boys and 49.1% girls in the sample (N=9610). Measures of family income (from the UK whole sample) were based on the OECD 60% median with 78% being above and 22% below the 60% median. A subjective measure of family’s socio-economic status was obtained via the item: ‘Compared to your friends, is your family richer, poorer or the same?’ with 8% perceiving their family to be richer, 13% poorer and 79% the same.
Setting for English and Maths
Teachers were asked about 11 year olds’ set placements for English and Maths, offering three levels (Highest, Middle, Lowest). For English, 45.5% of 11 year olds were in the highest; 31.7% in the middle and 22.8% in the lowest set. For Maths, 46.5% were in highest; 30.2% in middle and 23.3% in the lowest set. Because of the relatively small numbers in the lowest sets, the middle and lowest sets were collapsed into one group. As such, 54.5% were in the middle/ lowest set for English and 53.5% for Maths (N=8679-9546).
Data Analytic Plan
7
teacher perceptions of child behaviour, attitudes and post-16 goals; child psychosocial/ cognitive characteristics and aspirations; and child background) were examined (Table 2). A binary logistic regression was selected because of the categorical nature of the outcome variables on set positions (Highest compared with Middle/ Lowest). The assumptions that underpin a logistic regression are linearity (each predictor has a linear relationship with the log of the outcome variable) and multicollinearity (correlations between predictor variables). As with all regression analyses, it is important to check whether the model fits the data and how well the model predicts the outcome variable. The question of how much better the constructed model predicts set
positions is assessed by examining the model chi-square statistic, which measures the difference between the model with the chosen predictors and the baseline model without the predictors. In this analysis, the omnibus tests for English setting, X2 (33) = 1493.1, p<.000 and for Maths X2 (33) = 1990.1, p<.000 were statistically significant, pointing to a good model fit. The overall fit of the model is shown by the -2 log –likelihood statistic and its associated X2 statistic, which
indicates whether the model is a good fit of the data. The Hosmer Lemeshow tests (X2 (8)=7.8, p<.44 for English and X2 (8)=14.8, p<.2 for Maths) were not statistically significant which means that the observed probabilities matched the predicted probabilities.
In a linear regression where the outcome is a continuous variable, the co-efficient b represents the change in the outcome resulting from a unit change in the predictor variable. In logistic regressions, the interpretation of b is similar in that it represents the change in the logit (i.e., the natural logarithm of the odds of the outcome occurring) of the outcome variable associated with one unit of change in the predictor. The odds ratio (exponentiation of the co-efficient b) for the predictor variables was examined. The odds ratio is about the odds of falling into a comparison group compared to the odds of falling into the reference category. The odds ratio is a measure of the effects of the predictor variables on the odds of ‘success’. For a unit of change in the
predictor variable, the corresponding odds ratio is the factor by which the odds of ‘success’ are expected to change while controlling for all other predictor variables in the model (Field 2009). The odds ratio for a particular variable is defined as eb whereas e is the natural log or base number (2.718) of natural logarithms and b is the logit co-efficient estimate of predictors (a log odds ratio less than 1 refers to a decreased probability whereas an odds ratio greater than 1 refers to an increased probability of an outcome occurring).
8
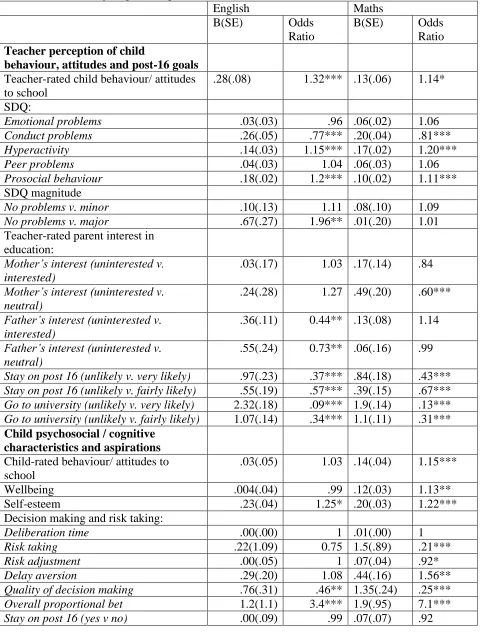
Table 2 presents the parameter estimates, the standard error and the odd ratios for each predictor for the binary outcome variables (i.e., set positions).
Insert Table 2 here
Results
In predicting 11 year olds’ position in sets for English and Maths (binary outcome variable), teacher perceptions of their behaviour and school attitudes and post-16 education goals along with children’s decision making and family background emerged as strong predictors.
Teacher perceptions of 11 year olds’ school attitudes and behaviour and post-16 goals
Set positioning for English and Maths was positively associated with teachers’ perceptions of 11 year olds’ school attitudes and behaviour and future education goals. Specifically, there was a 32% and 14% increase in the odds1 of being placed in the middle / lowest sets for English and
Maths respectively for pupils who attracted low ratings regarding their behaviour and attitudes to school. Teachers’ predictions about staying on post 16 were also found to significantly associate with 11 year olds’ set positioning. Compared to children thought to be very unlikely to stay on post 16, for those seen as very likely and fairly likely, there was a 63% and 43% decrease respectively in the odds of being placed in the middle/ lowest sets in English; and a 57% and a 33% decrease in the odds for Maths. Likewise, compared to 11 years olds thought to be unlikely to go on to university, for those thought to be very likely and fairly likely, there was a 91% and a 66% decrease respectively in the odds of being placed in the middle/lowest set for English and an 87% and 69% decrease in the odds for Maths. Interestingly, no significant associations were found between 11 year olds’ aspirations to stay on in education post 16 and their English and Maths set position (Table 2).
In examining SDQ, as teacher ratings of children’s conduct problems dropped, there was a 23%, and 19% decrease, respectively, in the odds of being in the middle/ lowest set for English and Maths. As ratings of hyperactivity increased, there was a 15% and a 20% increase in the odds whereas as prosocial measures dropped, there was a 20% and 11% increase in the odds of being in the middle/ lowest set for English and Maths. Teacher ratings of children’s emotional
problems and peer problems were not found to associate with predictions about position in sets. Compared to 11 years olds without behavioural difficulties, those seen as having minor problems were 11% more likely to be in the middle/lowest set for English, whereas those with major problems were 96% more likely. There was no association between Maths set placement and teachers’ ratings of the magnitude of 11 year olds’ behavioural difficulties (Table 2).
9
respectively, in the odds of being in the middle/lowest set in English (there was no significant relationship between perceived fathers’ interest and set positions in Maths). Children of mothers and fathers perceived as neutral were less likely to be placed in the middle/lowest group for Maths and for English respectively.
11 year olds’ psychosocial and cognitive characteristics
Child self-reported behaviour and attitudes to school were not found to associate with 11 year olds’ English set position, whereas self-reported negative behaviour and attitudes were associated with a 15% increase in the odds of being in the middle/ lowest set for Maths. A similar pattern emerged with measures of 11 year olds’ general wellbeing, found to associate with Maths set positions but not with setting in English. As measures of general well-being dropped there was a 13% increase in the odds of being placed in the middle/lowest group for Maths. A significant association was found between self-esteem and set placement. As measures of self- esteem dropped, there was a 25% and 22% increase in the odds of being in the
middle/lowest group in English and Maths (Table 2).
In examining the relationship between 11 year olds’ decision making and set positions for English and Maths interesting results emerged. Specifically, for delay aversion (the difference between the risk-taking score in the descend and the ascend condition of the task), there was a 56% increase in the odds of being in the middle/ lowest set for Maths (but not for English); for
quality ofdecision making (the proportion of trials on which the child chose to gamble on the more likely outcome), a 54% and 75% decrease in the odds for being in the middle/lowest sets for English and Maths; for risk taking (the mean proportion of current points total that the child stakes on each gamble test trial for which they had chosen the more likely outcome), a 75% and 79% decrease in the odds for English and Maths; and for risk adjustment (the degree to which children vary their risk taking) an 8% decrease in the odds for Maths. Finally, children who scored high in the overall proportional bet (the mean proportion of the current points total that a child chooses to risk regardless of the likely outcome) were over 3 and 7 times more likely to be placed in the middle/ lowest sets in English and Maths (Table 2).
As verbal similarities scores rose, there was a 10% and a 9% decrease the in the odds of being in the middle/lowest sets for English and Maths.
11 year olds’ gender and family income
Compared to 11 year olds in families with income above 60% median, those below the poverty line were more likely to be in the middle/lowest sets, showing a 23% and 44% increase in the odds for English and Maths respectively. No significant associations were found between 11 year olds’ subjective views about their family’s socio-economic status and their set positions.
Regarding gender, compared to girls, boys were 50% and 39% more likely to be in the middle/lowest sets for English and Maths respectively.
10
expectations regarding post-16 education and ratings of child behaviour and attitudes , family income, gender and children’s decision making emerged as strong predictors, stronger than child-rated behaviour and attitudes, well-being and self-esteem (with child educational
aspirations being non significant). Amongst children’s socio-cognitive measures, the quality of decision making and risk taking were found to strongly associate with positions in sets.
Interestingly, teacher perceptions of parental interest in children’s education associated with set positions differentially for mothers and fathers. Finally, although the likelihood of being in middle/ lowest sets increased for boys and children below the poverty line, their subjective views about their family’s financial status did not predict their set position for English and Maths.
Discussion
The aim of this study was to examine the likelihood of 11 year olds being found in the
middle/lowest sets for English and Maths in relation to a) their family background, psychosocial and cognitive characteristics and post-16 educational goals and b) their teachers’ expectations and perceptions of their school behaviour and attributes. Being in middle /lowest sets for English and Maths was more likely for children perceived by their teachers to have negative school attitudes and behaviour and for those seen as less aspirant. Also, children in families with income below the 60% median and boys were more likely to be in the middle / lowest sets. However, child- rated behaviours and attitudes towards school, well-being and self-esteem and verbal reasoning, although significant, were not strong predictors. In contrast, aspects of children’s decision making emerged as strong predictors. As 11 year olds’ capacity for decision making and risk taking increased, they were less likely to be in the middle / lowest sets for English and Maths. Finally, 11 year olds’ aspirations about post-16 education were not found to associate with their set position.
Set positioning and 11 year olds’ identity as learners
Teachers’ perceptions of 11 year olds’ school behaviour and attitudes and post-16 education goals were more strongly associated with set positions than were children’s self-reported behaviour and attitudes and psychosocial characteristics. Specifically, teacher ratings of children’s externalising behaviour difficulties (i.e., conduct problems, hyperactivity) as well as prosocial behaviour predicted set positions for English and Maths. Teacher expectations
regarding children’s learning tend to be influenced by their perceptions about their behaviour at school (eg, Hartas 2011). A positive association was also found between teacher perceptions of fathers’ interest in education and Maths set positioning (but not for English), with the reverse outcome regarding perceived mothers’ interest in children’s education. These findings align with previous research (Rubie-Davies 2010) in which teachers who held positive views about
children’s home background and their parents’ attitudes to school also held positive views about children’s learning.
A particularly strong predictor regarding set positioning for English and Maths was teacher expectations about 11 year olds’ post-16 education whereas children’s own aspirations did not appear to associate with the likelihood of being in middle /lowest sets. Kelly and Carbonaro argued that teacher expectations and student behaviour interact and respond differently
11
when the same student was placed in different ability groups for different classes, teacher expectation (in terms of the likelihood of going to college) was lower for students in lower sets and higher for those in higher sets. This is likely to have implications regarding how 11 years olds construct their identity as learners, especially for boys, who tend to locate academic success and failure and the impetus for improvement in their own behaviour and attitude (Chedzoy and Burden 2007).
11 year olds’ decision making and set positioning
Consistently with March and Martin (2011), children’s general sense of well-being and self-esteem was found to moderately associate with their set positioning, pointing to the importance of a positive classroom climate which in turn relates to better grades, positive attitudes toward school, higher degrees of participation and less disruptive behaviour. Children’s subjective well-being influences motivation, which, in turn, affects effort, participation and achievement
(Driscoll, 2005). Also, 11 year olds’ cognitive skills, ie, risk taking and the quality of decision making, were found to strongly associate with set position in English and Maths. Children who scored high in the overall proportional bet were found to be over 3 and 7 times more likely to be in the top set for English and Maths. Likewise, high scores on risk taking and the quality of decision making were associated with top set positions. Children’s risk taking refers to the degree to which their decision-making favours the possibility of a large, positive outcome but with the risk of a large negative outcome at the expense of options associated with smaller but more certain outcomes. Essentially, risk taking is about the proportion of risky to safe choices one makes, whereas the quality of decision making is about the extent to which children understood the CGT task. The overall proportional bet is an important aspect of risk-taking behaviour in that the higher it is the greater the risk taking. There are different types of risk and an outcome involves a balance between risk and anticipated reward. Central to models on decision making is the notion of rational choice which assumes that people make decisions only after the gains and losses of each action have been weighed at which point the action with the highest value is selected. Once a solution that is good enough (but not optimal) is found, the decision making stops. As such, calculated risk can be goal-directed, an attribute that underpins learning and further education goals (de Haan et al 2011).
12
Gender, SES and set position for 11 year olds
The gender patterns revealed in this study are consistent with previous studies (eg, DfE 2014a), in that boys were more likely to be found in middle /lowest groups for English and Maths. This suggests that perceived attitudinal gender differences may be used by teachers to explain attainment differences. Discussions on gender tend to focus on difference. Alongside the
attainment gap, there also seems to be an attitudinal gap, with boys being less engaged than girls (Martin 2009). Martin studying over 12,000 Australian students, showed that gender differences in motivation were essentially differences of character with girls being seen as displaying ‘a more adaptive pattern of motivation and engagement’(p429). Consistently, in a Finnish study by Mullola and colleagues, teachers tended to view boys as less persistent, less educationally
competent and temperamentally less suited to school than girls (2012). In this study, gender was found to associate with set positioning, and as Myhill and Jones argued, it may be that schools ‘reproduce the dominant gender ideology of the wider society’ (2006 pg99-100).
Furthermore, the achievement gap between poorer and better-off 11 year olds was reflected in their set positioning (although subjective views of poverty were not), with pupils of low socio-economic status more likely to be in middle /lowest sets. This is consistent with several studies (eg, Boaler et al 2000; Kutnick et al 2005; Wiliam & Bartholomew 2004) whereas students with comparatively higher socio-economic and possibly cultural capital were more likely to be in top sets. In a study by Sorhagen, family income moderated the relation between teachers' perceptions of student attitudes and Y6 final grades, as well as their math test scores in Y7 (2013). Clearly, the notion of ‘family habitus’ (understood in this study as real or perceived financial and cultural capital in the form of family income and parental interest in education) is reflected in set
positions (Archer et al 2014). This is not surprising considering that the achievement gap between poor and better-off students is firmly in place by Y6 (Abouey and Geoffard 2013; Feinstein 2003), questioning whether students from disadvantaged backgrounds are placed in low sets because their attainment and ability are fundamentally low or because they are
perceived to be low. Stigma accentuates the difficulties young people face in poverty; they have to tackle not only the barriers erected by inequality and reduced opportunities but also their teachers’ low expectations and, possibly, the quality of education they receive. Finally, by isolating an elite group from their peers we are creating another generation of students who take educational segregation for granted where top-set students are given an education suited to their needs while their peers in lower sets are perceived as less aspirant and with poor attitudes to learning.
Strengths and limitations
13
in terms of developing surveys and using independently validated instruments (eg, SDQ, CGT) is high, ensuring data of the highest quality.
A limitation in this study was its reliance on self-reports due to the potential bias and also the independence of data. The possibility of a discrepancy between young people’s self -reports and their actual behaviour exists and thus we need to exercise caution when we interpret the results regarding their subjective views about themselves (although the data were collected via a reported questionnaire to reduce social desirability effects). Relevant to this, wellbeing and self-esteem measures were somewhat limited in their scope. Another limitation lies in the measures of teachers’ expectations and children’s aspirations in that they did not offer any information about career goals or choices of universities and colleges that young people may aspire to.
Moreover, there were challenges encountered with collecting teacher data from all the four countries of the UK, with data being available from England and Wales only. Regarding the time order of data collection, measures of set positioning and teacher perceptions were collected in parallel with child-related measures. Although this was not a problem in examining associations between set positioning, teacher perceptions and child-related factors, not having a clearly delineated time order makes it difficult to draw causal pathways of influence. We also need studies that use multi-dimensional models to recognise the interplay between individual and systemic factors and acknowledge that children’s ability grouping reflects not so much individual agency but how they are perceived as learners. Finally, a comparative approach stratified by class and social/cultural capital, gender and ethnicity may be used to examine the complex dynamics inherent in setting.
Concluding thoughts
The reality in schools is that all pupils are grouped within classrooms. Such grouping includes the whole class working together, small groups, larger groups and pairs of children. Grouping is one of the most common responses to the problem of providing for student differences; however, whether it is an equitable response is a matter of controversy. In this study, teachers’ perceptions about 11 year olds’ behaviour and attitudes and home background strongly predicted the
likelihood of them being in middle/lowest sets. Although the link is not causal, when it comes to ability grouping, schools should account for family background as well as teachers’ perceptions about young people’s behaviour and school attitudes to challenge social stigma and the
14
young people by holding low expectations (as it is the case in low-set groups) based on perceptions about their behaviour and attitudes and their family background.
Moreover, children’s construction of their identity as learners involves a constant negotiation between actual and designated identities (Varelas et al 2013). Actual identities are based on who children believe themselves to be at any particular moment, reflected in self-ratings of behaviour and school attitudes and also educational aspirations. Designated identities are based on what children expectto be the case, if not now, then in the future. Designated identities have the potential of becoming part of children’s actual identities, in that they may expect to “become” a certain kind of person. In this study, 11 year olds’ designated identities seemed to strongly associate with set positions. Some pupils may see their designated identity and the resulting set position as inevitable whereas others may resist this by forming a subculture that goes against the school ethos and values.
Decisions about setting should account for the identity work that students do in conjunction with learning to ensure that pupils in the lower or higher sets do not become the targets of teasing or bullying (Hallam, Ireson and Davies, 2002). This could be achieved through flexible setting. As Blatchford and colleagues argue, flexible setting has the potential to facilitate movement
between groups structured by ability, and avoid limiting the educational opportunities and quality of teaching and learning for some children (2008). Pupils’ learning does not follow ‘a stable trajectory’ and instructional practices should focus on both learners’ developing
understanding of concepts and skills and their developing sense of who they are and who they are becoming. Setting should consider this and should vary according to the nature of the task. To this end, the development of 'classroom-based social pedagogy' (including flexible use of setting whereby pupils are grouped according to skills closely related to the curriculum and the instruction is tailored to their capacities) is needed to counter divisions among pupils and raise achievement (Blatchford et al 2008:28). Social pedagogy is relational and accounts for
perceptions of pupils’ worth, their identity as learners and the structural constraints and
affordances that surround their life. In this context, the use of setting is likely to be beneficial for both high and low attainers and less divisive.
15 References
Abraham, J. 2008. Pupils' perceptions of setting and beyond – a response to Hallam and Ireson,
British Educational Research Journal, 34(6) 855 – 863.
Apouey, B., and Geoffard, P. 2013. Family income and child health in the UK, Journal of Health
Economics, 32 715– 727.
Araujo, M. 2007. 'Modernising the comprehensive principal': selection, setting, and the
institutionalisation of educational failure, British Journal of Sociology of Education, 28(2) 241 – 257.
Archer, Louise, Jennifer DeWitt, and Billy Wong, 2014. Spheres of influence: what shapes young people’s aspirations at age 12/13 and what are the implications for education policy?.
Journal of Education Policy 29(1), 58-85.
Ball , S.J. , Bowe , R. and Gewirtz , S. 1994. Competitive schooling: Values, ethics and cultural engineering. Journal of Curriculum and Supervision, 9: 350–367.
Blatchford, P., Hallam, S., Ireson, J. and Kutnick, P., with Creech A. 2008. Classes, groups and
transitions: structures for teaching and learning (Primary Review Research Survey 9/2)
Cambridge: University of Cambridge Faculty of Education
Boaler, J., Wiliam, D., and Brown, M. 2000. Students’ experiences of ability grouping -
disaffection, polarisation and the construction of failure, British Educational Research Journal, 26 (5) 631-648.
Chowdry, H., Crawford, C., and Goodman, A. 2009. Drivers and Barriers to Educational
Success, Evidence from the Longitudinal Study of Young People in England, London:
Department for Children, Schools and Families.
de Haan, L., Kuipers, E., Kuerten, Y., van Laar, M., Olivier, B., & Verster, J. C. 2011. The RT-18: a new screening tool to assess young adult risk-taking behavior. International Journal of
General Medicine, 4, 575.
Department for Education 1993. Improving primary education – pattern. (DfE News 16/93). London: DfE.
Department for Education and Employment. 1997. Excellence in schools. London: DfEE. Feinstein, L., 2003. Inequality in the Early Cognitive Development of British Children in the 1970 Cohort, Economica, 70 73–97.
Field, A. 2009. Discovering Statistics Using SPSS. London: Sage.
Germeijs, V., Luyckx, K., Notelaers, G., Goossens, L., & Verschueren, K. 2011. Choosing a major in higher education: Profiles of students' educational decision-making
process. Contemporary Educational Psychology, 37(3), 171-175.
Hallam, S. and Ireson, J. (2007) Secondary school pupils' preferences for different types of structured grouping practices, British Educational Research Journal, 32(4) 583 – 599.
Hallam, S. and Parsons, S., 2013. Prevalence of streaming in UK primary schools: Evidence from the Millennium Cohort Study. British Educational Research Journal, 39(3), pp.514-544. Hartas, D., 2011. Children's language and behavioural, social and emotional difficulties and prosocial behaviour during the toddler years and at school entry. British Journal of Special
16
Kelly, S. 2009. Social identity theories and educational engagement, British Journal of Sociology of Education, 30(4) 449 – 462.
Kelly, S., and Carbonaro, W. 2012. Curriculum tracking and teacher expectations: evidence from discrepant course taking models, Social Psychology of Education, 15 271–294.
Kutnick, P., Sebba, J., Blatchford, P., Galton, M., and Thorp, J. 2005. The Effects of Pupil
Grouping: Literature Review (Research Report RR688), Nottingham: DfES.
Marsh, H. W., & Martin, A. J. 2011. Academic self‐concept and academic achievement: Relations and causal ordering. British Journal of Educational Psychology, 81(1), 59-77. Mata, R., Josef, A. K., Samanez‐Larkin, G. R., & Hertwig, R. 2011. Age differences in risky choice: a meta‐analysis. Annals of the New York Academy of Sciences, 1235(1), 18-29.
Mullola, S., Ravaja,N., Lipsanen, J., Alatupa, S., Hintsanen, M., Jokela, M., and Keltikangas-Järvinen, L. (2012) Gender differences in teachers’ perceptions of students’ temperament, educational competence, and teachability, British Journal of Educational Psychology, 82 185– 206.
Myhill, D., and Jones, S. 2006. ‘She doesn't shout at no girls’: pupils' perceptions of gender equity in the classroom, Cambridge Journal of Education, 36(1) 99-113.
Rogers, R. D., A. M. Owen, H. C. Middleton, E. J. Williams, J. D. Pickard, B. J. Sahakian, et al. 1999a. Choosing between small, likely rewards and large, unlikely rewards activates inferior and orbital prefrontal cortex, Journal of Neuroscience, 19, 9029–9038.
Rubie‐Davies, C.M. 2010. Teacher expectations and perceptions of student attributes: Is there a relationship?. British Journal of Educational Psychology 80.1: 121-135.
Schoon, I., & Polek, E. 2011. Teenage career aspirations and adult career attainment: The role of gender, social background and general cognitive ability. International Journal of Behavioral
Development, 35(3), 210-217.
Sorhagen, Nicole S. 2013. "Early teacher expectations disproportionately affect poor children's high school performance." Journal of Educational Psychology 105(2), 465.
Varelas, M., Martin, D.B. and Kane, J.M., 2013. Content learning and identity construction: A framework to strengthen African American students’ mathematics and science learning in urban elementary schools. Human Development, 55(5-6), pp.319-339.
Wild, K. V., & Musser, E. D. 2013. The Cambridge Neuropsychological Test Automated Battery. Handbook of Executive Functioning, 171.
Wiliam, D. and Bartholomew, H. 2004. It’s not which school but which set you’re in that matters: the influence of ability grouping practices on student progress in mathematics, British
17 Appendix
Table 1 Factor Analysis Teacher-rated child
behaviour and attitudes
Child works independently Child enjoys school
Child is prepared for secondary school Child tries their best at school
Child hands in homework late Child misbehaves
Child is bored by school
.795 .699 .695 .682 -.668 -.525 -.486
Child-rated behaviour and attitudes to school
How often do you:
feel school is a waste of time? like your class teacher?
think your class teacher is getting at you? misbehave or cause trouble in class? find school interesting?
do you feel you like school?
18 General wellbeing In the last 4 weeks,
how often did you feel sad?
how often did you feel afraid or scared? how often did you get angry?
how often worried about what would happen how often do you feel unhappy at school? how often did you feel happy?
.772 .681 .622 .604 -.594 -.423
Self-esteem On the whole,
I am satisfied with myself I feel good about myself
I feel that I have a number of good qualities I am a person of value
I am able to do things as well as most other people
19
Table 2 Binary Logistic Regression: Parameter Estimates
English Maths
B(SE) Odds Ratio
B(SE) Odds Ratio
Teacher perception of child
behaviour, attitudes and post-16 goals
Teacher-rated child behaviour/ attitudes to school
.28(.08) 1.32*** .13(.06) 1.14*
SDQ:
Emotional problems .03(.03) .96 .06(.02) 1.06
Conduct problems .26(.05) .77*** .20(.04) .81***
Hyperactivity .14(.03) 1.15*** .17(.02) 1.20***
Peer problems .04(.03) 1.04 .06(.03) 1.06
Prosocial behaviour .18(.02) 1.2*** .10(.02) 1.11***
SDQ magnitude
No problems v. minor .10(.13) 1.11 .08(.10) 1.09
No problems v. major .67(.27) 1.96** .01(.20) 1.01
Teacher-rated parent interest in education:
Mother’s interest (uninterested v. interested)
.03(.17) 1.03 .17(.14) .84
Mother’s interest (uninterested v. neutral)
.24(.28) 1.27 .49(.20) .60***
Father’s interest (uninterested v. interested)
.36(.11) 0.44** .13(.08) 1.14
Father’s interest (uninterested v. neutral)
.55(.24) 0.73** .06(.16) .99
Stay on post 16 (unlikely v. very likely) .97(.23) .37*** .84(.18) .43***
Stay on post 16 (unlikely v. fairly likely) .55(.19) .57*** .39(.15) .67***
Go to university (unlikely v. very likely) 2.32(.18) .09*** 1.9(.14) .13***
Go to university (unlikely v. fairly likely) 1.07(.14) .34*** 1.1(.11) .31***
Child psychosocial / cognitive characteristics and aspirations
Child-rated behaviour/ attitudes to school
.03(.05) 1.03 .14(.04) 1.15***
Wellbeing .004(.04) .99 .12(.03) 1.13** Self-esteem .23(.04) 1.25* .20(.03) 1.22*** Decision making and risk taking:
Deliberation time .00(.00) 1 .01(.00) 1
Risk taking .22(1.09) 0.75 1.5(.89) .21***
Risk adjustment .00(.05) 1 .07(.04) .92*
Delay aversion .29(.20) 1.08 .44(.16) 1.56**
Quality of decision making .76(.31) .46** 1.35(.24) .25***
Overall proportional bet 1.2(1.1) 3.4*** 1.9(.95) 7.1***
20
Verbal Similarities .02(.00) .90* .02(.003) .91*
Child background
Gender (girls v. boys) .41(.10) 1.5*** .48(.08) .61*** Family Income (above v. below 60%) .26(.13) 1.23** .57(.10) 1.44***
Subjective SES
Perceived richer v. poorer .22(.24) .79 .40(.19) .96
Perceived richer v. same .11(.12) .89 .13(.10) .90