Detecting Image Forgery Based on Noise Estimation
Ahmed Alsomeet1 and Yusra Alibrahim2
1
Computer Department, Higher Telecommunication and Navigation Institute, PAAET, Kuwait
2
Computer Department, Secretarial and Office Management Institute, PAAET, Kuwait
Abstract
Image forgery is relatively easy in our time, which is due to the low cost of modern cameras. Another factor is the various numbers of images editing software that can run on multiple platforms such as laptops or smartphones; also any ordinary user can use most of the software. Therefor we cannot take image forgery for granted. In this paper, we will discuss a method that can be used to detect forged areas in an image using noise variance. The algorithm is as follows; first we will transform the allegedly forged image for RGB to HSV (hue-saturation-value). The second step is dividing the image into small non-overlapping image blocks. Next we calculate the noise in each individual image block. After that we use the recorded noise to calculate the noise variance in the image. Then we use a supervised clustering technique to find the forged areas of the image. Finally, the result is the image that was used as input with the forged areas being highlighted.
Keywords: Image forensic, Image manipulation, Tampering detection, Noise estimation.
1. Introduction
Image forgery has become very easy and almost anyone can forge an image in these days. The reason behind that is that digital cameras are fairly inexpensive now a day. Also photo editing software are simple and do not acquire a professional to forge an image. Since images play a very important role in the society these days and seeing how hard it is to detect a forged image just by looking at it. A commonly used method to mask the forgery in images is adding noise on random parts and areas of the forged image. Otherwise, the amount of noise in that image would be within a certain range. That means that all the image blocks form the original image have the same noise range, so if we compare the noise variance from any forged blocks with a block from the original image there would be a significant difference in the variance. Furthermore, if an image is forged by adding part of another image to the original image, the noise variance will also differ due to difference in the noise that is caused by the digital camera sensor and the atmosphere that the images were taken in. In this paper, we introduce a technique to identify the manipulated parts of an image by locating the inconsistency in the HSV saturation noise variance due to forgery. That is by transforming the given image from
RGB to HSV color space. Then, the image is partitioned into small non-overlapping image blocks, where the number of blocks per image will be discussed later on in this paper. The next step is to calculate the HSV intensity noise variance in each individual block using the estimation method [3]. Finally, an unsupervised clustering method is used to group and classify the image blocks that have similar saturation noise variance, to detect the forged parts or the parts that were added to the image from another source.
This paper is organized as follows. Section 2 will contain the methodology used in this paper. Section 3 will contain the experimental results. Finally, the conclusion 4.
2. Methodology
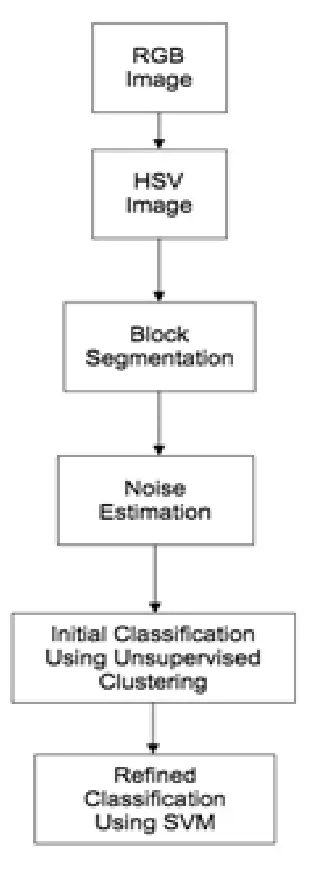
The method that was proposed in this paper trains the program to detect forgery in an image. The first step is to create the variance database by adding noise to authentic images to create a higher noise variance in some areas of the image. That is done by transforming the images from the RGB domain to the HSV color domain. The next step is partitioning the image into small non-overlapping image blocks. After that, the noise variance is estimated in each image block [3]. The step that comes after that is k-meas algorithm, which is also known as the unsupervised clustering algorithm to group the image blocks into two parts. Then the image is classified into to parts; the first being the image blocks that belong to the original image, the second part is the forged area which will be highlighted. The figure below will show a simple flow chart of how the algorithm works.
Fig. 1 Flow chart of the algorithm
2.1 Image Processing
www.ijiset.com
the Value denoted by V, which represents how far a color is from the center of the color wheel and takes values [0,1].
2.2 Block Segmentation
The forged regions of the suspicious image are detected by segmenting the image into RxR of non-overlapping image blocks that are used as input to the noise variance estimation algorithm. The regions of the image are all considered to be of equal size, if the block is located at the edge of the image then the image is padded with average value of the saturation that are adjacent to that block. To calculate the total number of non-overlapping blocks in the image, assuming that the image has MxN pixels we use the formula shown below using integer division.
(1)
Of course, the forgery detection depends highly on the size of the non-overlapping blocks. The reason for choosing a 32x32 block size is a result of multiple trial and error runs. According to [1] 32x32 is the optimal size to get the best results, that is by adding random Gaussian noise with standard deviation σ=5,10,15 and then using the algorithm in [1].
2.3
Image Noise Estimation
There are multiple methods that have been proposed to detect image forgery, which can be classified into three categories. The first of which is the block-based, the second being smoothing-based and the last method is a gradient based method. In this paper we discuss a block-based method. Choosing this method was due to the fact that it could detect forgeries even with images that have texture, even if the image does not have any homogeneous areas.
Let x be an image that is noise-free, we will add white Gaussian noise at random location on that image. The added noise has an unknown variance that should be estimated using PCA (principle component analysis).
2.4
Image Block Classification
The proposed method in [1] classifies the non-overlapping image blocks after noise variance is estimated. After that an unsupervised clustering algorithm (k-means) is applied to classify the non-overlapping image blocks into two parts, the manipulated regions and the regions that have not been manipulated. The way that the algorithm detects the manipulated regions is that it assumes that the regions that have been manipulated are smaller than the regions that have not been manipulated. That leads to having more points on the side of the cluster that represents the regions form the original image. The last step is using the output of the k-means as input to the SVM (support vector machines) training. After that they used the SVM to classify the regions of the image.
3. Experimental Results
Here we will discuss the results of the algorithm, after segmenting the image into non-overlapping image blocks.
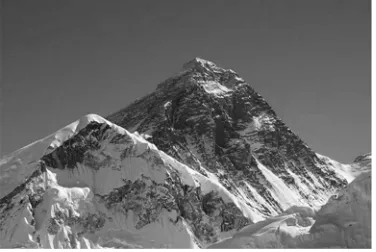
Fig. 3 Original Image
Fig. 4 Forged image (red scribble on the top left corner)
Fig. 5 Forgery detected with some error
4. Conclusion
In this paper, we discussed a technique that was proven in [1] that it has a high detection rate. First the image was transformed to the HSV domain. After that the PCA was applied to estimate the noise variance in the non-overlapping image blocks. After that we classified the image block using an ununiformed clustering algorithm. Finally, SVM was used to furthermore improve the detection rate and to detect what the k-means algorithm could not.
www.ijiset.com
Appendix
1. Description of the algorithm and the design of our
implementation
Table 1 This table shows the major steps in the algorithm
Original Paper Algorithm My Approach Transform image from
RGB to HSV
Transform image from RGB to HSV Block segmentation Block segmentation
Noise estimation Noise estimation Kmeans Kmeans
SVM I had problems with the SVM still working on it
2. Program Code
a1=imread('ABC.jpg'); a2=imread('ABC1.jpg'); a = imlincomb(.5,a1,.5,a2); figure(1) subplot(1,4,1) imshow(a1); subplot(1,4,2) imshow(a2); subplot(1,4,3) imshow(a);
Range_of_hue_value = [0.05 1]; minimum_saturation = 0.5; minimum_Regionsize = 2;
%%%%%%%%%%%%%%%%%%% % Convert image to HSV format
c = rgb2hsv(b);
% Denoise with a gaussian
b = imfilter(a, fspecial('gaussian', 15, 2));
%Convert the image to L*a*b* color space using makecform and applycform.
cform = makecform('srgb2lab'); lab_he = applycform(c,cform);
%Use kmeans to cluster the objects into three clusters using the Euclidean distance
%metric.
ab = double(lab_he(:,:,2:3)); nrows = size(ab,1);
ncols = size(ab,2);
nColors = 3;
% repeat the clustering 3 times to avoid local minima
[cluster_idx, cluster_center] =kmeans(ab,nColors,'distance','sqEuclidean','Replicate s',3);
pixel_labels = reshape(cluster_idx,nrows,ncols); figure(2)
imshow(pixel_labels,[]), title('image labeled by cluster index');
%Using pixel_labels, we can separate objects in hestain.png by color, which will
%result in three images.
segmented_images = cell(1,3);
rgb_label = repmat(pixel_labels,[1 1 3]);
for k = 1:nColors color = c;
color(rgb_label ~= k) = 0; segmented_images{k} = color;
end
figure(3) subplot(1,3,1)
imshow(segmented_images{1}), title('objects in cluster 1');
subplot(1,3,2)
imshow(segmented_images{2}), title('objects in cluster 2');
subplot(1,3,3)
imshow(segmented_images{3}), title('objects in cluster 3');
mean_cluster_value = mean(cluster_center,2); [tmp, idx] = sort(mean_cluster_value); blue_cluster_num = idx(1);
L = lab_he(:,:,1);
blue_idx = find(pixel_labels == blue_cluster_num); L_blue = L(blue_idx);
is_light_blue = im2bw(L_blue,graythresh(L_blue));
%Use the mask is_light_blue to label which pixels belong to the blue nuclei. Then
%display the blue nuclei in a separate image.
nuclei_labels = repmat(uint8(0),[nrows ncols]); nuclei_labels(blue_idx(is_light_blue==false)) = 1; nuclei_labels = repmat(nuclei_labels,[1 1 3]); blue_nuclei = c;
blue_nuclei(nuclei_labels ~= 1) = 0; figure(4)
imshow(blue_nuclei), title('blue nuclei');
% Threshold hue
Bin = c(:,:,1) > Range_of_hue_value(1) & c(:,:,1) < Range_of_hue_value(2) & c(:,:,2) > minimum_saturation;
% For filtering based on area
regions = regionprops(Bin, 'Area', 'Centroid',
'BoundingBox');
% Remove every region smaller than minRegionSize
regions(vertcat(regions.Area) < minimum_Regionsize) = [];
% Display image in grid
figure(5) image(a); axis image
hold on
for k = 1:length(regions)
plot(regions(k).Centroid(1), regions(k).Centroid(2),
'cx');
boundBox = repmat(regions(k).BoundingBox(1:2), 5, 1) + ...
[0 0; ...
regions(k).BoundingBox(3) 0;...
regions(k).BoundingBox(3) regions(k).BoundingBox(4);...
0 regions(k).BoundingBox(4);...
0 0];
plot(boundBox(:,1), boundBox(:,2), 'r');
end
hold off
References
[1] H. Gou, A. Swaminathan and M. Wu, “Noise Features for Image Tampering Detection and Steganalysis”, Proceedings of the 2007 IEEE International Conference on Image Processing, (2007), pp. 2893-2896.
[2] B. Mahdian and S. Saic, “Using Noise Inconsistencies for Blind Image Forensics”, Image and Vision Computing, vol. 27, no. 10, (2009), pp. 1497-1503.
[3] S. Pyatykh, J. Hesser and L. Zheng, “Image Noise Level Estimation by Principal Component Analysis”, IEEE Transactions on Image Processing, vol. 22, no. 2, (2013), pp. 687-699.