| INVESTIGATION
Variation in Position Effect Variegation Within a
Natural Population
Keegan J. P. Kelsey1and Andrew G. Clark Department of Molecular Biology and Genetics, Cornell University, Ithaca, New York 14853 ORCID ID: 0000-0002-6384-7220 (K.J.P.K.)
ABSTRACT Changes in chromatin state may drive changes in gene expression, and it is of growing interest to understand the population genetic forces that drive differences in chromatin state. Here, we use the phenomenon of position effect variegation (PEV), a well-studied proxy for chromatin state, to survey variation in PEV among a naturally derived population. Further, we explore the genetic architecture of natural variation in factors that modify PEV. While previous mutation screens have identified over 150 suppressors and enhancers of PEV, it remains unknown to what extent allelic variation in these modifiers mediate interindividual variation in PEV. Is natural variation in PEV mediated by segregating genetic variation in known Su(var) and E(var) genes, or is the trait polygenic, with many variants mapping elsewhere in the genome? We designed a dominant mapping study that directly answers this question and suggests that the bulk of the variance in PEV does not map to genes with prior annotated impact to PEV. Instead, wefind enrichment of topP-value ranked associations that suggest impact to active promoter and transcription start site proximal regions. This work highlights extensive variation in PEV within a population, and provides a quantitative view of the role naturally segregating autosomal variants play in modifying PEV—a phenomenon that continues to shape our understanding of chromatin state and epigenetics.
KEYWORDSPosition Effect Variegation (PEV); chromatin; natural variation; phenotypic variance; suppressor of variegation; enhancer of variegation
C
HROMATIN states, defined broadly as the combination of chromatin and bound factors that together impact chro-matin accessibility and gene expression, have clear evolution-ary importance (Schulze and Wallrath 2007). The ModEncode project has generated valuable data for use in understanding determinants and classification of chromatin states and corre-lation with functional consequences (modENCODE Consor-tium et al. 2010; Kharchenko et al. 2011; Ernst and Kellis 2012; Filionet al.2016). Despite rapid progress in chromatin biology, we still know little about variation in chromatin states among individuals and naturally segregating genetic variants that may be involved in generating these differences (Richards 2006, 2008; Bossdorfet al.2008; Hu and Barrett 2017). Any natural variant that serves to impact chromatin state may be atarget of natural selection, and it is of great interest to under-stand population genetic forces that drive differences between chromatin and genome accessibility of individuals.
Originally discovered by H. J. Muller, position effect varie-gation (PEV) has long been studied inDrosophila melanogaster and is widely accepted as a valuable tool in understanding dynamics of chromatin state and gene expression, especially with regards to the boundary between heterochromatin and euchromatin. The most commonly used form of PEV is the result of a specific X chromosome inversionwhitemottled-4,
or simplywm4(Muller 1930), which relocated the normally
euchromaticwhitegene next to pericentromeric heterochro-matin. The molecular impact of this relocation is now un-derstood to be a spreading of chromatin-associating factors that results in altered chromatin structure and gene silenc-ing ofwhitewithout known modification to coding sequence (Wallrath and Elgin 1995). Depending on the genomic back-ground, the phenotypic manifestation of this particular si-lencing is mosaic across the facets of the eye, resulting in a
“mottled”eye phenotype with local clones of cells in each eye showing an apparently stochastic response. Of significance, PEV is triggered by gene-chromosome rearrangements in Copyright © 2017 by the Genetics Society of America
doi:https://doi.org/10.1534/genetics.117.300306
Manuscript received May 14, 2017; accepted for publication August 31, 2017; published Early Online September 20, 2017.
Supplemental material is available online atwww.genetics.org/lookup/suppl/doi:10. 1534/genetics.117.300306/-/DC1.
many organisms, producing modified gene expression as a result of modified chromatin environment (Girton and Johansen 2008; Elgin and Reuter 2013).
Manifestation of PEV in theDrosophilaeye allows for ease of visible phenotyping and has generated a large body of work leading to the discovery of numerous PEV modifying factors, both genetic and environmental, that also impact chromatin and genome accessibility. These modifiers are typ-ically described as positively influencing gene expression at thewm4locus, termed suppressors of variegation, or Su(var),
or negatively influencing gene expression at wm4, termed
enhancers of variegation, or E(var). Screens for modifiers have identified over 150 loci that modify PEV (Ebertet al. 2004). Examples of modifiers of PEV and chromatin include Su(var)3-9,Su(var)2-5andpiwi. Su(var)3-9, Su(var)2-5, or HP1a, and maternal Piwi help to establish heterochromatin (Schottaet al.2002; Gu and Elgin 2013). HP1a interacts with Su(var)3-9, and is also required for the spreading of hetero-chromatin (Hineset al.2009). It is important to understand, however, that the vast majority of these modifiers have been identified through mutation screens, and may or may not represent loci harboring natural variation that impact the PEV phenotype. Despite the extensive literature on modifiers of PEV, there is currently little information on the range of PEV variation within a natural population—an importantfirst step to assessing any determinant of PEV in a population.
Genome-wide association studies (GWAS) initially gained favor in human studies as a way to perform a relatively unbiased search for common natural variants involved in a phenotype of interest. Using sets of inbred reference lines of D. melanogaster, GWAS has proven to be a powerful resource for generating unbiased, data-driven hypotheses, where a genome-wide search of candidate loci may be coupled with the extensive functional annotation and genetic tools already available. TheDrosophilaGenetic Reference Panel (DGRP)— a collection of genome-sequenced inbred lines of D. mela-nogaster(Mackayet al.2012; Huanget al.2014)—has become a handy resource for initial GWAS screens with Drosophila. Several groups have already successfully used the resource to identify novel variants involved in a wide range of traits, including sleep (Harbison et al. 2013), leg development (Grubbset al.2013), sperm competition (Chowet al.2012), host–microbiota interaction (Dobsonet al.2015), fecundity and fitness (Durham et al.2014), and nutritional indices (Uncklesset al.2015).
To better understand variation in PEV within a population, and the underlying genetic architecture of segregating natural variants involved in heterochromatin dynamics, we per-formed GWAS on F1 progeny of DGRP lines crossed towm4—
a line bearing an X-linked inversion that displays PEV of the white eye phenotype. PEV was quantified by novel digital image analysis of visible images captured with a dissecting microscope. We found extensive variation in PEV, our proxy for chromatin state, in the DGRP population. Despite this detailed work, wefind little evidence of association for seg-regating variants within known Su(var) and E(var) genes.
However, we do find variants having association with PEV to be over-represented in regions having a chromatin state indicative of active promoter and transcription start site (TSS)-proximal features. Furthermore, a comprehensive search across binding sites for factors that modify chromatin accessi-bility link numerous binding sites to PEV-associated variants, emphasizing regions with bistable chromatin states. Altogether, the evidence suggests autosomal dominant natural variation interacts with PEV through numerous, small effect loci that are enriched for transcription factor (TF) binding and sites of open chromatin, implying influence through gene expression or subtle changes to chromatin balance.
Materials and Methods
Drosophila stocks
Lines from the DGRP (Mackayet al.2012) were a gift from the Mackay laboratory. Line 1712 (Bloomington), which harbors the whitemottled-4,In(1)wm4(or simplywm4) locus on the X
chromosome and a second chromosome deletion and bal-ancer, Df(2L)2802/CyO, was used to assess variegation across the DGRP population. Canton-S and mutant eye color stocks, 245 (bw1) and 3605 (w1118) (Bloomington) provided
biological context in our eye color phenotype assay. Allflies were maintained on a standard cornmeal-molasses-sucrose-yeast me-dium and kept at 25°on a 12-hr light/dark cycle.
Experimental cross
In each of two replicate vials, 10 males from each of 124 DGRP lines were crossed to three virgin females of the 1712 stock and allowed to mate for 1 day. Mated 1712 females were then transferred to new food, allowed to lay eggs, and re-moved from the vial after 5 days. Variegating male prog-eny segregated into two phenotypic classes based on the second chromosome, curly winged (CyO), and noncurly winged (Df(2L)2802), and were aged at least 4–8 days before imaging.
Image capture and eye color quantification
Pigments in the eye ofD. melanogasterare synthesized by two, well-characterized metabolic pathways (Summers et al. 1982). These pigments are typically quantified through sep-arate extractions based on chemical properties (Ephrussi and Herold 1944). Often, only a single extracted pigment is used to describe eye color, and, although useful for detecting gen-eral differences, this method results in considerable loss of information. Even casual inspection of eye color patterns that manifest PEV reveals a far more complex range of differences, including pigment intensity, different hues of pigmentation including yellow, orange, brown, and red, and variation in patch size and morphology. To better capture the multidi-mensional aspects of eye color and PEV, and improve map-ping, we developed an imaging method that retains and fully describes eye color within a single assay.
microscope with an attached Cannon Rebel 6 megapixel dig-ital camera in a windowless room. Images were captured and stored using software from the camera manufacturer. After removing outliers and lines with more than three images, an average of 17.5 eyes (SD = 9.2) were imaged from each line, resulting in a total of 3966 images across all lines and second chromosome combinations. A standard gray card (Kodak, 18% gray) was imaged before and after each set of conditions to normalize against fluctuating light condi-tions. Ommatidia from images were isolated using a pipeline built in Cell Profiler 2.0 (Lamprechtet al.2007) and visually inspected. Images that failed to process were individually assessed and isolated in Photoshop. Isolated ommatidia and standard gray card images were then processed using custom scripts in R (R Development Core Team 2008). Om-matidia imagefiles were separated into red, green, and blue color channels and values were bounded between 0 and 1. Color channel values from each pixel of every image were normalized against the mean value of individual color chan-nels from matched gray card pairs according to a generalized gamma adjustment using the formula,
Vg¼Vout; where g¼log 0:82
logs (1)
wheresis the individual mean color channel (red, green, or blue) for the gray card imaged before and after samples; 0.82 refers to the idealized 18% gray card value in RGB color space. V is the color channel value for an individual pixel within the image,gis the normalizing function, andVout is
the normalized color value. Thefinal summarized output for each eye and image resulted in three values, including the mean of each normalized red, green; and blue color channel.
Image assay validation
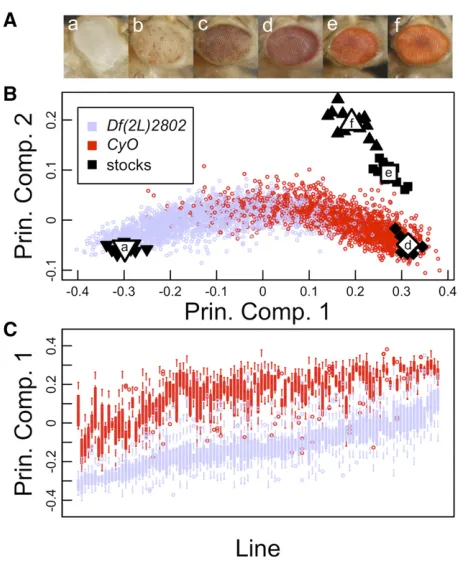
Eye-color stocks (Figure 1A) were imaged, and Principal Component Analysis (PCA) using the values from the indi-vidual red, green, and blue color channels of each image, sufficiently described the multivariate data. Nonpigmented (white) and pigmented stocks (bw1, wm4, and Canton-S)
exhibited large differences described by principal compo-nent 1 (PC1), and pigmented stocks (bw1,wm4, and
Can-ton-S) exhibited differences primarily described across principal component 2 (PC2) (Figure 1B). PC1 accounted for 87.4% (SD = 24.4%) of variance in the data, and PC2 accounted for 12.5% (SD = 9.2%). Component loadings provide detail on how each color channel contributes to the dispersion of the data, where blue and green channels have a similar impact on PC1 (20.72 and20.68, respec-tively), while the red channel has a minor impact (20.12). This is in contrast to PC2, where the red channel is the pri-mary driver (0.94), and blue and green channels have minor roles (20.30 and 0.15, respectively). MANOVA using PC1 and PC2 from each individual image (Equation 2) highlights the ability of this approach to discriminate across eye groups of the four stocks (P-value,2.2 3 10216).
Statistical analysis of phenotype
All subsequent analysis was performed in R (R Development Core Team 2008). The mean red, green, and blue color val-ues for each image were used input for PCA. Eye groups were assessed using MANOVA and the formula,
Ypc1;pc2;pc3¼mþSþe (2)
whereYis PC1, PC2, and PC3 from each image, andSis the stock of origin (1712, 245, or 3605; Canton-S). Differences between experimental groups were assessed using ANOVA andfit using separate principal components from each image with the formula,
Y¼mþLþCþVþLxCþe (3)
where Yis either PC1, PC2, or PC3,L is the DGRP line of origin,Cis the second chromosome background (CyOorDf
(2L)2802), andVis the replicate vial (A or B). Although the experimental design contained fully crossed factors, interac-tion termsLxV;CxV;andLxCxV were not statistically signifi -cant and were dropped from the model. Proportion of variance for each effect is calculated as,
eta2¼SSeffect SStotal
(4)
whereSSis the sum of squares. Broad-sense heritability (H2)
was calculated using
H2¼Vg
Vp (5)
and based on the linear model,
Y¼mþLþe; (6)
where Yis a single principal component and single second chromosome background combination, andLis the DGRP line of origin. The proportion of variance explained by line differ-ences was considered the variance attributed to genetic components (Vg), and the total variance of the sample
was considered the variance attributed to phenotype (Vp).
For each second chromosome background,H2was summed
across the three PCs and weighted according to the pro-portion of variance explained by each PC (Supplemental Material, Table S1).
Genotypes and association testing
Genotypes and annotation for DGRP lines were downloaded from the website, dgrp.gnets.ncsu.edu, and all variants and
findings are reported using build BDGPR5/dm3. As others have observed, the DGRP lines display small amounts of cryptic genetic relatedness (He et al. 2014; Huang et al. 2014). Here, we used GEMMA (Zhou and Stephens 2012) to both estimate a centered genetic relatedness matrix (GRM), accounting for cryptic relatedness, and implement the univariate mixed linear model (MLM). Individual genetic variants were treated as a fixed effect, and the GRM was included as a random effect. Each of the two experimental populations [CyOandDf(2L)2802second chromosome back-grounds] were used as separate input, providing two inde-pendent sources of association values. Response variables, PC1 line means from males only, were regressed against each variant using single marker association (SMA). GRMs were estimated separately for each background based on lines with observed phenotypes. When selecting source variants for es-timating GRMs, PLINK v1.07 (Purcellet al.2007) was used to prune SNPs for Linkage Disequilibrium (indep function with parameters 50, 10, and 2), and to remove X chromosome SNPs. Effect sizes (Cohen’s d) and 95% upper and lower confidence limits were based on SMAP-values and respective allele sample sizes, and determined using the function, pes, within the R package compute.es (Del Re 2013). In all 107 lines were used with aCyOsecond chromosome
back-ground and 109 lines were used with aDf(2L)2802second chromosome background. Testing was performed across 775,689 (CyO) and 928,587 (Df(2L)2802) biallelic variants (SNPs and indels) with a MAF of 0.05 or greater. Due to the high correlation between phenotype and top associations of the two experimental populations, subsequent analysis was performed using only theDf(2L)2802GWA data. Bootstrap analysis was used to generated expected site class frequen-cies. Site classes were counted from 1000 randomly selected common variants, and an expected distribution was achieved through 10,000 iterations of resampling. For variants with more than one annotated class, only one class was selected, and priority was ranked as follows; nonsynonymous . ncRNA.synonymous.UTR.intronic.intergenic. The prop.test in R was used to assess the ratio of nonsynonymous to synonymous SNP counts within exonic variants between that observed counts from top GWA SNPs and mean counts from randomly selected SNPs of the above bootstrap analysis. P-value enrichment was assess for theDf(2L)2802200 kb deletion. Enrichment was quantified as the proportion of variants within the region having P-values ,0.1. Expected distributions for each chromosome arm were generated by randomly sampling 1000 times identical length linked seg-ments and similarly calculatingP-value enrichment.
Candidate gene analysis
of segregating sites in the 105 candidate genes was then com-pared to the expected distribution of proportions.
GCTA v1.25.2 (Yang et al. 2011) was iteratively called using phenotypes and GRMs generated from lines containing theDf(2L)2802background chromosome. The options–reml and–reml-alg 2 were used to estimate statistical explanation of among-line phenotypic variance attributed to top rank and random SNPs. Attempts to set–grm-cutoff resulted in an im-perfect comparison between the three SNP groups (top hits, PEV modifiers only, and random sets) as, across SNP counts, different lines were dropped given the different GRMs. There-fore, to maintain an equal comparison between all groups,
–grm-cutoff was not set. SE were reported for top hits and top hits within PEV modifying genes; however, this informa-tion was not reported for permuted sets of random SNPs. In-stead, 100 iterations of random permutations were used to generate lists of SNPs for further generating GRMs. The mean of expected attributed variance was reported the randomly permuted lists, along with a SD of means.
Genomic analysis
The nine-state genome-wide combinatorial chromatin state annotation is described in Kharchenkoet al.(2011), and anno-tationfiles were sourced fromwww.modencode.org. Expected nine-state distributions were generated in the experimental population through sampling autosomal variants for state assignment. 1000 variants were randomly selected and chromatin states were counted. This process was repeated 100 times. ChIP-chip and ChIP-seq files were also down-loaded from ModENCODE (www.modencode.org). If repli-cate samples existed, only onefile was randomly selected for analysis and composite files, if they were made available, were used instead of individual samples. Comparison be-tween the expected distribution of variants within binding sites and variants enriched with associations to PEV was performed as described above; 1000 autosomal variants were selected at random, and variants within binding sites were counted. The distribution of counts, as generated through 10,000 iterations, was then compared to observed counts from 1000 of the topP-value ranked associating var-iants. A full list of factors with respective ModENCODE IDs and observed and expected counts has been made available (File S3).
Data availability
Original eye images are available upon request.File S1 con-tains PEV phenotype values. File S2 contains a full list of variants with respective associationP-values.File S3contains observed and expected counts of top PEV associations within annotated chromatin features.
Results
Natural variation in background genetic effects on wm4expression
To quantify natural variation in PEV, we made use of the DGRP. The PEV phenotype was expressed by crossing males
from inbred DGRP lines to virgin females carrying the wm4
allele on the X chromosome. F1 variegating males were iden-tical across a single X, third, and fourth chromosome, segre-gating according to one of two second chromosomes, and varying with respect to a full haplotype from each of the DGRP lines assayed (Figure S1). The two second chromo-somes differ primarily with respect to a 200 kb deletion in 25F2–25F5 on the nonbalancing chromosome, Df(2L) 2802, and inversions on the balancing chromosome, CyO. Experimental F1 progeny exhibited a wide range of eye pig-mentation differences, showing variation that spanned a complete lack of pigmentation to eyes that were heavily pig-mented (Figure S2). The quantitative image assay further detailed a broad phenotypic spread in PEV, with PC1 and PC2 values spanning between an eye mutant that lacks pig-mentation (white) and mutants of known pigment defi cien-cies (Figure 1B). Reapplying PCA to just the mean red, green, and blue color values of images from each of the F1 variega-tion males, indicates that PC1 captures the vast majority of variance in the experimental data, 97.4% (SD = 18.6%), while PC2 and PC3 only describe a small proportion of vari-ance, 2.4% (SD = 2.9%) and 0.2% (SD = 0.9%). Using PCA on color images of PEV individuals, effectively allows the simplification of a multivariate data source to a single describing variable, PC1, with minimal (2.6%) loss of data, and provides a robust univariate phenotype for association mapping.
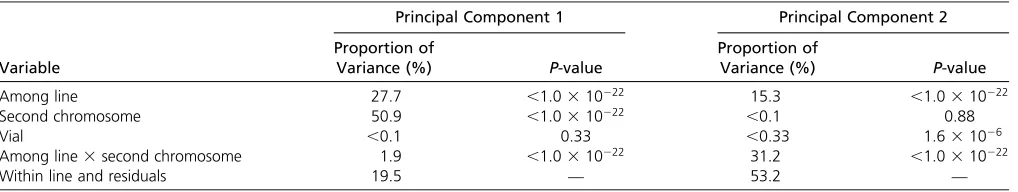
ANOVA using individual PCs provides an assessment of importance ascribed to each of three experimental variables; among-line differences, second chromosome differences, and replicate environments (Equation 3 and Table 1). Combined genetic components explain 80.5% of the phenotypic variance attributed to PC1, where second chromosome differences sep-arately explained 50.9% of the variance, among-line variation (our source of natural variation) explained 27.7% of the variance, and 1.9% of the variance was explained through genetic interactions of second chromosome background and individual lines. Partitioning the sample by presence/ absence of the second chromosome deficiency provides two separate measures of broad-sense heritability (H2) of
PEV within the DGRP population. Among-line differences explained over half of the phenotypic variance, 59.4 and 57.4%, for the DGRP populations within CyO and Df(2L) 2802 second chromosome backgrounds (Table S1). These data suggest that a large portion of the observed variation in PEV, within respective second chromosome backgrounds, is attributed to segregating genetic variants among the nat-urally derived DGRP haplotypes.
for almost half (49.5%) of the phenotypic variance observed, considerably more than explained through natural variation. The consequences of this highlight two potential scenarios. First is the possibility of an unannotated mutation in either a Su(var) or E(var) between the second chromosomes. A sec-ond possibility is that the totality of the deletion onDf(2L) 2802, a deletion of200 kb, acts to enhance variegation through a sponge or sink model, similar to what is proposed to occur with the Y chromosome (Francisco and Lemos 2014); we cannot distinguish between these possibilities.
Genome-wide association testing
To assess the contribution of segregating variants to PEV, SMA was performed genome-wide using variegating F1 males from crosses between DGRP lines and thewm4reporter. Full
hap-lotypes from each of the distinct DGRP lines provided source variation for association mapping. PC1 from each of the two second chromosome populations were used as separate input into a univariate MLM accounting for cryptic relatedness (He et al.2014). Testing was performed across common biallelic variants (SNPs and indels, MAF $ 0.05) using haplotypes extracted from DGRP chromosomes 2, 3, and 4. The X chro-mosome, carrying thewm4reporter, was invariant across
ex-perimental populations. Quantile-quantile (Q-Q) plots indicate P-values from each experimental population overall conform well to the null distribution (Figure S4). Effect sizes follow a trend where Cohen’sdincreases as MAF decreases (Figure S5). A comparison of theP-value rank ordered 1000 top associa-tions shows 75.3% overlap between the two experimental populations, consistent with a strong correlation in PEV between the two groups.
The top-ranked associations are enriched for variants that are located in exons, UTRs, and ncRNAs, with reduced rep-resentation within intronic and intergenic regions (Figure S6). From this set of 1000 top associations, a comparison of synonymous to nonsynonymous SNPs within exonic sites shows no significant difference between ratios of observed counts when compared to randomly drawn sets of SNPs (pro-portion test, P-value = 1). Among the smallest P-values, only two variants were identified as resulting in a missense mutation, and both showed reduced strength in association across independent GWAS samples (Table S2). Although we note general enrichment of top-ranked associations in exons, we see no data to indicate a strong bias toward sites that would result in change to protein function. We also note no
P-value enrichment within theDf(2L)2802second chromo-some deficiency region (Figure S7).
Despite many variants identified as having an effect size$1, and with enrichment proximal to functional regions, our small sample sizes, substantial background effect on phe-notype, as noted through second chromosome differences, and abundance of multiple variant classes in top associations reduce confidence in traditional functional follow-up. A full list of variants with associationP-values has been made avail-able (File S2).
Dominant, common variants within known autosomal PEV modifiers fail to fully account for
among-line differences
Despite low power to identify individual causal variants with high confidence, an extensive literature on known genic modifiers of PEV affords the opportunity to assess significance of ensembles of variants. To quantify the impact of naturally occurring dominant polymorphism in known modifiers of PEV, we identified variants in Su(var) and E(var) genes. The term, “Modifier of Variegation” was searched within FlyBase, and over 200 genes satisfied this criterion. As our experimental setup resulted in individuals sharing a common X chromosome, the set of modifiers was reduced to 105 auto-somal genes (Table S3). Variants within, or extending62 kb of identified autosomal modifiers were grouped and results from the above SMA were used. A total of 16,640 variants (6153 having MAF$0.05) was identified in autosomal mod-ifiers of PEV within the 109 lines having the Df(2L)2802 second chromosome background. Importantly, of common variants (MAF $0.05) in this reduced set of PEV genes, only
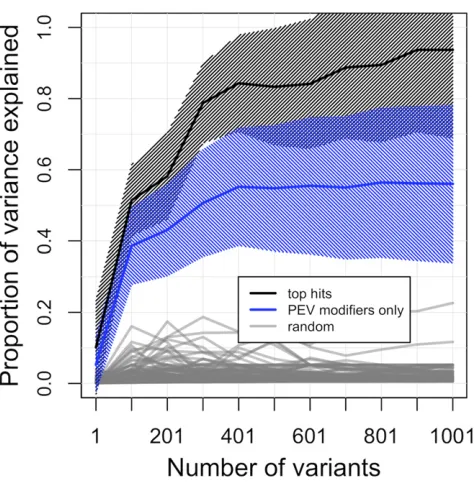
five were also identified in the top 1000 genome-wide SMA hits, making up,0.5% of top associated variants. Thesefive variants hold overallP-value ranks of 379, 553, 772, 820, and 821, indicating that a majority of natural variants with likely impact to phenotypic variance of PEV do not reside in, or near, genes with known impact to PEV. GCTA (Yang et al. 2011) was used to compare the cumulative statistical expla-nation of the among-line phenotypic variance between clas-ses of variants as grouped by top GWA variants and top variants within PEV modifier. Top variants identified through GWA, rank-ordered by P-value, consistently explained a greater proportion of among-line variance than variants within prior known genic PEV modifiers (Figure 2 andFigure S8). The 1000 top ranking overall variants statistically
Table 1 Partitioning the variance in PEV attributed to genetic and environmental factors
Variable
Principal Component 1 Principal Component 2
Proportion of
Variance (%) P-value Proportion ofVariance (%) P-value
Among line 27.7 ,1.0310222 15.3 ,1.0310222
Second chromosome 50.9 ,1.0310222 ,0.1 0.88
Vial ,0.1 0.33 ,0.33 1.631026
Among line3second chromosome 1.9 ,1.0310222 31.2 ,1.0310222
explained 93.7% (SE = 24.8%) of variance due to genetic differences, and the 1000 top ranking variants in known PEV genes explained considerably less at 56.0% (SE = 22.2%). These sets are both compared to variants randomly drawn from the autosomal genome which explained, on average, 2.3% (SD = 2.7%) of phenotypic variance.
Although there is strong evidence for involvement of genes from Table S3 in PEV, there is little data indicating natural variation within these genes is responsible for differences in PEV among lines. This is not completely surprising, however, as many known Su(var) and E(var) genes show conservation across species (Fodoret al.2010), suggesting little room for variation in coding sequence. Indeed, two additional pieces of data further explain the lack of association with variants in known PEV modifiers, and suggest purifying selection within the modifiers. First, the observed SFS, within the experimen-tal population, shows an increase in low MAF variants, and a decrease in variants$0.05 within known PEV genes, com-pared to sets of genes randomly selected from the autoso-mal genome (Figure 3A). Second, known PEV modifying genes exhibit a paucity of segregating sites compared to an expected distribution, having fewer segregating sites than 99.7% of gene sets randomly selected from autosomes (Fig-ure 3B).
General feature enrichment of top associations
As we see little evidence for association within known Su(var)s and E(var)s, we then ask if other genomic features show an over-representation of association with PEV. Regulatory re-gions are a logical next set of features to query given that we
find no strong evidence linking natural PEV variation to protein coding variation, hypothesizing instead that PEV-associated variants primarily impact regulation of protein quantities and not protein function and quality. We make use of extensive public data from ModEncode to classify genomic regulatory regions. Feature-predictive combinations of specific histone modifications have been shown to strongly correlate with functional elements of the genome (modENCODE Consor-tiumet al.2010), and are an excellent source of labeled data for quick surveys. We next asked if particular signatures were over or under-represented in the topP-value ranked associa-tions. Using a previously built combinatorial 9-state (c1–c9) assignment from S2 and BG3 cells (Kharchenkoet al.2011), we queried the genome labeled with discrete, nonoverlapping c1–c9 for an over-representation of PEV-associations. First, we generated an expected proportion of labels using all autosomal
Figure 2 Proportion of among-line phenotypic variance explained within theDf(2L)2802second chromosome population using GCTA. Compari-sons between SNP groupings include; the most significant GWA variants (black line), variants within know PEV modifiers only (blue line), and randomly selected autosomal variants (gray line). Shading represents SE.
variants (Figure S9). We then selected the top 1000 SMA variants, as rank-ordered by P-value, and compared the observed counts to an expected distribution. We found an over-representation of signature, c1, consistent across BG3 and S2 cells (.1 SD) and lowered representation of signa-tures c4, c6, and c7 (,1 SD). Signature c1 is described as representing active promoter and TSS-proximal regions.
We next hypothesized that enrichment of top P-value ranked associations at active promoter and TSS regions may be the result of a small number of factors driving a signal, i.e., altered binding of a single TF at multiple regions in the genome is the causative force driving natural differences PEV. To test for enrichment of top P-value ranked associa-tions within binding sites of individual chromatin-binding factors, analysis was extended to survey ChIP-chip and ChIP-seq data, also made available through the modENCODE project (modENCODE Consortium et al.2010; Kharchenko et al.2011). This resource is comprised of hundreds of exper-iments, sampled across various developmental states and cell types, and contains observed binding sites of factors such as histone modifications, TFs, and non-TFs. Again, for each fac-tor, we search for enrichment of top rank-ordered SMA var-iants within the observed binding sites (Figure S10). Instead offinding one or two factors having variants with enriched P-values located within binding sites, we note that several factors displayed a strong enrichment with PEV-associated variants (Figure 4). We observed enrichment within chroma-tin binding sites of know PEV modifiers, such as JIL-1 (Lerach et al. 2006), LSD1 (Di Stefanoet al. 2007), and BEAF-32 (Gilbertet al.2006), among others. Further, we note enrich-ment of top ranked associations in sites that suggest natural variation has a particular impact on TSS regions that show a
“balanced”or“bistable”chromatin state. Bistable chromatin sites are sites that may be influenced to either exhibit active or repressed gene expression. We note statistically significant differences in nearly all bound factors that strongly charac-terize bistable sites; ASH1, H3K4me1, H3K4me2, H3K4me3, and RNA Pol II, including depletion of H3K27me3 (Kharchenko et al.2011). Although purely statistical, the over-representation of associations in sites bound by known PEV modifiers further suggests that natural autosomal genetic variation primarily modify PEV through influencing genome-wide expression rates or chromatin state occupancy and balance, not through altering protein function of individual genic modifiers.
Discussion
We designed an assay to identify autosomal nonrecessive variants involved in differences in PEV between naturally derived lines ofD. melanogaster. We identified a wide range of PEV in the population, indicating presence of natural var-iation in chromatin state and epigenetic features. Despite large PEV-induced pigmentation differences between pheno-typed lines, wefind little evidence for involvement of poly-morphic sites within known Su(var) and E(var) genes that contribute to these differences in PEV. Our top SMA
associa-tions further indicate that natural differences in response to PEV are not the primary result of changes in protein function among lines. We insteadfind that regions of enriched asso-ciation to PEV are over-represented for promoter and TSS-proximal regions with an additional emphasis on sites that display bistable chromatin features. This suggests that
autosomal interactions with differences in PEV, i.e., differ-ences in heterochromatin formation and/or maintenance, are the combined result of many small effect loci that accu-mulate differences, and are linked to modified rates of tran-scription, either through small changes to specific TF binding sites or broad changes in chromatin state and chromatin mark distributions.
Furthermore, our data fit the Site Exposure Model of Variegated Silencing (Ahmad and Henikoff 2001), where a variegated state is the result of bistable features between TF binding and chromatin features. Remarkably, thesefindings have precedent in the PEV system andfit extremely well with priorfindings indicating a key driver behind mosaic features of variegation is a bistable equilibrium between TF binding and heterochromatin content (Ahmad and Henikoff 2001). Here, it was found that by simply varying levels of a GAL4 transcriptional activator to a heterochromatin-embedded promoter, heterochromatin state could be disrupted. In the model proposed, termed The Site Exposure Model of Varie-gated Silencing (Widom 1999; Ahmad and Henikoff 2001), kinetics of DNA-histone contact dictate ability of a TF to bind a promoter or enhancer feature, and thus influence gene expression. Features that increase contact between TF binding and activator, include changes to TF abundance or changes to TF binding efficiency such as through mutated underlying binding sequence, changes to nucleosome occu-pancy (observed through histone and chromatin marks), or changes to abundance of TF guide molecules. Applied to our study, this suggests that each individual shows differences in PEV due to a large number of sites that impact expression rates of factors that then impact binding efficiency of TFs at thewm4locus. This model also predicts that changes to
chro-matin content,i.e., an increase or decrease in heterochroma-tin, can, in turn, impact sensitive loci throughout the genome and influence gene expression. Indeed, thisfits with observa-tions that differing natural Y chromosomes, a giant source of heterochromatin, impact gene expression in autosomes (Lemoset al.2008, 2010).
However, as the effect sizes for all associated variants are small, the combined set of variants likely do not fully explain differences in PEV across our sample set; indicating there is yet unobserved genetic variation that accounts for differences among lines. It is important to note that this query of natural variation was not exhaustive and only considered autoso-mal dominant variants with a particular focus on common variants. We reasoned that a heterozygous screen would be informative, because most Su(var) and E(var) allelic effects are dominant, but we note there is every reason to believe that recessive genetic modifiers of PEV exist also and were missed in our screen. Importantly, we did not query G3G interac-tions or Y-linked variants, known contributors to PEV and gene expression differences in natural populations (Lemos et al. 2008, 2010). Finally, it is important to consider that the autosomal loci identified here only show correlation with differences in PEV; it is not known at this time if these loci represent causal drivers of differences in PEV.
Acknowledgments
We thank Dan Barbash and Jason Mezey for thoughtful critique and comments throughout all stages of the work, and Sally Elgin for important personal communications. Several members of the Clark laboratory provided support through general discussion and expertise, including; Jen Grenier, Clement Chow, Rob Unckless, Julien Ayroles, Roman Arguello, Margarida Cardoso Moreira, Tim Connallon, Angela Early, and Grace Chi. Finally, we thank the time and effort of reviewers for their detailed comments and helpful critique. This work was supported by R01 GM119125.
Literature Cited
Ahmad, K., and S. Henikoff, 2001 Modulation of a transcription factor counteracts heterochromatic gene silencing inDrosophila. Cell 104: 839–847.
Bossdorf, O., C. L. Richards, and M. Pigliucci, 2008 Epigenetics for ecologists. Ecol. Lett. 11: 106–115.
Chow, C. Y., M. F. Wolfner, and A. G. Clark, 2012 A large neuro-logical component to genetic differences underlying biased sperm use inDrosophila. Genetics 193: 177–185.
Del Re, A. C., 2013 compute.es: compute effect sizes. R Package Ver-sion 0.2-2. Available at: http://cran.r-project.org/web/packages/ compute.es. Accessed: September 1, 2015.
Di Stefano, L., J.-Y. Ji, N.-S. Moon, A. Herr, and N. Dyson, 2007 Mutation of Drosophila Lsd1 disrupts H3–K4 methyl-ation, resulting in tissue-specific defects during development. Curr. Biol. 17: 808–812.
Dobson, A. J., J. M. Chaston, P. D. Newell, L. Donahue, S. L. Hermann
et al., 2015 Host genetic determinants of microbiota-dependent nutrition revealed by genome-wide analysis ofDrosophila mela-nogaster. Nat. Commun. 6: 6312.
Durham, M. F., M. M. Magwire, E. A. Stone, and J. Leips, 2014 Genome-wide analysis inDrosophilareveals age-specific effects of SNPs onfitness traits. Nat. Commun. 5: 4338. Ebert, A., G. Schotta, S. Lein, S. Kubicek, V. Krausset al., 2004 Su(var)
genes regulate the balance between euchromatin and heterochro-matin inDrosophila. Genes Dev. 18: 2973–2983.
Elgin, S. C., and G. Reuter, 2013 Position-effect variegation, het-erochromatin formation, and gene silencing inDrosophila. Cold Spring Harb. Perspect. Biol. 5: a017780.
Ephrussi, B., and J. L. Herold, 1944 Studies of eye pigments of
Drosophila. I. Methods of extraction and quantitative estimation of the pigment components. Genetics 29: 148.
Ernst, J., and M. Kellis, 2012 ChromHMM: automating chromatin-state discovery and characterization. Nat. Methods 9: 215–216. Filion, G. J., J. G. van Bemmel, U. Braunschweig, W. Talhout, J.
Kindet al., 2016 Systematic protein location mapping reveals five principal chromatin types inDrosophilacells. Cell 143: 212– 224.
Fodor, B. D., N. Shukeir, G. Reuter, and T. Jenuwein, 2010 Mam-malian Su(var) genes in chromatin control. Annu. Rev. Cell Dev. Biol. 26: 471–501.
Francisco, F. O., and B. Lemos, 2014 How do Y-chromosomes
modulate genome-wide epigenetic states: genome folding, chro-matin sinks, and gene expression. J Genomics 1: 94–103. Gilbert, M. K., Y. Y. Tan, and C. M. Hart, 2006 TheDrosophila
boundary element-associated factors BEAF-32A and BEAF-32B affect chromatin structure. Genetics 173: 1365–1375.
Grubbs, N., M. Leach, X. Su, T. Petrisko, J. B. Rosario et al., 2013 New components ofDrosophilaleg development identified through genome wide association studies. PLoS One 8: e60261. Gu, T., and S. C. R. Elgin, 2013 Maternal depletion of Piwi, a
component of the RNAi system, impacts heterochromatin for-mation inDrosophila. PLoS Genet. 9: e1003780.
Harbison, S. T., L. J. McCoy, and T. F. Mackay, 2013 Genome-wide association study of sleep inDrosophila melanogaster. BMC Geno-mics 14: 281.
He, B. Z., M. Z. Ludwig, D. A. Dickerson, L. Barse, B. Arunet al., 2014 Effect of genetic variation in a Drosophila model of diabetes-associated misfolded human proinsulin. Genetics 196: 557–567.
Hines, K. A., D. E. Cryderman, K. M. Flannery, H. Yang, M. W. Vitaliniet al., 2009 Domains of heterochromatin protein 1 re-quired forDrosophila melanogasterheterochromatin spreading. Genetics 182: 967–977.
Hu, J., and R. D. H. Barrett, 2017 Epigenetics in natural animal populations. J. Evol. Biol. 30: 1612–1632.
Huang, W., A. Massouras, Y. Inoue, J. Peiffer, M. Ràmia et al., 2014 Natural variation in genome architecture among 205 Dro-sophila melanogastergenetic reference panel lines. Genome Res. 24: 1193–1208.
Kharchenko, P. V., A. A. Alekseyenko, Y. B. Schwartz, A. Minoda, N. C. Riddleet al., 2011 Comprehensive analysis of the chroma-tin landscape inDrosophila melanogaster. Nature 471: 480–485. Lamprecht, M. R., D. M. Sabatini, and A. E. Carpenter,
2007 Cellprofiler: free, versatile software for automated bi-ological image analysis. Biotechniques 42: 71–75.
Lemos, B., L. O. Araripe, and D. L. Hartl, 2008 Polymorphic Y chromosomes harbor cryptic variation with manifold functional consequences. Science 319: 91–93.
Lemos, B., A. T. Branco, and D. L. Hartl, 2010 Epigenetic effects of polymorphic Y chromosomes modulate chromatin components, immune response, and sexual conflict. Proc. Natl. Acad. Sci. USA 107: 15826–15831.
Lerach, S., W. Zhang, X. Bao, H. Deng, J. Girtonet al., 2006 Loss-of-function alleles of the JIL-1 kinase are strong suppressors of position effect variegation of thewm4allele inDrosophila.
Ge-netics 173: 2403–2406.
Mackay, T. F., S. Richards, E. A. Stone, A. Barbadilla, J. F. Ayroles
et al., 2012 The Drosophila melanogaster genetic reference panel. Nature 482: 173–178.
modENCODE ConsortiumRoy, S., J. Ernst, P. V. Kharchenko, P. Kheradpouret al., 2010 Identification of functional elements and regulatory circuits by Drosophila modENCODE. Science 330: 1787–1797.
Muller, H. J., 1930 Types of visible variations induced by x-rays in
Drosophila. J. Genet. 22: 299–334.
Purcell, S., B. Neale, K. Todd-Brown, L. Thomas, M. A. Ferreira
et al., 2007 Plink: a toolset for whole-genome association and population-based linkage analysis. Am. J. Hum. Genet. 81: 559–575.
R Development Core Team, 2008 R: A Language and Environment
for Statistical Computing. R Foundation for Statistical Comput-ing, Vienna, Austria.
Richards, E. J., 2006 Inherited epigenetic variation—revisiting soft inheritance. Nat. Rev. Genet. 7: 395–401.
Richards, E. J., 2008 Population epigenetics. Curr. Opin. Genet. Dev. 8: 221–226.
Schotta, G., A. Ebert, V. Krauss, A. Fischer, J. Hoffmann et al., 2002 Central role of Drosophila Su(var)3–9 in histone H3– K9 methylation and heterochromatic gene silencing. EMBO J. 21: 1121–1131.
Schulze, S. R., and L. L. Wallrath, 2007 Gene regulation by chro-matin structure: paradigms established in Drosophila mela-nogaster. Annu. Rev. Entomol. 52: 171–192.
Summers, K. M., A. J. Howells, and N. A. Pyliotis, 1982 Biology of eye pigmentation in insects. Adv. Insect Physiol. 16: 119– 166.
Unckless, R. L., S. M. Rottschaefer, and B. P. Lazzaro, 2015 A genome-wide association study for nutritional indices in Dro-sophila. G3 (Bethesda) 5: 417–425.
Wallrath, L. L., and S. C. Elgin, 1995 Position effect variegation in
Drosophila is associated with an altered chromatin structure. Genes Dev. 9: 1263–1277.
Widom, J., 1999 Equilibrium and dynamic nucleosome stability. Methods Mol. Biol. 119: 61–77.
Yang, J., S. H. Lee, M. E. Goddard, and P. M. Visscher, 2011 GCTA: a tool for genome-wide complex trait analysis. Am. J. Hum. Genet. 88: 76–82.
Zhou, X., and M. Stephens, 2012 Genome-wide efficient mixed-model analysis for association studies. Nat. Genet. 44: 821– 824.