ISSN: 1992-8645 www.jatit.org E-ISSN: 1817-3195
349
CHAOS OF HENON MAP BASED ON THE COUPLED
NETWORKS
XUELIAN SUN1, KUIFENG ZHENG1, LIDONG WANG1, WEI ZHAO1, XUEFENG SUN2
1 School of Science, Dalian Nationalities University, Dalian 116600, Liaoning,China 2 Educational Technology Center, Jilin University, Changchun 130012, Jilin, China
ABSTRACT
In this paper, the relationship between the parameters of Henon map is studied, and the chaos of Henon map is also discussed based on different coupled networks. From the simulate results, we found with the increasing of parameter a the chaos of Henon map will be emerged. At the same time, the transition from non-chaotic to chaotic in coupled networks is exhibited, although the parameters in non-chaotic regions before they are coupled together.
Keywords: Henon Map, Chaos, Lyapunov Exponent, Coupled Networks
1. INTRODUCTION
The study of complex networks has most interests to the understanding of behaviors of the network dynamics. In a network, a individual can be represent by the node, the edge is defined relationship of two individuals[1]. With the continuous rise of the chaotic dynamics, chaos in coupled dynamical networks is an increasingly prominent issue, as well as an important work. Henon map is applied to energy forecasting, chemical production, and as well as have a good handle turbulence phenomena[2-3].According to these, we take two-dimensional Henon map as example to apply to some coupled networks, so as to verify the condition of chaotic phenomena in the superposition situation. Meanwhile, we add the nodes’ number to N , which can apply to some big coupled networks[4]. Moreover, on this basis ,we analyze the situation of initial-chaotic Henon map in the coupled network, and research in different parameters, the different influences that different coupled networks offer, which can explain more clearly the influence of coupled networks in the Henon map by comparison.
The rest of this paper is organized as follows: In section 2, the chaos of Henon map is discussed in detail. Based on simulation result, the chaos of three different networks are analyzed in section 3. Finally, conclusions are presents in section 4.
2. LYAPUNOV EXPONENT AND THE
HENON MAP
2.1 Lyapunov Exponent
Lyapunov exponent is a kind of factor which can describe the way to get the chaotic state in the iterative process. We can definite as following when symbol λ stands for it[5-7],
1
0
1
lim ln | |
i
n
n
i x x
dF
n dx
λ −
→∞ = =
=
∑
(1)λ is stand for Lyapunov exponent ,which also means the separated index caused by each iteration index in the amounts of iterations[6]。
If λ>0, two adjacent points move closer to merger into one point, which stands for steady and periodic movement. On the other hand, if λ>0, it means the two adjacent points will eventually move apart, and can be local unstable. If the track also exists a stabilizing factor in the overall, it occur to a chaotic attractor by repeatedly folded [5]。
350
0 1
1
ln( , )
n λ λ
=
(2)
According the definition of Lyapunov exponent, we can know
1
0
1
0 0
1
1
0 1 0
0 1
1
lim ln
1
lim ln
x 1
lim ln
1
ln( , )
i
n
n
i x x
n
n i
n
n
i n
dF
n dX
x
n x
x
n x x
n
λ
λ λ −
→∞ =
=
→∞ =
→∞ =
− =
∆ =
∆
∆ ∆
= …
∆ ∆
=
∑
∑
∑
(3)
So Lyapunov exponent
1 1 2 2
1 1
ln , ln
LE LE
n λ n λ
= =
while λ is the eigenvalue of corresponding two-dimensional mapping of Jacobin matrix
1 1
2 2
n n
n n
f f
x y
J
f f
x y
∂ ∂ ∂ ∂ =
∂ ∂ ∂ ∂
2.2 Henon map
H
enon map is applied to energy forecasting, chemical production, and as well as have a good handle turbulence phenomena. For two-dimensional Henon map, the iterative equation is as follows:* ( 1) 2 n n−
(4)
a and b are parameters. It will happen to repeatedly trace and chaotic with different parameters。
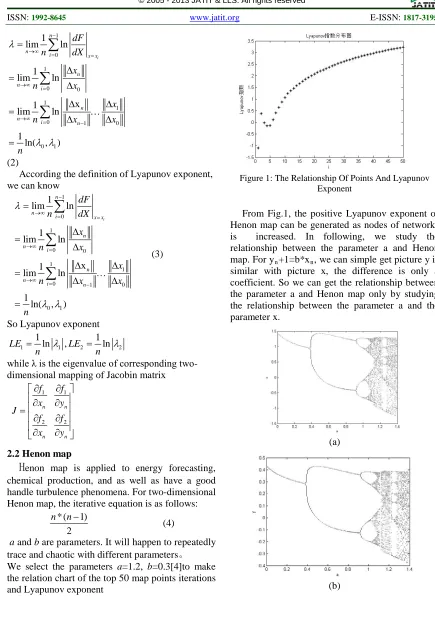
[image:2.612.83.518.64.682.2]We select the parameters a=1.2, b=0.3[4]to make the relation chart of the top 50 map points iterations and Lyapunov exponent
Figure 1: The Relationship Of Points And Lyapunov Exponent
From Fig.1, the positive Lyapunov exponent of Henon map can be generated as nodes of networks is increased. In following, we study the relationship between the parameter a and Henon map. For yn+1=b*xn, we can simple get picture y is similar with picture x, the difference is only a coefficient. So we can get the relationship between the parameter a and Henon map only by studying the relationship between the parameter a and the parameter x.
(a)
ISSN: 1992-8645 www.jatit.org E-ISSN: 1817-3195
351 (c)
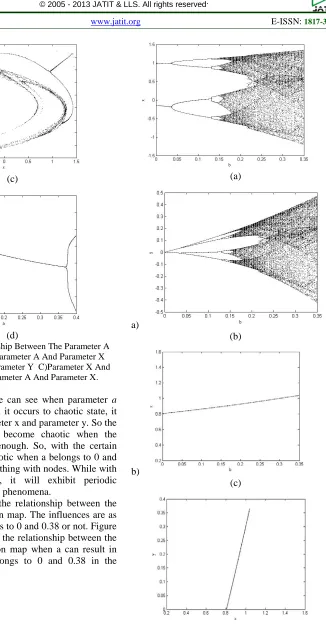
[image:3.612.182.508.60.686.2](d)
Figure 2: The Relationship Between The Parameter A And Henon Map. A)Parameter A And Parameter X B)Parameter A And Parameter Y C)Parameter X And
Parameter Y D) Parameter A And Parameter X.
From Figure 2, we can see when parameter a
belongs to 0 and 0.38, it occurs to chaotic state, it influences both parameter x and parameter y. So the system is certain to become chaotic when the parameter a is large enough. So, with the certain nodes, it won’t be chaotic when a belongs to 0 and 0.38, and it change nothing with nodes. While with the increase of a, it will exhibit periodic bifurcation and chaotic phenomena.
Second, we study the relationship between the parameter b and Henon map. The influences are as follows when a belongs to 0 and 0.38 or not. Figure 2 (a)and (b) stands for the relationship between the parameter b and Henon map when a can result in chaos .whereas a belongs to 0 and 0.38 in the Figure 2(c)and (d).
(a)
a)
(b)
b)
(c)
(d)
Figure 3: The Relationship Between The Parameter B And Henon Map(A) Parameter B And X B) Parameter B
352
b itself strength the influence of parameter a.
3. THE ITERATIVE BEHAVIOR OF THE
COUPLED NETWORK AND THE APPEARANCE OF CHAOS
3.1 The Coupled Network
It is clear that if A=(aij)N×N, RN×N stands for the coupled configuration network ,if there exists a relationship between i and j when i≠j ,we define aij=aji=1,otherwise,aij=aji=0,then we can know the take the diagonal elements
1, 1,
, 1, 2...
N N
ij ij ji
j j i j j i
a a a i N
= ≠ = ≠
= −
∑
= −∑
= (5)(1)The global network
Every two nodes relate with each other in the global coupled network, moreover, there are n*(n-1)/2edges in total. According to the reference we can get its coupled matrix A:
1 1 1 1
1 1 1 1
1
1 1 1 1
1 1 1 1
N N A N − − − − = − − (6)
(2) The star-network
There is only one central node in star-network with N nodes. Moreover, each node only associated with central node .The corresponding coupled matrix A is:
1 1 1
1 1 0
0
1 0 1
N A − − − = − (7)
(3)The nearest-neighbor network
In the nearest neighbor coupled network N nodes, each node only associate with the nearest node. Its coupled matrix A is:
2 1 0 1
1 2 1 0
0 1 2 1
1 0 1 2
A − − = − − (8)
If the system is a discrete process, the iteration equation of the x node is xi(k)=f(xi(k)), and then the x+1 node's corresponding iterative equation is
1
( 1) ( ( )) ( ( )), 1, 2...
N
i i ij j
j
x k f x k c a f x k i N
=
+ = −
∑
=(9)
If the system is a continuous process, the first x node’s corresponding iteration equation is xi(k)=f(xi(k)), then x+1 node's corresponding iterative equation is
1
( ) ( ( )) ( ), 1, 2...
N
i i ij j
j
x t f x t c a x t i N
=
= −
∑
= (10)We also assume that the node with a parameter is not chaotic before connecting with others in the initial system state. But with the increase number of the nodes and with the different iterative frequency, some certain coupling network will come to chaos phenomena.
For the globally coupled network and the star-network, when the nodes increase to a some value, the corresponding global coupled network and the star-network structure can transform form non-chaotic state to the non-chaotic state with limited superposition .For the nearest-neighbor network, as long as the network is large enough, there wouldn't occur to chaotic state.
ISSN: 1992-8645 www.jatit.org E-ISSN: 1817-3195
353 a)
b)
c)
Fig.3 Three Typical Henon Maps In The Coupled Networks When Parameter A<0.38(With 100 Points) A)The Globally Coupled Network B)A Star-Network C)A Nearest-Neighbor Coupled Network
From the above figure, the chaos is not generated in three systems. We verify that Henon map can turn to be chaotic when the initial state is on the contrary, and parameter a is too smaller.
In general studies, we usually adopt parameter a=1.2,b=0.3 to the Henon map. At the moment, the initial state has become a chaotic state following iteration. In this regard, it is necessary to study the different coupled networks under different conditions
a)
b)
c)
Fig.4 Three Typical Henon Maps In The Coupled Networks When A>0.38(With 100 Points) A) The Globally Coupled Network B)A Star-Network C) A Nearest-Neighbor Coupled Network
From Fig.4, the chaos are generated in the three types of systems when a=1.2. From the simulation result, we can see the chaos of the system is influenced by parameter a, and there is nothing about parameter b.
354 (b)
Figure 5: The Relationship Between The Parameter A And The Parameter X. A)Star Network (15 Iteration) B)
A Nearest Neighbor Coupled Network(100iteration)
From Figure 5, although both of the system become more chaotic when parameter a is very large, the difference is that a nearest-neighbor coupled network will be more easily to adapt.
Thus, we can draw that when the parameter a is lightly larger, the node of Henon map will affect each other in the overlay process, corresponding global coupled network and star network structure can be superimposed after finite increase its chaotic, and the effect is distinct; when the number of nodes is certain, the global coupled network and star network is close to infinite ;while, as long as the network is large enough, the nature of the nearest neighbor coupling network system is not be changed.
4. CONCLUSION
With a certain number of nodes, from non-chaotic to a non-chaotic state occurs in the case of different coupling network of Henon map for the same initial point is discussed in this paper. And then in certain different coupled network states under different conditions is analyzed. The situation from non-chaotic to chaotic is verified and the network with more nodes can be more practical used. Furthermore, the relationship between different kinds of networks and different parameters has been studied. Drawn form the above, as long as the nearest neighbor coupled network is large enough, the chaos will be not occurred if the initial state is not a chaotic system, while if the initial state is a chaotic system, the chaotic state will not be changed. In the same case of other conditions we can better and more rational use the large nearest neighbor coupled network to make it to a higher level of application efficiency.
[1] Newman M E J. “The Structure and function of complex networks”. SIAM Review, Vol. 45, 2003, 167-256.
[2] Moreno Y, Pastorgas R. Vespignani A. “Epidemic outbreaks in complex heterogeneous networks”, Eur Phys J B, Vol.26, 2002, pp.521-529.
[3] Heagy J F, Carroll T L, Pecora L M. “Synchronous chaos in coupled oscillator systems”, Phys. Rev. Lett, Vol.80, 1998, pp.2109.
[4] Ernesto P. Borges, Ugur Tirnakli. “Two-dimensional dissipative maps at chaos threshold: Sensitivity to initial conditions and relaxation dynamics”. Physica A, Vol.340, 2004, pp.227-233.
[5] Neda Z, Ravasz E, Brechet Y. “The sound of many hands clapping”, Nature, Vol. 403, 2000, pp.849-850.
[5] Xiang Li, Guanrong Chen, King-Tim Ko, “Transition to chaos in complex dynamical networks”. Physica A, Vol.338 , 2004, pp.367-378.
[6] Haifeng Zhang, Ruixin Wu, Xinchu Fu, “The emergence of chaos in complex dynamical networks”, Chaos Solitons &Fractals. Vol.28, 2006, pp.472-479.
[7] Wujie Yuan, Xiaoshu Luo, Pinqun Jiang, Binghong Wang. Jinqing Fang, “Transition to chaos in small-world dynamical network”,
Chaos Solitons &Fractals, Vol.37, 2008,