http://dx.doi.org/10.4236/psych.2014.510139
How to cite this paper: Karatza,E., Kourou, D., Galanakis, M., Varvogli, L., & Darviri, C. (2014). Validation of the Greek Ver-sion of Perceived Stress Questionnaire: Psychometric Properties and Factor Structure in a Population-Based Survey. Psy-chology, 5, 1268-1284. http://dx.doi.org/10.4236/psych.2014.510139
Validation of the Greek Version of Perceived
Stress Questionnaire: Psychometric
Properties and Factor Structure in a
Population-Based Survey
Eva Karatza1*, Dimitra Kourou1*#, Michael Galanakis2, Liza Varvogli1, Christina Darviri1 1Postgraduate Course Stress Management and Health Promotion, School of Medicine, University of Athens,
Athens, Greece
2Department of Psychology, Panteion University of Social and Political Sciences, Athens, Greece
Email: #[email protected]
Received 12May 2014; revised 8June 2014; accepted 1July 2014 Copyright © 2014 by authors and Scientific Research Publishing Inc.
This work is licensed under the Creative Commons Attribution International License (CC BY).
http://creativecommons.org/licenses/by/4.0/
Abstract
Perceived Stress Scale (PSQ) adaptation is a measuring tool of perceived stress and evaluation of its psychometric properties, on a population-based survey (Greece). Sample N = 1318 of people has anonymously completed the PSQ, comparing it to the Perceived Stress Scale (PSS) and Depres-sive, Anxiety and Stress Scale (DASS-21). The factor analysis, has shown that the PSQ includes five main factors (Overload, Worries, Joy, Tension/Fatigue, Harassment), which explain the 54.28% of the phenomenon variance. The Cronbach alpha index was 0.9 approaching the respective reliabil-ity factor at the original validation (alpha > 0.9). The test-retest reliabilreliabil-ity was highly statistically significant with an alpha = +0.86, close to the results of the original validation (r = 0.82). The crite-rion validity has shown high correlation with the PSS (r = 0.737), plus the fact that the results of the correlation with the DSS-21 (r = 0.597) were satisfactory. The satisfactory results, as it con-cerns the psychometric properties of the PSQ, make the questionnaire an appropriate measuring tool of the perceived stress of the Greek population.
Keywords
Perceived Stress Questionnaire, Validation, Psychometric Properties, Population-Based Survey
*
These authors contributed equally and shared first authorship. #
1. Introduction
Stress is a notion which has raised the interest of the scientific community over the last years, either because of its definition and its forms of measurement or of its impact on the harmonious function of each organism. More specifically, stress is defined as a state in which homeostasis is actually threatened or perceived to be so (Chrou- sos, 2009).
There are three basic approaches of stress. Firstly, the environmental approach is based on the external condi-tions (stressors) and contains the impact of stressful events. The psychological approach focuses on the perceiv- ed stress and its negative emotions. Finally, the biological approach is related to the measurement of biological indicators, such as cortisol and amylase of saliva (Fliege, Arck, Walter, Kocalevent, Weber, & Klapp, 2007). Since all the approaches above present some weaknesses, as far as the measurement of stress is concerned, their combination seems to be contributing to a more complete approach of its measurement and definition.
Furthermore, some other basic divisions concerning the criteria of measuring stress are defined in the follow-ing basic structures: 1) in external stressors in view of “major life events”, 2) in everyday events which cause stress (cumulative minor stresses or hassles), and 3) in the way of perception and coping of the external condi-tions by the person himself (coping) (Sanz-Carillo, Garcia-Campayo, Rubio, Santed, & Montoro, 2002). By ex-tension, the measurement tools of stress are focused on these structures, raising many discussions in the scien-tific society based on if we have to limit our measurement in external stressors (major life events or stressors) or on the perception of a person of a stressful event and his emotional reaction to it (Kanner, Coyen, Schaefer, & Lazarus, 1981).
By relying on the researches conducted for this subject, a significant correlation seems to exist between the stressful events and the emergence of health problems. This correlation is even stronger when these events con-cern chronic and major changes in a person’s life. For this reason, the scientific interest is turning to the subjec-tive perception and coping of the conditions by the actual person (Fliege, et al., 2005; Fliege, Rose, Arck, Levenstein, & Klapp, 2001).
A basic issue in the research of psychosomatic disorders is the impact of the stress on the physical and psy-chological health. A stressful factor can affect the immune system either by the emergence of any kind of health problem or by its evolution. By observing the interactions between the neural, endocrinologic and immune sys-tem, their common denominator seems to be the perceived stress (Lorentz, 2006).
During the last years, research has shown an important correlation between stress and depression. It has been observed that both acute and chronic stress is connected to the emergence, evolution or possible recrudescence of depression (Hammen, 2005; Kessler, 1997; Liu & Alloy, 2010). The question is why each stressful event can be experienced differently by each person? So, the interest of the research is detected in the factors that affect the way of coping situations. Individual factors, as the personality, beliefs, experiences, and also genetic factors seem to have an impact on the cognitional process of stressful events, altering its response to the person (Ham- men, 2006). Based on the bibliography, depression is more often observed in women than that in men. Also, the percentages of its emergence in teenagers are high which renders the woman teenagers considerably vulnerable, in an age when the person is under the formation of his personality (Hammen, 2003).
The Perceived Stress Questionnaire (PSQ) of Levenstein et al. is orientated towards this direction. In fact, this measurement is based on the subjective perception of things and the emotional reaction to them (Levenstein, Pantera, Varvo, Scribano, Berto, Luzi, & Andreoli, 1993). For this reason, the format of the items is also based on this subjective perception, including many item wordings as following: “You feel...” Moreover, this ques-tionnaire can be widely used without the restrictions based on the age, gender or profession of the participants. This way, it becomes more manageable to the general population and the content of the items can be answered for a considerable total of cases as well (Fliege et al., 2005).
Some other representative questionnaires of perceived stress are the Stress Appraisal Measure (SAM), the Impact of Event Scale (IES) and the Perceived Stress Scale (PSS), which are the most known and widespread questionnaires on this subject (Peackock & Wong, 1990; Horowitz, Wilner, & Alvarez, 1979; Cohen, Kamarck, & Mermelstein, 1983).
Additionally, in the current research the validation of the Perceived Stress Questionnaire (PSQ) of Levenstein et al. in Greece has been attempted. While the validation of a questionnaire for the perceived stress is very recent, PSQ is recommended as very useful and complete since it aims to gather elements about the subjective and emotional coping of each person of a stressful event and since it includes realistic external stressors. Besides, by using this questionnaire we tried to offer a more efficient approach in measuring and associating stress with the health problems. It finally offers the examination of different facets of perceived stress (Fliege et al., 2005; Le- venstein et al., 1993). PSQ, as a tool of measurement of perceived stress, has been applied to a wide range of re-searches on physical and psychological disorders as well as on healthy population (Kocalevent, Levenstein, Fliege, Schmid, Hinz, Brahler, & Klapp, 2007; Bergdahl & Bergdhal, 2002; Levenstein, Pantera, Varvo, Scriba- no, Andreoli, Luzi, Arca, Berto, Milite, & Marcheggiano, 2000; Wikgren, Maripuu, Karlsson, Nordfall, Bergdahl, Hultdin, Del-Favero, Roos, Nilsson, Adolfsson, & Norrback, 2012; Keefer, Kielbes, Kwiatek, Palsson, Taft, Martionovich, & Barrett, 2012; Krohn, Listing, Tjahjono, Reisshauer, Peters, Klapp, & Rauchfuss, 2011; Le- venstein, Pantera, Varvo, Scribano, Andreoli, Luzi, Arca, & Berto, 1994; Rosenberger, Elsenbruch, Scolle, Greiff, Schedlowski, Forsting, & Gizewski, 2009).
PSQ is consisted of 30 closed questions and it was published in 1993. It is already validated in Italian, English, Spanish and German (Kanner et al., 1981; Fliege et al., 2001; Levenstein et al., 1993). The initial validation of Levenstein et al. with the scale of 30 rates was conducted to 230 people of clinical population (meaning people with chronic disease and health professionals). As a result from this validation, seven factors were obtained: harassment, irritability, lack of joy, fatigue, worries, tension and overload, respectively (Levenstein et al., 1993). In the current research, the aim included the validation of PSQ in Greek, destined to adult people of the gen-eral population, from all the socio-economical classes. The reason why people from the gengen-eral population were chosen was the fact that we wanted to examine if PSQ could measure the levels of stress to healthy people, where the detection and the measurement of stress are a demanding procedure. At the same time, the examina-tion of a possible correlaexamina-tion between stress and depression was aimed, as obvious by the bibliography.
2. Methods
This research is an attempt to adjust the Perceived Stress Questionnaire (PSQ) from English to Greek language. It has been decided to use, in general population, the version of the questionnaire which concerns last month’s events (recent PSQ). In the original article Levenstein et al. have focused particularly on the stress of the clinical sample. As a result, stress related to the stressful situation of the health problems and symptoms were detected and measured. However, stress related to more recent events was not detected (Liu & Alloy, 2010). Moreover, the researchers mentioned that if they had not used Life Events Scale questionnaire and Daily Hassles Scale questionnaire, the correlation between the current/recent perceived stress would probably not have been found (Levenstein et al., 1993; Kocalevent et al., 2007). Additionally, its correlation with another tool measuring stress, the Cohen Perceived Stress Scale and with the scales of measuring depression as well seem to be significant. (Fliege et al., 2005; Sanz-Carrillo et al., 2002; Kocalevent et al., 2007).
The bibliography indicates that the response to a stressful factor appears to be a “personal case” which de-pends on the nature of the stressor, the assessment of the situation and the existence or not of the necessary sources (Lazarus & Folkman, 1984; Chrousos, 1998; Lazarus, 1993). All the above have risen the question of whether this questionnaire can reliably measure the perceived stress. In conclusion, goal of the statistical analy-sis is to query if the factors tested corroborate the proposed model in the general Greek population.
2.1. Participants
“free-lancer”, 11.9% (N = 117) “student”, 7.9% (N = 104) “unemployed”, 4.4% (N = 58) “retired”, 3 % (N = 39) “housekeeping” and finally 3.4% (N = 45) states “something else”. Finally, as for the residency, 55.4% (N = 730) lives in Attiki and the rest 44.6% (N = 446) lives in the province.
2.2. Tools
The participants were provided with the Perceived Stress Questionnaire, the Greek adjusted questionnaires for depression and perceived stress measurement―DASS21 and PSS respectively―as well as a form concerning the demographic data of the participants.
Demographic data: In this sheet the participants filled in data concerning gender, age, marital status, educa-tional level, occupation and residency.
Perceived Stress Questionnaire (Levenstein, 1993): It is a tool that calculates the perceived stress in a specific situation and the response to that in regard to the cognitive (experience, resources etc.) and emotional level (Liu & Alloy, 2010: Appendix I). The final validation was addressed to 230 individuals of English and Italian origin, which were selected among healthy but also clinical population. It consists of 30 elements which are based on 7 factors: harassment, irritability, lack of joy, fatigue, worries and tension. The participants answer on a Likert 4- point scale (1: almost never, 2: sometimes, 3: often, 4: usually). The form of the questionnaire is provided in two separate types; the general one which is about the events of the last two years (General Version) and the recent one which asks about the last month. The sum of the test answers is added in a total score (raw-score = 30 - 120) which represents the stress-degree of each participant.
The PSQ has been translated in German (Fliege et al., 2001) and Spanish (Sanz-Carrillo et al., 2001). It must be mentioned that in the German adjustment the model of the questionnaire is loaded in only 4 factors ( worries, tension, joy and demands) and is shorter, consisting of only 20 elements.
In this particular research a Greek version of the PSQ has been used. The first part of the research was the translation from English to Greek, following the suggestions of Brislin (Brislin, 1970). The method used was that of reverse translation. In the beginning two bilingual translators, who were not aware of what the test was to examine, translated from English to Greek, creating two new different Greek versions of the test. Subsequently the aforementioned translators met each, compared the two versions, discussed on the controversial points and concluded in a final new version of the questionnaire. This final version was translated from Greek back to Eng-lish by a third bilingual person (Appendix II).
DASS21: It is a 21 items tool, being a short version of the Depression Anxiety Stress Scale which consists of 42 elements (Lovibond & Lovibond, 1995a). The final version of the 21 items regards the ones that load more the factors being tested, whereas the multivariate analysis showed satisfactory convergent and deviant validity and high internal coherence for the clinical and the general population as well.
DASS21 is a self-reference questionnaire which measures the negative effect of the “distress” based on three main symptoms: depression, anxiety (e.g. psychological stimulation) and stress (e.g. cognitive reconstruction). The aforementioned symptoms are differentiated simultaneously with the final score. The participants reply, bas- ed on their experience from the described situations during last week, in a 4-point scale (0: not valid for me, 1: valid at a certain degree or a specific time-period, 2: valid for me at high degree or for a long time-period, 3: es-pecially valid for me or most of the times). In our research the Greek version of the questionnaire has been used, which presents high correlation with the initial test (Lyrakos, Arvaniti, Smyrnioti, & Kostopanagiotou, 2011).
Perceived Stress Scale (Cohen): It is a tool of measuring perceived stress; the participants reply on how they experienced (frequency of reactions and thoughts) some situations during last month (Cohen et al., 1983). It consists of 14 elements in a Likert 5-point scale (1: never, 2: almost never, 3: sometimes, 4: frequently, 5: very frequently). There are also shorter versions of the questionnaire with 10 and 4 elements. The questionnaire has been loaded in other languages, such as Spanish, Turkish, Swedish, Chinese, Japanese and Arabic. In our re-search the Greek version has been used (Andreou et al., 2011).
2.3. Procedure
The entire sample (N = 1318) filled the PSQ in. From the total of the participants N = 453 were provided at the same time with the PSS in order to evaluate the criterion validity (Concurrent Validity). In order to evaluate the construct validity (Convergent Validity) of the questionnaire, we evaluated the levels of depression in a part of the sample, N = 451 by giving the DASS-21. We were expecting that the participants with high levels of de-pression would present stress of medium-high level. Moreover, the PSQ was provided, for a second time in one- month interval (test-retest), to a part of the participants (N = 212) in order to evaluate the stability in time. Due to the anonymity of the questionnaires, we created passwords for the individuals who were retested so that the proportionate correlations could be made. The one month interval was considered proper so that the participants would have forgot the questions but also in order to avoid vast changes in their lives.
3. Results
The statistical programs SPSS (21.0) and AMOS (21.0) were used for the statistical analysis of the data.
[image:5.595.92.539.361.720.2]As far as the basic variables of our survey are concerned the averages and standard deviations are depicted in
Table 1. In particular the average of our sample in PSQ was 73.29 and the standard deviation 15, the average in
DASS was 36.85 and the standard deviation 11.04, while the average in PSS was 41.05 and the standard devia-tion 7.23.
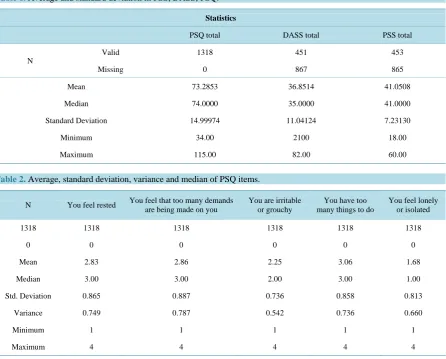
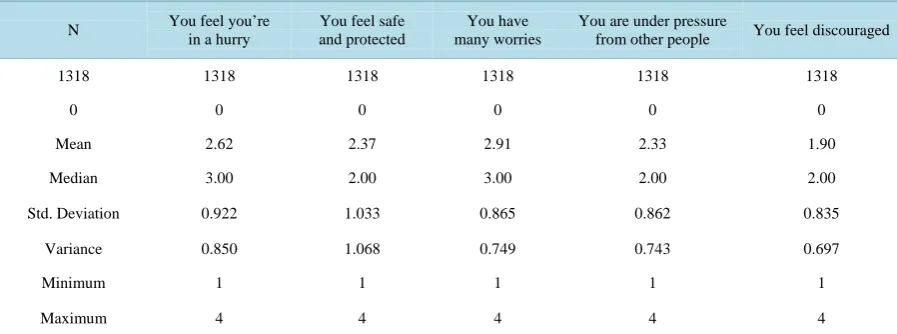
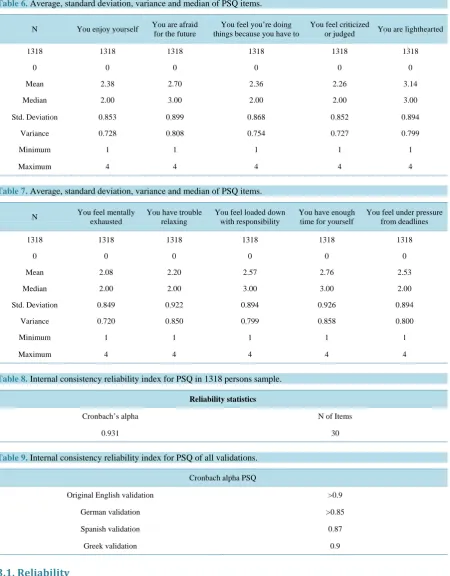
In the first stage we performed item analysis, in order to explore the variance per item and find out whether all possible answers are systematically chosen by the participants. The results have shown that all items had satis-factory variance (0.6 up to 0.9), while all possible answers were chosen for each item (Tables 2-7).
As far as the scale reliability is concerned, we used the Cronbach alpha criterion, which is an internal consis-tency index, in parallel with the test-retest method at the same sample with one-month temporal distance.
Table 1. Average and standard deviation in PSS, DASS, PSQ.
Statistics
PSQ total DASS total PSS total
N
Valid 1318 451 453
Missing 0 867 865
Mean 73.2853 36.8514 41.0508
Median 74.0000 35.0000 41.0000
Standard Deviation 14.99974 11.04124 7.23130
Minimum 34.00 2100 18.00
Maximum 115.00 82.00 60.00
Table 2. Average, standard deviation, variance and median of PSQ items.
N You feel rested You feel that too many demands are being made on you
You are irritable or grouchy
You have too many things to do
You feel lonely or isolated
1318 1318 1318 1318 1318 1318
0 0 0 0 0 0
Mean 2.83 2.86 2.25 3.06 1.68
Median 3.00 3.00 2.00 3.00 1.00
Std. Deviation 0.865 0.887 0.736 0.858 0.813
Variance 0.749 0.787 0.542 0.736 0.660
Minimum 1 1 1 1 1
Table 3. Average, standard deviation, variance and median of PSQ items.
N You find yourself in situations of conflict
You feel you’re doing
things you really like You feel tired
You fear you may not
manage to attain your goals You feel calm
1318 1318 1318 1318 1318 1318
0 0 0 0 0 0
Mean 1.98 2.23 2.57 2.15 2.49
Median 2.00 2.00 2.00 2.00 3.00
Std. Deviation 0.808 0.839 0.841 0.831 0.954
Variance 0.653 0.705 0.708 0.690 0.911
Minimum 1 1 1 1 1
Maximum 4 4 4 4 4
Table 4. Average, standard deviation, variance and median of PSQ items.
N You have too many
decisions to make You feel frustrated You are full of energy You feel tense
Your problems seem to be piling up
1318 1318 1318 1318 1318 1318
0 0 0 0 0 0
Mean 2.75 2.04 2.48 2.51 2.28
Median 3.00 2.00 2.00 2.00 2.00
Std. Deviation 0.838 0.825 0.880 0.786 0.854
Variance 0.702 0.681 0.774 0.618 0.729
Minimum 1 1 1 1 1
[image:6.595.88.537.493.660.2]Maximum 4 4 4 4 4
Table 5. Average, standard deviation, variance and median of PSQ items.
N You feel you’re in a hurry
You feel safe and protected
You have many worries
You are under pressure
from other people You feel discouraged
1318 1318 1318 1318 1318 1318
0 0 0 0 0 0
Mean 2.62 2.37 2.91 2.33 1.90
Median 3.00 2.00 3.00 2.00 2.00
Std. Deviation 0.922 1.033 0.865 0.862 0.835
Variance 0.850 1.068 0.749 0.743 0.697
Minimum 1 1 1 1 1
Maximum 4 4 4 4 4
The coefficient cronbach alpha was 0.9 (Table 8) in our survey, similar to the respective one in the original validation (alpha > 0.9). Similar results of cronbach alpha index come out in the rest validations of the tool (Ta-
ble 9). The item deletion analysis, performed in order to raise the internal consistency index, led to the
Table 6. Average, standard deviation, variance and median of PSQ items.
N You enjoy yourself You are afraid for the future
You feel you’re doing things because you have to
You feel criticized
or judged You are lighthearted
1318 1318 1318 1318 1318 1318
0 0 0 0 0 0
Mean 2.38 2.70 2.36 2.26 3.14
Median 2.00 3.00 2.00 2.00 3.00
Std. Deviation 0.853 0.899 0.868 0.852 0.894
Variance 0.728 0.808 0.754 0.727 0.799
Minimum 1 1 1 1 1
Maximum 4 4 4 4 4
Table 7. Average, standard deviation, variance and median of PSQ items.
N You feel mentally exhausted
You have trouble relaxing
You feel loaded down with responsibility
You have enough time for yourself
You feel under pressure from deadlines
1318 1318 1318 1318 1318 1318
0 0 0 0 0 0
Mean 2.08 2.20 2.57 2.76 2.53
Median 2.00 2.00 3.00 3.00 2.00
Std. Deviation 0.849 0.922 0.894 0.926 0.894
Variance 0.720 0.850 0.799 0.858 0.800
Minimum 1 1 1 1 1
Maximum 4 4 4 4 4
Table 8. Internal consistency reliability index for PSQ in 1318 persons sample.
Reliability statistics
Cronbach’s alpha N of Items
0.931 30
Table 9. Internal consistency reliability index for PSQ of all validations.
Cronbach alpha PSQ
Original English validation >0.9
German validation >0.85
Spanish validation 0.87
Greek validation 0.9
3.1. Reliability
Table 10. Analysis of items exception so that the internal consistency index is raised in PSQ.
PSQ items Scale mean if
item deleted
Scale variance if item deleted
Corrected item-total correlation
Cronbach’s alpha if item deleted
You feel rested 70.44 210.519 0.549 0.928
You feel that too many demands are being made on you 71.02 214.867 0.378 0.930
You are irritable or grouchy 70.13 208.964 0.591 0.928
You have too many things to do 71.20 209.865 0.588 0.928
You feel lonely or isolated 71.08 207.957 0.610 0.927
You find yourself in situations of conflict 70.70 208.040 0.628 0.927
You feel you’re doing things you really like 70.52 210.145 0.522 0.929
You feel tired 70.42 209.941 0.557 0.928
You fear you may not manage to attain your goals 71.02 213.188 0.526 0.929
You feel calm 70.22 213.653 0.425 0.930
You have too many decisions to make 71.59 214.133 0.431 0.930
You feel frustrated 71.30 212.668 0.497 0.929
You are full of energy 71.04 212.928 0.465 0.929
You feel tense 70.70 209.577 0.605 0.928
Your problems seem to be piling up 71.12 213.524 0.446 0.929
You feel you’re in a hurry 70.78 207.040 0.623 0.927
You feel safe and protected 70.53 213.389 0.448 0.929
You have many worries 71.24 210.183 0.592 0.928
You are under pressure from other people 70.80 212.923 0.442 0.930
You feel discouraged 70.76 211.609 0.561 0.928
You enjoy yourself 70.99 208.397 0.645 0.927
You are afraid for the future 70.66 208.132 0.604 0.928
You feel you’re doing things because you have to,
not because you want to 70.90 209.381 0.488 0.929
You feel criticized or judged 70.37 209.682 0.583 0.928
You are lighthearted 70.95 209.564 0.590 0.928
You feel mentally exhausted 71.37 211.340 0.536 0.928
You have trouble relaxing 70.89 210.384 0.562 0.928
You feel loaded down with responsibility 70.58 211.232 0.497 0.929
You have enough time for yourself 70.75 209.998 0.550 0.928
You feel under pressure from deadlines 70.91 210.497 0.547 0.928
3.2. Validity
A statistically significant positive correlation of moderate strength between PSQ and DASS was expected ac-cording to the bibliography for the relationship between depression and stress. A statistically significant positive correlation between PSQ and PSS was also expected. Despite the fact that both tools measure perceived stress, we predict no high positive correlation between them, because of the fact that PSQ also measures expanded en-vironmental factors.
According to the results in Table 12, PSQ has satisfactory construct validity using as a criterion the depres-sion scale DASS21 (r = 0.597, p < 0.01) and the stress scale PSS (r = 0.737, p < 0.01) as well.
Moreover as far as content validity is concerned, we performed factor analysis to verify the original one. We measured the inter―correlations between the items, in order to determine if the specifications for performing factor analysis are satisfying. According to the methodological rule for performing factor analysis, the correla-tions between the items must in principle be positive and weak to moderate (0.2 - 0.5). Furthermore, the KMO and Bartlett’s Test of Sphericity were checked as to data distribution and its results showed that we can move forward with analysis (Table 13).
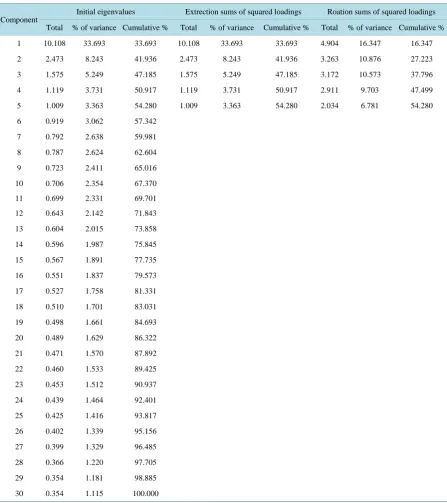
We performed exploratory factor analysis using the principal component method and after rotated component matrix the analysis results are depicted in Table 14, Table 15 and in Figure 1.
Based on the factor analysis results PSQ seems to consist of five principal factors which explain the 54.28% of phenomenon variance. These factors are: Overload, Worries, Joy, Tension-Fatigue, and Harassment. More particularly, in the first factor (Overload), items 2, 4, 11, 16, 18, 25, 28, 30 are loaded. In the second factor (Worries), items 9, 12, 15, 20, 22, 23, in the third factor (Joy) items 1, 7, 13, 17, 21, 29, in the fourth factor (Tension-Fatigue) items 3, 5, 8, 10, 14, 26, 27 are loaded and lastly in fifth factor the items 6, 19, 24.
Table 11. Reliability analysis results of the test-retest method for PSQ.
Correlations
PSQ total_a PSQ total_b
PSQ total_a
Pearson correlation 1 0.867**
Sig. (2-tailed) 0.000
N 1318 212
PSQ total_b
Pearson correlation 0.867** 1
Sig. (2-tailed) 0.000
N 212 212
Note: **Correlation is significant at the 0.01 level (2-tailed).
Table 12. Criterion validity analysis for PSQ using as a criterion the depression scale DASS 21 and the stress scale PSS.
Correlations
PSQ total DASS total PSS total
PSQ total
Pearson correlation 1 0.597** 0.737**
Sig. (2-tailed) 0.000 0.000
N 1318 451 453
DASS total
Pearson correlation 0.597** 1 .b
Sig. (2-tailed) 0.000 .
N 451 451 0
PSS total
Pearson correlation 0.737** 1
Sig. (2-tailed) 0.000 .
N 453 0 453
Table 13. Preliminary analysis based on KMO and Bartlett’s Test of Sphericity for performing factor analysis.
KMO and Bartlett’s Test
Kaiser-Meyer-Olkin measure of sampling adequacy 0.954
Bartlett’s Test of Sphericity
Approx. Chi-Square 15809.063
Df 435
Sig. 0.000
Table 14. Factor analysis for the total of PSQ items with principal component method and after rotated component matrix.
Component
Initial eigenvalues Extrection sums of squared loadings Roation sums of squared loadings
Total % of variance Cumulative % Total % of variance Cumulative % Total % of variance Cumulative %
1 10.108 33.693 33.693 10.108 33.693 33.693 4.904 16.347 16.347
2 2.473 8.243 41.936 2.473 8.243 41.936 3.263 10.876 27.223
3 1.575 5.249 47.185 1.575 5.249 47.185 3.172 10.573 37.796
4 1.119 3.731 50.917 1.119 3.731 50.917 2.911 9.703 47.499
5 1.009 3.363 54.280 1.009 3.363 54.280 2.034 6.781 54.280
6 0.919 3.062 57.342
7 0.792 2.638 59.981
8 0.787 2.624 62.604
9 0.723 2.411 65.016
10 0.706 2.354 67.370
11 0.699 2.331 69.701
12 0.643 2.142 71.843
13 0.604 2.015 73.858
14 0.596 1.987 75.845
15 0.567 1.891 77.735
16 0.551 1.837 79.573
17 0.527 1.758 81.331
18 0.510 1.701 83.031
19 0.498 1.661 84.693
20 0.489 1.629 86.322
21 0.471 1.570 87.892
22 0.460 1.533 89.425
23 0.453 1.512 90.937
24 0.439 1.464 92.401
25 0.425 1.416 93.817
26 0.402 1.339 95.156
27 0.399 1.329 96.485
28 0.366 1.220 97.705
29 0.354 1.181 98.885
30 0.354 1.115 100.000
[image:10.595.90.538.204.708.2]Table 15. PSQ items loads per factor.
PSQ items
Factors
Overload Worries Joy Tension/Fatigue Harassment
You feel rested 0.493
You feel that too many demands are being made on you 0.711
You are irritable or grouchy 0.692
You have too many things to do 0.768
You feel lonely or isolated 0.393
You find yourself in situations of conflict 0.613
You feel you’re doing things you really like 0.684
You feel tired 0.485
You fear you may not manage to attain your goals 0.722
You feel calm 0.528
You have too many decisions to make 0.645
You feel frustrated 0.607
You are full of energy 0.571
You feel tense 0.600
Your problems seem to be piling up 0.473
You feel you’re in a hurry 0.609
You feel safe and protected 0.496
You have many worries 0.735
You are under pressure from other people 0.532
You feel discouraged 0.637
You enjoy yourself 0.703
You are afraid for the future 0.712
You feel you’re doing things because you have to,
not because you want to 0.361
You feel criticized or judged 0.707
You are lighthearted 0.456
You feel mentally exhausted 0.517
You have trouble relaxing 0.448
You feel loaded down with responsibility 0.675
You have enough time for yourself 0.594
You feel under pressure from deadlines 0.571
Note: Extraction Method: Principal Component Analysis. Rotation Method: Varimax with Kaiser Normalizationa. aRotation converged in 6 iterations.
This solution differs from 7 factors solution of the original validation in which the following factors were found: Worries, Tension, Lack of joy, Overload, Harassment, Irritability, Fatigue.
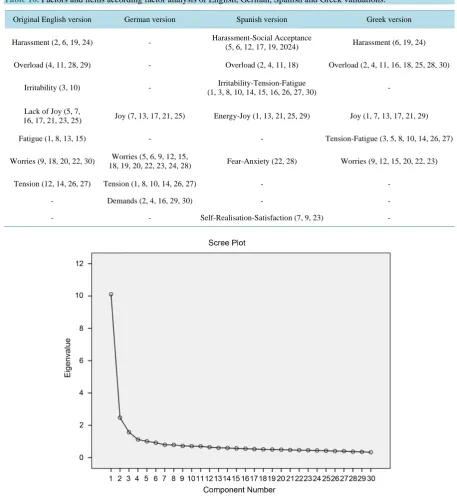
Table 16. Factors and items according factor analysis of English, German, Spanish and Greek validations.
Original English version German version Spanish version Greek version
Harassment (2, 6, 19, 24) - Harassment-Social Acceptance
(5, 6, 12, 17, 19, 2024) Harassment (6, 19, 24)
Overload (4, 11, 28, 29) - Overload (2, 4, 11, 18) Overload (2, 4, 11, 16, 18, 25, 28, 30)
Irritability (3, 10) - Irritability-Tension-Fatigue
(1, 3, 8, 10, 14, 15, 16, 26, 27, 30) -
Lack of Joy (5, 7,
16, 17, 21, 23, 25) Joy (7, 13, 17, 21, 25) Energy-Joy (1, 13, 21, 25, 29) Joy (1, 7, 13, 17, 21, 29)
Fatigue (1, 8, 13, 15) - - Tension-Fatigue (3, 5, 8, 10, 14, 26, 27)
Worries (9, 18, 20, 22, 30) Worries (5, 6, 9, 12, 15,
18, 19, 20, 22, 23, 24, 28) Fear-Anxiety (22, 28) Worries (9, 12, 15, 20, 22, 23)
Tension (12, 14, 26, 27) Tension (1, 8, 10, 14, 26, 27) - -
- Demands (2, 4, 16, 29, 30) - -
- - Self-Realisation-Satisfaction (7, 9, 23) -
Figure 1.Dendrogram of PSQ factors after rectangular axes rotation.
3.3. Confirmatory Factor Analysis (CFA)
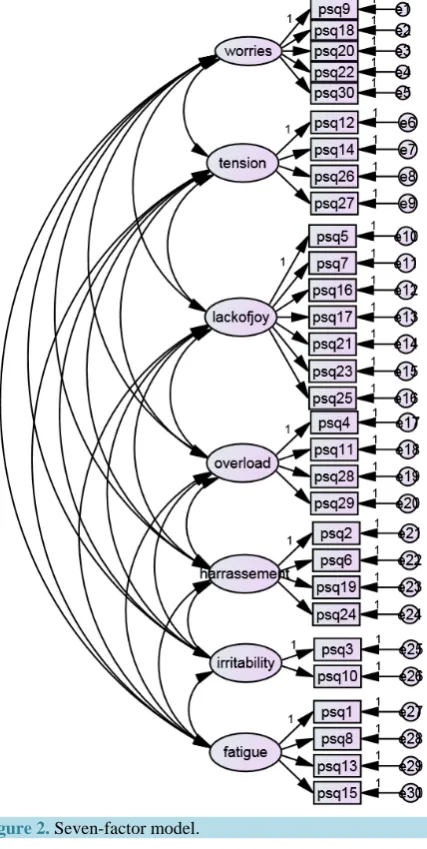
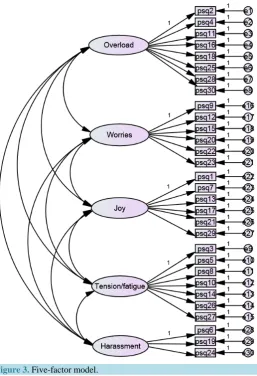
Concerning the factor analysis confirmation, the statistical method of confirmatory factor analysis was used. Two different models were compared: 1) the model of seven factors, which also corresponds to the initial model of the researchers (Figure 2), and 2) the model of five factors (Figure 3).
Table 17. Confirmatory Factor Analysis (CFA) of seven- and five- factorial solution of the PSQ.
Model test Fit statistics
Model x2 df CFI AGFI NFI RMSEA AIC
7-factor 3785.75 384 0.78 0.73 0.76 0.08 3947.75
5-factor 2701.59 395 0.85 0.83 0.83 0.06 2841.59
Note: CFI = Comparative Fit Index; AGFI= Adjusted goodness of Fit; NFI= Normal Fit Index; RMSEA = Root-Mean Square Error of Approximation; AIC = Akaike Information Criterion.
Figure 2.Seven-factor model.
As the table above presents the indexes of good adjustment for the model of seven factors are: χ2(384, Ν = 1318) = 3785.75, p < 0.001, CFI = 0.78, AGFI = 0.73, NFI = 0.76, RMSEA = 0.08. By comparing the figures that the indexes are supposed to have, we can observe that the model of seven of the factors is not satisfying. On the contrary, the model of five factors gives comparatively better results: χ2(395, Ν = 1318) = 2701.59,
p < 0.001, CFI = 0.85, AGFI = 0.83, NFI = 0.83, και RMSEA = 0.06.
[image:13.595.207.421.206.631.2]Figure 3.Five-factor model.
4. Discussion
The purpose of this research was the adjustment Perceived Stress Questionnaire (PSQ), a scale of measurement of perception of stress, from English to Greek standards. It is about a process of linguistic correspondence and cultural transfer of the questionnaire. It presupposes as well a chain of statistic methods for the validity of the psychometric properties of the tool.
For the validation of the reliability of the PSQ scales two ways of control were used. Firstly, by measuring the reliability of the Internal Consistency, in order to validate the homogeneity and consistence of the elements, the index
Cronbach alpha was used, which showed satisfying results approaching the corresponding figures of the ini-tial validation. For the evaluation of the stability in time, the process of test-retest was applied to Ν = 212 people of the sample, in the period of one month. Finally, we had two sets of figures-responses for each of these people, which were also compared. In this case also, the figures were close to the standards of the initial model (Original English validation r = 0.82—Greek validation r = 0.86).
For the evaluation of the Convergent Validity PSS was given to Ν = 453 people of the sample with the PSQ. By using the index of correlation Pearson r, the scales of both tools were compared, which revealed us a strong correlation. It should be noted that in every scale significant statistical correlations were found.
Furthermore, for the evaluation of the Convergent Validity, DASS 21 was also given to Ν = 451 people of the sample. The statistic analysis showed a considerable correlation between the two scales, which is proved by the bibliography as well (Hammen, 2005; Hammen, 2006; Hammen, 2003; Lyrakos et al., 2011).
used with the rotated component matrix. The result did not confirm completely the original factor analysis. The number of the factors seems to be less in the original validation, while the loadings of the items vary showing different construct validities and different structural perception of these factors in the Greek society. A similar diversification on the factor analysis is also met in both German and Spanish validation. More particularly, the original validation recognizes in the test a structure of seven factors: worries: 9, 18, 20, 22, 30, tension: 12, 14, 26, 27, lack of joy: 5, 7, 16, 17, 21, 23, 25, overload: 4, 11, 28, 29, harassment: 2, 6, 19, 24, irritability: 3, 10 and fatigue: 1, 8, 13, 15. On the contrary, in the German validation a structure of four factors is revealed: worries: 5, 6, 9, 12, 15, 18, 19, 20, 22, 23, 24, 28, tension: 1, 8, 10, 14, 26, 27, joy: 7, 13, 17, 21, 25, demands: 2, 4, 16, 29, 30, while items 3 and 11 do not load any factor and have been erased from the final form of the tool. A similar phenomenon is met in the Spanish validation as well, where the items finally load less factors (6 factors) than in the initial edition (7 factors). What is more, new factors are discovered which did not exist in the original valida-tion: fear/anxiety: 22, 28 and self-realization/satisfacvalida-tion: 7, 9, and 23. In the Greek validation the solution of the five factors was judged as the most satisfying. In fact, these factors explain the 54.28% of the variance of the phenomenon. From the original factor analysis the factors Overload, Lack of joy, Harassment and Worries were kept without any change. Nevertheless, in our sample the other two factors Tension and Fatigue of the original validation seem to exist into a common factor: Tension/Fatigue. Even though in the original questionnaire the factors above are loaded separately, in the Greek validation they are loaded in common, while the content of the items seems to be consistent. For example, the questions “Do you feel tired?” and “Do you find it difficult to re-lax?” which in the original validation are loaded in two different fatigue and tension, in the Greek validation they are expressed by one common factor.
Additionally, as far as the factor analysis is concerned the question 8 (Do you feel tired?) seemed to be loaded in both factors fatigue/tension and Overload. This question was chosen, instead of being deleted, to be added to the final score of the factor fatigue/tension, because of its notional-lexical connection with it.
Finally, as far as the question twenty-three is concerned (“Do you feel that you are doing things because you have to and not because you want to?”) in the initial validation, it seems to depend on the factor Lack of Joy, obviously based on the fact that the performance of unwanted actions does not bring satisfaction. Nevertheless, in the Greek validation the item is not loaded in the respective factor, but it is double-loaded in the factor Wor-ries and in the factor Irritation. The double-loading is probably explained by the fact that people from the sample considered that the pressure for the performance of unwanted actions is caused by a third person (see Harass- ment), while the rest people probably considered that the pressure was caused by themselves and because of it Worries for the final result are caused.
In the current validation we decided that the item should be included into the factor Worries, even though this loading is not characterized by a significant difference.
5. Conclusion
The conclusions of this research and the factor analysis of PSQ could be expanded or constitute the basis for re-searches in other cultural and linguistic approaches, where relevant construct validities could be compared. Due to different facts, concerning matters of language and culture, a further research is highly recommended in both norms and psychometric properties of the tool. Still, a further research is also proposed in our validation. If a bigger sample was used, the results could be even stronger concerning the generalization. However, a significant differentiation in the homogeneity of the sample is considered to be possible, since the psychometric character-istics of the tool are in satisfying levels, compared also to the results of the initial validation. Another limitation of the research is the absence of clinic sample. In future possible studies of PSQ in Greek population, the ex-amination of the clinical sample could contribute to the research of the psychosomatic symptoms.
References
Andreou, E., Alexopoulos, C. E., Lionis, C., Varvogli, L., Gnardellis, C., Chroussos, G. P., & Darviri, C. (2011). Perceived Stress Scale: Reliability and Validity Study in Greece. International Journal of Environmental Research and Public Health, 8, 3287-3298. http://dx.doi.org/10.3390/ijerph8083287
Bergdahl, J., & Bergdahl, M. (2002). Perceived Stress in Adults: Prevalence and Association of Depression, Anxiety and Medication in a Swedish Population. Stress and Health, 18, 235-241. http://dx.doi.org/10.1002/smi.946
Brislin, W. R. (1970). Back-Translation for Cross-Cultural Research. Journal of cross-cultural Psychology, 1, 185-216.
http://dx.doi.org/10.1177/135910457000100301
Chrousos, P. G. (2009). Stress and Disorders of the Stress System. Nature Reviews Endocrinology, 5, 374-381.
http://dx.doi.org/10.1038/nrendo.2009.106
Chrousos, G. P. (1998). Stressors, Stress, and Neuroendocrine Integration of the Adaptive Response. The 1997 Hans Selye Memorial Lecture. Annals of the New York Academy of Sciences, 851, 311-335.
http://dx.doi.org/10.1111/j.1749-6632.1998.tb09006.x
Cohen, S., Kamarck, T., & Mermelstein, R. (1983). A Global Measure of Perceived Stress. Journal of Health and Social Behavior, 24, 385-396. http://dx.doi.org/10.2307/2136404
Fliege, H., Rose, M., Arck, P., Levenstein, S., & Klapp, B. F. (2001). Validierung des ’’Perceived Stress Questionnaire’’ (PSQ) an einerdeutschen Strichprobe. Diagnostica, 47, 142-152. http://dx.doi.org/10.1026//0012-1924.47.3.142
Fliege, H., Rose, M., Arck, P., Walter, B. O., Kocalevent, R., Weber, C., & Klapp, B. (2005). The Perceived Stress Ques-tionnaire (PSQ) Reconsidered: Validation and Reference Values From Different Clinical and Healthy Adults Samples.
Psychosomatic Medicine, 67, 78-88. http://dx.doi.org/10.1097/01.psy.0000151491.80178.78
Hammen, C. (2006). Stress Generation in Depression: Reflection on Origins, Research and Future Directions. Journal of Clinical Psychology, 62, 1065-1082. http://dx.doi.org/10.1002/jclp.20293
Hammen, C. (2003). Research Report. Interpersonal Stress and Depression in Women. Journal of Affective Disorders, 74,
49-57. http://dx.doi.org/10.1016/S0165-0327(02)00430-5
Hammen, C. (2005). Stress and Depression. Annual Review of Clinical Psychology, 1, 293-319.
http://dx.doi.org/10.1146/annurev.clinpsy.1.102803.143938
Horowitz, M. J., Wilner, N., & Alvarez, W. (1979). Impact of Event Scale: A Measure of Subjective Distress. Psychosomatic Medicine, 41, 209-218. http://dx.doi.org/10.1097/00006842-197905000-00004
Kanner, A. D., Coyen, J. C., Schaefer, C., & Lazarus, R. S. (1981). Comparison of Two Models of Stress Measurement: Daily Hassles and Uplifts versus Mayor Life Events. Journal of Behavioral Medicine, 4, 1-39.
http://dx.doi.org/10.1007/BF00844845
Keefer, L., Kielbes, L. J., Kwiatek, A. M., Palsson, O., Taft, H. T., Martionovich, Z., & Barrett, A. T. (2012). The Potentioal Role of a Self-Management Intervention for Ulcerative Colitis: A Brief Report from the Ulcerative Colitis Hypnotherapy Trial. Biological Research for Nursing, 14, 71-77. http://dx.doi.org/10.1177/1099800410397629
Kessler, R. C. (1997). The Effects of Stressful Life Events on Depression. Annual Review of Psychology, 48, 191-214.
http://dx.doi.org/10.1146/annurev.psych.48.1.191
Kocalevent, R., Levenstein, S., Fliege, H., Schmid, G., Hinz, A., Brahler, E., & Klapp, B. F. (2007). Contribution to the Construct Validity of the Perceived Stress Questionnaire from a Population-Based Survey. Journal of Psychosomatic Re-search, 63, 71-81. http://dx.doi.org/10.1016/j.jpsychores.2007.02.010
Krohn, M., Listing, M., Tjahjono, G., Reisshauer, A., Peters, E., Klapp, F. B., & Rauchfuss, M. (2011). Depression, Mood, Stress, and Th1/ Th2 Immune Balance in Primary Breast Cancer Patients Undergoing Classical Massage Therapy. Suppor-tive Care in Cancer, 19, 1303-1311. http://dx.doi.org/10.1007/s00520-010-0946-2
Lazarus, R. S. (1993). Coping Theory and Research: Past, Present and Future. Psychosomatic Medicine, 55, 234-247.
http://dx.doi.org/10.1097/00006842-199305000-00002
Lazarus, R. S., & Folkman, S. (1984). Stress, Appraisal, and Coping. New York: Spinger.
Levenstein, S., Pantera, C., Varvo, V., Scribano, M. L., Andreoli, A., Luzi, C., Arca, M., & Berto, E. (1994). Psychological Stress and Disease Activity in Ulcerative Colitis: A Multidimensional Cross-Sectional Study. American Journal of Gas-troenterology, 89, 1219-1225.
Levenstein, S., Pantera, C., Varvo, V., Scribano, M. L., Andreoli, A., Luzi, C., Arca, M., Berto, E., Milite, G., & Marcheg-giano, A. (2000). Stress and Exacerbation in Ulcerative Colitis: A Prospective Study of Patients Enrolled in Remission.
The American Journal of Gastroenterology, 95, 1213-1220. http://dx.doi.org/10.1111/j.1572-0241.2000.02012.x
http://dx.doi.org/10.1016/0022-3999(93)90120-5
Liu, T. R., & Alloy, L. (2010). Stress Generation in Depression: A Systematic Review of the Empirical Literature and Rec-ommendation for Future Study. Clinical Psychology Review, 30, 582-593. http://dx.doi.org/10.1016/j.cpr.2010.04.010
Lorentz, M. (2006). Stress and Psychoneuroimmunology Revised: Using Mind-Body Intervention to Reduce Stress. Alterna-tive Journal of Nursing, 11.
Lovibond, P. F., & Lovibond, S. H. (1995a). The Structure of Negative Emotional States: Comparison of the Depression Anxiety Stress Scale (DASS) with the Beck Depression and Anxiety Inventory. Behaviour Research and Therapy, 33,
335-343. http://dx.doi.org/10.1016/0005-7967(94)00075-U
Lyrakos, G. N., Arvaniti, C., Smyrnioti, M., & Kostopanagiotou, G. (2011). P03-561-Translation and Validation Study of the Depression Anxiety Stress Scale in the Greek Population and in a Psychiatric Patient’s Sample. European Psychiatry, 26,
1731. http://dx.doi.org/10.1016/S0924-9338(11)73435-6
Peackock, E. J., & Wong, P. T. P. (1990). The Stress Appraisal Measure (SAM): A Multidimentional Approach to Cognitive Appraisal. Stress Medicine, 6, 227-236. http://dx.doi.org/10.1002/smi.2460060308
Rosenberger, C., Elsenbruch, S., Scolle, A., Greiff, A., Schedlowski, M., Forsting, M., & Gizewski, E. R. (2009). Effects of Psychological Stress on the Cerebral Processing of Visceral Stimuli in Healthy Women. Neurogastroenterology & Motil-ity, 21, 740-747. http://dx.doi.org/10.1111/j.1365-2982.2009.01295.x
Sanz-Carrillo, C., Garcia-Campayo, J., Rubio, A., Santed, M. A., & Montoro, M. (2002). Validation of the Spanish Version of the Perceived Stress Questionnaire. Journal of Psychosomatic Research, 52, 167-172.
http://dx.doi.org/10.1016/S0022-3999(01)00275-6