Full Length Research Article
QTL MAPPING IN CROP PLANTS: PRINCIPLES AND APPLICATIONS
*1
Veeresha, B. A.,
1Rudra Naik, V.,
2Chetti, M. B.,
1Desai, S. A. and
1Suma S. Biradar
1
Department of Genetics and Plant Breeding,
2Department of Crop Physiology, University of Agricultural
Sciences, Dharwad-580005, Karnataka, India
ARTICLE INFO ABSTRACT
Many agriculturally important traits such as yield, quality and some form of disease resistance are controlled by many genes (poly genes) and are known as quantitative traits. Identification of the genomic region containing few or more genes controlling these complex traits is a basic idea of QTL mapping. The large number of QTL mapping studies for diverse crop species has provided an abundance of DNA marker-trait associations. The information obtained on the QTL analysis can be utilized for the crop improvement through marker aided selection and molecular breeding. The basic knowledge about DNA markers, principle of QTL mapping, statistical tools and techniques used in QTL analysis and applications of QTL mapping has been reviewed. This paper will be a key reference for the beginners and research scholars who are involved in QTL mapping in crop plants.
Copyright © 2015 Veeresha et al. This is an open access article distributed under the Creative Commons Attribution License, which permits unrestricted use, distribution, and reproduction in any medium, provided the original work is properly cited.
INTRODUCTION
A study of the genetics of quantitative traits in different plant system is an important area of plant biotechnology research. Such studies have already been done in most of the crop species and that has improved our understanding about the inheritance of complex traits. It was realized that most of the commercially important traits in crop plants, domestic animals as well as in humans are quantitative in nature. Each of these quantitative traits is controlled by many genes which were termed as polygenes by Mather (1949). With the aid of molecular markers and appropriate statistical tools one can identify chromosome loci each carrying one or more genes controlling quantitative or complex trait. Each such identified locus is described as quantitative trait loci (QTL). A QTL is defined as “a region of the genome that is associated with an effect of a quantitative trait.” So a QTL can be a single gene, or it may be a cluster of linked genes that affect the traits.
*Corresponding author: Veeresha, B. A.,
Department of Genetics and Plant Breeding, University of Agricultural Sciences, Dharwad-580005, Karnataka, India
QTL mapping studies have reported in most of the crop plants for diverse traits like yield, quality disease and insect pest resistance, abiotic stress tolerance and environmental adaptation.
Principles of QTL Mapping
Identifying a gene or QTL with in a plant genome is like finding the needle in a hay stack. QTL analysis is based on the principle of detecting an association between phenotype and the genotype of markers. The markers are used to partition the mapping population in to different genotypic classes based on genotypes at the marker locus, and apply the correlative statistics to determine whether the individual of one genotype differ significantly with the individuals of other genotype with respect to the trait under study. A significant difference between phenotypic means of the two / more groups depending on the marker system and type of population indicates that the marker locus being used to partition the mapping population is linked to a QTL controlling the trait. A significant P value obtained for the differences between the marker and QTL is due to recombination. The closer a marker is from a QTL, the lower the chance of recombination
ISSN: 2230-9926
International Journal of Development Research
Vol. 5, Issue, 01, pp. 2961-2965, January,2015
International Journal of
DEVELOPMENT RESEARCH
Article History:
Received 24th October, 2014
Received in revised form 28th November, 2014 Accepted 05th December, 2014
Published online 26th January, 2015
Key words:
QTLs,
Molecular Marker, Mapping Population, QTL Mapping, QTL Analysis, MAS,
occurring between marker and QTL. Therefore, the QTL and marker will be usually be inherited together in the progeny, and the mean of the group with the tightly-linked marker will be significantly different (P < 0.05) to the mean of the group without the marker. When a marker is loosely-linked or unlinked to a QTL, there is independent segregation of the marker and QTL. In this situation, there will be no significant difference between means of the genotype groups based on the presence or absence of the loosely linked marker. Unlinked markers located far apart or on different chromosomes to the QTL are randomly inherited with the QTL; therefore, no significant differences between means of the genotype groups will be detected.
Steps in QTL Mapping
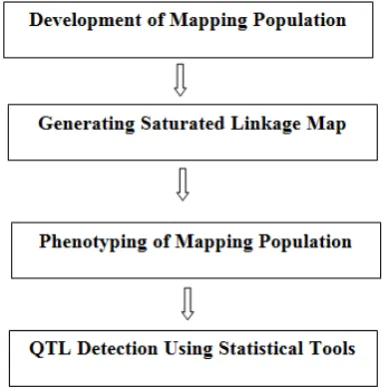
[image:2.595.311.555.49.249.2]The various steps in the identification and characterization of quantitative trait loci (QTL) for use in marker assisted selection are presented in figure1. The process of QTL mapping involves the four major steps, which were discussed below under following subheadings.
Figure 1. The various steps in the identification quantitative trait loci (QTL) for use in marker assisted selection
Developing of Mapping Population
A suitable mapping population generated from phenotypically contrasting parents is prerequisite for QTL mapping (E.g.: highly resistant and susceptible lines). The parental lines used in development of mapping population should be genetically diverse, which enhance the possibility of identifying a large set of polymorphic markers that are well distributed across the genome. Several different populations may be utilized for mapping within given plants species as shown in Figure 2. With each population type possessing advantages and disadvantages. The mapping population could vary based on the objective of study, the time frame line and resources available for undertaking QTL mapping. The ability to defect QTL in F2 or F2 derived populations and RILs are relatively higher than other mapping population. The F2:3 families have the advantage that it is possible to measure the effects of additive and dominant gene actions at specific loci. The RILs are essentially homozygous and only additive gene action can be measured, the advantage with RILs is that the experiments can be performed at several locations in multiple years.
Figure 2. Diagram of the main types of mapping populations for self-pollinating species (Collard et al., 2005)
The size of the mapping population for QTL analysis depends on several factors viz., type of mapping population used for QTL analysis, genetic nature of the target trait, objective of the study, and resources available for handling a sizable mapping population in terms of phenotyping and genotyping. From the practical point of view the purpose of QTL mapping is to detect the QTL, with major effects, and it is possible only when large number of individuals say 500 or more being used for QTL analysis. So in general size of the mapping population is around 200-300 individuals.
Generating Saturated Linkage Map
Mapping means placing the markers in order, indicating the relative genetic distance between them and assaying them to their linkage groups on the basis of recombination values from all pair wise combination between the markers. Linkage map indicates the position and relative genetic distance between markers along chromosomes. We can analyze the segregation patterns for each of the markers by screening the mapping population using polymorphic molecular markers, which is referred as genotyping. A vanity of molecular markers viz., RFLPs, RAPD, SSRs, AFLP, and SNPs etc have been used to identify individual QTLs and to find out effects and position of these QTLs. The commonly used molecular markers along with important advantages and disadvantages are presented in Table 1.
[image:2.595.67.260.304.500.2]Figure 3. Comparison between (a) codominant and (b) dominant markers. Codominant markers can clearly discriminate between homozygotes and heterozygotes whereas dominant markers do not. Genotypes at two marker loci (A and B) are indicated below
the gel diagrams
Phenotyping of Mapping Population
The target quantitative traits have to be measures as precisely as possible. Strictly speaking there should not be any missing date, but limited amounts of missing data can be tolerated. The missing data in the population causes the effective in the sample size and intern affect the power of QTL mapping. The data is pooled over location and replication to obtain a single quantitative value for the line. It is also necessary to measure the target traits in experiments conducted in multiple location to have better understanding of the QTL x Environment interaction.
QTL Detection
The basic purpose of QTL mapping is to detect QTL, while minimizing the occurrence of false positive (Type I Error) i.e. declaring an association between a marker and QTL when in fact it does not exists). The tests for QTL or trait association are often performed by the following approaches:
a) Single Marker Analysis (SMA)
It is also referred as single point analysis. It is the simplest method for detecting QTL associate with single markers. The statistical method used for the single point analyses includes T-test, analyses of variance (ANOVA) and linear regression. SMA is done for each marker locus independent of information for other loci. This method does not require complete linkage map and can be performed with basic statistical software programs. However the major disadvantage is that the further QTL is from a marker, the less likely it will be detected. This is because recombination may occur between the marker and the QTL. The effect of QTLs is likely to be underestimated because these are confounded recombination frequencies. The use of large number polymorphic DNA markers covering the entire genome may minimize these problems (Tanskley 1993).
b) Simple Interval Mapping (SIM)
[image:3.595.49.545.79.289.2]Simple Interval Mapping was first proposed by Lander and Botstein in 1989. SIM method makes use of linkage maps and analysis intervals between adjacent pairs of linked markers along the chromosomes, simultaneously, instead of analyzing single markers. Presence of a putative QTL is estimated if the
Table 1.Advantages and disadvantages of most commonly-used DNA markers for QTL analysis
Molecular marker Codominant or Dominant Advantages Disadvantages References Restriction fragment
length polymorphism (RFLP)
Codominant • Robust • Reliable
• Transferable across populations
• Time-consuming, laborious and expensive
• Large amounts of DNA required
• Limited polymorphism (especially in related lines)
Beckmann and Soller (1986), Kochert (1994), Tanksley et al. (1989)
Random amplified polymorphic DNA (RAPD)
Dominant • Quick and simple • Inexpensive
• Multiple loci from a single primer possible
• Small amounts of DNA required
• Problems with reproducibility
• Generally not transferable
Penner (1996), Welsh and McClelland (1990), Williams et al. (1990)
Simple sequence repeats (SSRs)∗ or
‘microsatellites’
Codominant • Technically simple • Robust and reliable • Transferable between populations
• Large amounts of time and labour required for production of primers • Usually require polyacrylamide electrophoresis
McCouch et al. (1997), Powell et al. (1996), Taramino and Tingey (1996)
Amplified fragment Length Polymorphism (AFLP)
Dominant • Multiple loci • High levels of polymorphism generated
• Large amounts of DNA required
• Complicated methodology
[image:3.595.42.390.314.562.2]Vos et al. (1995)
Table 2. Genetic segregation ratio at marker locus in different population types
Marker Nature
Genetic segregation ratio
F2 RILs DHs NILs
Backcross Populations
B1 B2
RAPD Dominant 3:1 1:1 1:1 1:1 1:0 1:1
AFLP Dominant 3:1 1:1 1:1 1:1 1:0 1:1
RFLP Codominant 1:2:1 1:1 1:1 1:1 1:1 1:1
logarithm of odds ratios (LOD) exceeds a critical threshold which is more often fixed as > or =3. The use of linked markers for analysis compensates for recombination between the marker and the QTL, and is considered statistically more powerful than SMA. Many researchers have used Mapmaker/QTL (Lincoln et al., 1993) and QGene (Nelson, 1997) to construct SIM.
c) Composite Interval Mapping (CIM)
Composite Internal Mapping is one of the popular methods used to detect QTLs. CIM was developed by Zeng (1993; 1994) and MQM (Multiple QTL model or marker –QTL marker analysis) by Jansen and Stam (1994). This method combines internal mapping with linear regression. It considers a marker interval plus a few other well-chosen single markers in each analysis. The main advantage of CIM is that it is more precise and effective at mapping QTLs compared to SMA and SIM, especially when linked QTL are involved. Many researchers have used QTL Cartographer (Basten et al., 1994; 2001) and Map manager QTL (Manly et al., 2001) to perform CIM.
d) Multiple Interval Mapping (MIM)
Most recently MIM has become popular for mapping QTLs. MIM is the extension of internal mapping to multiple to multiple QTLs, just as multiple regression extends analysis of variance. MIM allows one to infer the location of QTLs to position between markers makes proper allowance for missing genotype data and can allow interaction between QTLs. The different software used for QTL analysis along with their salient features is presented in Table 3.
AB-QTL Analysis
Advanced backcross QTL (AB-QTL) analysis was proposed by Tanskley and Nelson (1996). It is another important approach for QTL mapping, which aims at simultaneous detection and transfer of useful QTLs from the wild / un-adapted relatives to a popular cultivar for improvement of a trait. Using this technique QTL analysis have been conducted in crops like Tomato (Chaib et al., 2006 and Stevens et al.,
2007), Wheat (Kunert et al., 2007) and Barley (Li et al., 2006 and Schmatenbach et al., 2009) and Rice (Cheema et al., 2008 and Xie et al., 2008).
Application of QTL Mapping
The introgression of QTLs into elite lines / germplasm, and maker-aided selection (MAS) for QTLs in crop improvement has to be undertaken in some of the crop like Maize (Li et al.,
2008), Tomato (Stevens et al., 2007) and Wheat (Naz et al.,
[image:4.595.309.554.195.378.2]2008). The plant breeders may need not to know the precise location of QTL as the QTL has large effect and can be introgressed using marker assisted back crossing (MABB). In Maize the QTLs with major effects which conferring resistance to downy of mildews has been identified and transferred into CM139 elite but downy mildew- susceptible inbred line (George et al., 2003; Nair et al., 2005). QTLs so identified for diverse traits in different crops have been met in crop improvement especially to enhance the yield and to develop disease resistance elite lines. The possible application of QTL mapping is presented in Figure 4.
Figure 4. Application of QTL mapping
Conclusion
There have been numerous QTL mapping studies for a wide range of traits in diverse crop species. The low accuracy of QTL mapping studies and inadequate validation of QTLs come in the way of practical utility of this QTL information for crop improvement. However improvements in mapping software using more statistically powerful methods and more innovative and effective strategies allowed researcher to precisely identify and validate the QTLs. These have been used to incorporate into elite germplasm lines through MAS in many crop plants. New developments and improvements in marker technology, the integration of functional genomics with QTL mapping and the availability of more high density maps will greatly affect the efficiency and effectiveness of QTL mapping and utilization of QTL information for crop improvement by MAS research in the future.
Table 3. Software for QTL analysis
Software Features
MAPMAKER/QTL Interval mapping (IM)
QGene Single Marker Analysis (SMA), IM and multiple-trait analysis
MapQTL IM, Composite Interval Mapping (CIM), non-parametric mapping with the kruskal-Wallis rank sum test per marker (for non-normally distributed data), permutation tests, etc.
PLABQTL Simple Interval Mapping (SIM), CIM, also analysis for QTL x Environment (QE) interactions MQTL SIM, CIM, also analysis for main effect, QE interactions, and can perform permutation tests MapManager QTXSMA, SIM, CIM, searches for interacting QTLs, etc.
QTL Cartographer SMA, SIM, CIM, Bayesian Interval Mapping (BIM), Multiple Interval Mapping (MIM), multiple trait analysis, permutation tests, etc. QTLMapper Mapping QTL with epistatic effects, QE interaction effects etc.
[image:4.595.40.559.458.567.2]REFERENCES
Basten, C., B. Weir and Z.-B. Zeng, 2001. QTL Cartographer. Department of Statistics, North Carolina State University, Raleigh, NC.
Basten, C.J., B.S. Weir and Z.-B. Zeng, 1994. Zmap-a QTL cartographer. In: J.S.G.C. Smith, B.J. Benkel,W.F. Chesnais, J.P. Gibson, B.W. Kennedy and E.B. Burnside (Eds.), Proceedings of the 5th World Congress on Genetics Applied to Livestock Production: Computing Strategies and Software, Guelph, Ontario, Canada. Published by the Organizing Committee, 5th World Congress on Genetics Applied to Livestock Production.
Chaïb, J., Lecomte, L., Buret, M. and Causse, M. 2006. Stability over genetic backgrounds, generations and years of quantitative trait locus (QTLs) for organoleptic quality in tomato. Theor. Appl. Genet., 112: 934–944.
Cheema, KK., Navtej, SB., Mangat, GS., Das, A., Vikal, Y., Brar, DS., Khush, GS. and Singh, K. 2008. Development of high yielding IR64 × Oryza rufipogon (Griff.) introgression lines and identification of introgressed alien chromosome segments using SSR markers. Euphytica, 160: 401–409.
Collard, BCY., Jahufer, MZZ., Brouwer, JB. and Pang, ECK. 2005. An introduction to markers, quantitative trait loci (QTL) mapping and marker-assisted selection for crop improvement: The basic concepts. Euphytica 142: 169-196.
George, M.L.C., B.M. Prasanna, R.S. Rathore, T.A.S. Setty, F. Kasim, M. Azrai, S. Vasal, O. Balla, D. Hautea, A. Canama, E. Regalado, M. Vargas, M. Khairallah, D. Jeffers and D. Hoisington, 2003. Identification of QTLs conferring resistance to downy mildews of maize in Asia.
Theor Appl Genet 107: 544–551.
Jansen, R. and P. Stam, 1994. High resolution of quantitative traits into multiple loci via interval mapping. Genetics 136: 1447–1455.
Kunert, A., Naz, AA., Dedeck, O., Pillen, K. and Léon, J. 2007. AB-QTL analysis in winter wheat: I. Synthetic hexaploid wheat (T. turgidum ssp. dicoccoides × T.
tauschii) as a source of favourable alleles for milling and
baking quality traits. Theor. Appl. Genet., 115: 683–695. Li, JZ., Huang, XQ., Heinrichs, F., Ganal, MW. and Röder,
MS. 2006. Analysis of QTLs for yield components, agronomic traits, and disease resistance in an advanced backcross population of spring barley. Genome 49:454– 466.
Li, YL., Dong, Y., Niu, S., Cui, D., Wang, Y., Liu, Y., Wei, M. and Li, X. 2008. Identification of Agronomically favorable quantitative trait loci alleles from a dent corn inbred Dan232 using advanced backcross QTL analysis and comparison with the F2:3 populations in popcorn. Mol.
Breed, 21: 1–14.
Lincoln, S., M. Daly and E. Lander, 1993b. Mapping genes controlling quantitative traits using MAPMAKER/QTL. Version 1.1. Whitehead Institute for Biomedical Research Technical Report, 2nd Edn.
Manly, K.F., H. Cudmore Robert, Jr. and J.M. Meer, 2001. Map Manager QTX, cross-platform software for genetic mapping. Mamm Genome 12: 930–932.
Naz, AA., Kunert, A., Lind, V., Pillen, K. and Léon, J. 2008. AB-QTL analysis in winter wheat: II. Genetic analysis of seedling and field resistance against leaf rust in a wheat advanced backcross population. Theor. Appl.Genet., 116: 1095–1104.
Nelson, J.C., 1997. Qgene—software for marker-based genomic analysis and breeding. Mol. Breed 3: 239–245. Stevens, R., Buret, M., Duffé, P., Garchery, C., Baldet, P.,
Rothan, C. and Causse, M. 2007. Candidate genes and quantitative trait loci affecting fruit ascorbic acid content in three tomato populations (2007). Plant Physiol., 143: 1943–1953.
Tanksley, S.D., 1993. Mapping polygenes. Annu Rev Genet
27: 205–233.
Tanksley, S.D., M.W. Ganal, J.P. Prince, M.C. De Vicente, M.W. Bonierbale, P. Broun, T.M. Fulton, J.J. Giovannoni and S. Grandillo, 1992. High density molecular linkage maps of the tomato and potato genomes. Genetics 132: 1141–1160.
Xie, X., Jin, F., Song, MH., Suh, JP., Hwang, HG., Kim, YG., McCouch, SR. and Ahn, SN. 2008. Fine mapping of a yield-enhancing QTL cluster associated with transgressive variation in an Oryza sativa × O. rufipogon cross. Theor.
Appl. Genet., 116: 613–622.
Zeng, Z.-B., 1993. Theoretical basis for separation of multiple linked gene effects in mapping quantitative trait loci. Proc
Natl Acad Sci USA 90: 10972–10976.
Zeng, Z.-B., 1994. Precision mapping of quantitative trait loci.
Genetics 136: 1457–1468.