4304
SPECTRAL ENERGY BASED VOICE ACTIVITY DETECTION
FOR REAL-TIME VOICE INTERFACE
1JEONG-SIK PARK, 2JUNG-SEOK YOON, 3YONG-HO SEO, 4*GIL-JIN JANG 1,2Department of Information & Communication Engineering, Yeungnam University, South Korea
3Department of Intelligent Robot Engineering, Mokwon University, South Korea
4School of Electronics Engineering, Kyungpook National University, South Korea
E-mail: 1[email protected], 2[email protected], 3[email protected], 4[email protected]
ABSTRACT
Voice activity detection (VAD) is a main process of speech recognition tasks in which every voice region is detected to extract acoustic feature parameters from the region. This paper proposes an efficient VAD approach for applying to real-time voice interface systems. Even though diverse VAD approaches have been successfully applied for speech applications, they may operate inefficiently according to environmental conditions. In this study, we attempt to enhance the conventional VAD method based on signal energy within time and spectral domain. In addition, an efficient end-point detection method is also proposed. We successfully verified the efficiency of the proposed approach via a set of VAD experiments, comparing with the performance of some conventional VAD methods including zero crossing rate.
Keywords: Voice Activity Detection, End-point Detection, Voice Interface, Spectral Domain, Spectral Energy
1. INTRODUCTION1
Recently, a variety of electronic devices using voice interface have been developed to seek convenience of human life. In particular, personal assistant devices become popular as a representative voice interface application. The device provides useful information that a user wants, while communicating with the user. In the smart device era, people are more satisfied with controlling smart devices via voice [1][2].
The voice interface systems require several essential techniques including speech recognition, speech synthesis, and interference cancellation [3][4]. Among them, speech recognition determines the overall performance and reliability of the systems. Even though the recent advances in machine learning techniques such as deep learning led to the technical breakthrough of speech recognition, it still has challenges to achieve a final goal as a natural user interface.
Speech recognition tasks consist of three main processes including pre-processing, recognition, and post-processing [5]. The main purpose of pre-processing is to detect a voice region and extract acoustic feature parameters from
Corresponding author: Gil-Jin Jang
the region. The recognition process obtains a recognition result using a pattern recognition technique as a criterion measure. The final post-processing aims to verify the recognition result based on utterance verification techniques. Each of the processes has been studied as an independent research issue, as they independently affect the system performance. Among them, this study concentrates on the pre-processing, in particular, the detection of a voice region also called the voice activity detection (VAD).
This paper is organized as follows. Section 2 explains the conventional VAD techniques. The proposed VAD method is introduced in Section 3, and experimental results are discussed in Section 4. Finally, this paper concludes in Section 5.
2. THE CONVENTIONAL VOICE ACTIVITY DETECTION TECHNIQUES 2.1 Voice Activity Detection
4305
Figure 1: Detection of a Voice Region
recognition and post-processing begin to operate after detecting a voice region. The correct detection of voice regions is a very important task, as all the detected regions are submitted to next processes of speech recognition.
Various approaches have been introduced for the detection of voice regions as a name of a VAD technique [6]-[9]. In this section, we introduce several representative VAD approaches.
2.2 The Conventional Voice Activity Detection Approaches
2.2.1 Cepstral distance based VAD
In a voice detection method, cepstral distance was used based on a Euclidean distance [10]. To extract features of the cepstrum, speech signals are applied by the Fast Fourier Transform (FFT) as logarithmic scale and implemented by the Inverse Fast Fourier Transform (IFFT). Cepstral features are obtained as a result of the IFFT. The features are extracted by multiplying the cepstral window in the cepstrum domain.
This method assumes that speech regions indicate larger cepstral distance between speech signal frames, while non-speech regions draw relatively smaller cepstral distance between frames. Based on this property, if a frame indicates larger distance, it is categorized as a speech region. On the other hand, non-speech regions demonstrate a smaller cepstral distance between frames than a pre-determined threshold.
The correctness of the threshold greatly affects the accuracy of the decision of speech and non-speech regions, as the decision criterion is only dependent on the threshold. For this reason, the cepstral distance based VAD approach is useful for limited speech data.
2.2.2 Zero-crossing rate based VAD
The most representative VAD approach is based on zero crossing rate (ZCR) and signal
energy [11][12]. Zero crossing occurs when signal signs change, as shown in Figure 2. The regions of the sign-change are called zero crossing points. ZCR means the number of zero crossing points within a certain length of signals. It also demonstrates the rate of sign-changes along signals, i.e., the frequency at which the signal changes from positive to negative or adversely, as follows [13].
1
1
1
( ( ) ( 1))
1
T
t
zcr
f x t x t
T
(1) where
x t
( )
is the t-th signal among T signals, and the indicator function ()f is 1 if its argument is lower than zero. In other words, if two consecutive signals,x t
( )
andx t
( 1)
, have different signs, the function indicates 1. Then, the zcr calculates the frequency of sign-changes from T signals. In general, speech regions represent more frequent sign-changes compared to non-speech regions. Thus, a frame indicating relatively higher value ofzcr tends to be a speech region.
4306
Figure 2: Meaning of Zero Crossing
However, it may provide poor performance depending on environments. In particular, this method is known to be very vulnerable for background noises.
2.2.3 Signal energy based VAD
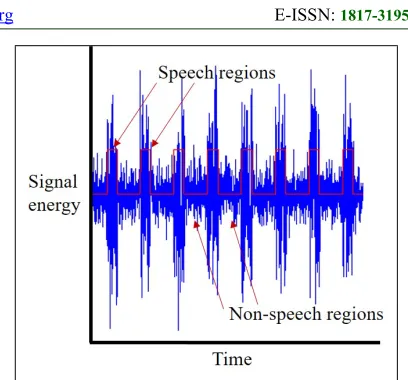
Signal energy based approach has been also widely used for speech recognition, because signal energy provides the most intuitive criterion for dividing speech region and non-speech region, as shown in Figure 3. This figure represents signal energy of input audio signals in which speech signals and non-speech signals are sequentially entered into a microphone. The signal energy in speech regions is clearly distinguishable from the energy in non-speech regions.
The signal energy based VAD approach continuously estimates a frame energy within a fixed length of signals called a frame size, as follows.
2 1
1 T ( )
t
E x t
T
(2)where
x t
( )
is the t-th signal among T signals included in a frame. [image:3.612.316.520.71.261.2]The frame energy is used as a criterion to determine if the frame belongs to a speech region or a non-speech region. This approach provides reliable VAD results under a fundamental aspect that the signal energy of speech regions is relatively higher than that of non-speech regions. But, it sometimes induces incorrect detection results, especially when noise signals interfere [7].
Figure 3: Speech and Non-speech Regions
3. THE PROPOSED VAD APPROACH 3.1 Spectral Domain Energy based VAD
It is a natural property that the signal energy obtained from time domain should directly correspond to the energy from frequency domain also called spectral domain because of a fact that the time domain energy is preserved in the spectral domain. For this reason, the spectral domain energy is expected to provide similar performance as the conventional time domain energy (also called frame energy) based VAD method does.
However, spectral domain enables to estimate more sophisticated energy distribution over frequencies, as it provides different spectral energy over each frequency region from low to high. An important property in speech signals is that human voice preserves spectral components pertinent to a certain frequency range, in particular, relatively low frequency range. In addition, an audible frequency range meaning a frequency range in which general humans can hear sounds is between 20 Hz and 20,000 Hz.
4307
Figure 4: Spectral Energy Distribution of General Human Voice
Figure 5: Procedure of the Proposed Spectral Energy-based Voice Activity Detection
In this study, we attempt to use the low frequency energy as a measure of VAD instead of using entire spectral energy. Figure 5 demonstrates the proposed VAD procedure. Input speech signals are firstly divided into a frame unit. Signals within a frame are processed by FFT procedure to obtain spectral values that mean power spectral energy. Then, the spectral energy in a low frequency region is estimated and the energy is compared with a pre-determined threshold. If the energy indicates a higher value than the threshold, the corresponding frame is regarded as a speech frame. Otherwise, the frame is determined to be a non-speech frame.
The decision procedure can be expressed as a following formula.
/ N d
2 2i i i
k 0
P Re k Im k (3)
i i
P Threshold
speech
P Threshold
non speech
(4)where Rei
k and Imi
k are the real component and the imaginary component for thek
-th FFT point in the i -th frame.N
is the total number of FFT points for a frame, and d determines the range of low frequency regions, indicating an integer value larger than 1. After a spectral energyi
P
of the i -th frame is obtained, the frame is categorized as a speech frame or a non-speech frame, as (2).4308 within only the range, thus reducing the computation amount.
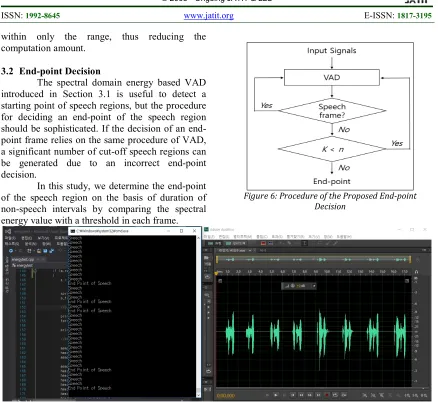
3.2 End-point Decision
The spectral domain energy based VAD introduced in Section 3.1 is useful to detect a starting point of speech regions, but the procedure for deciding an end-point of the speech region should be sophisticated. If the decision of an end-point frame relies on the same procedure of VAD, a significant number of cut-off speech regions can be generated due to an incorrect end-point decision.
[image:5.612.89.527.63.465.2]In this study, we determine the end-point of the speech region on the basis of duration of non-speech intervals by comparing the spectral energy value with a threshold in each frame.
Figure 6: Procedure of the Proposed End-point Decision
Figure 7: Program Execution Results on Input Speech Signals
Figure 6 illustrates the procedure of the proposed end-point detection. When several frames are consecutively determined as speech frames by the VAD process and then a following frame is firstly determined as a non-speech frame, the number (K) of consecutive non-speech frames is calculated. If K is equal to the pre-determined value n, the last frame is determined as the end-point of the speech region. This approach determines an end-point of a voice region by examining consecutive frames, thus it is expected to determine an end-point more correctly than a single frame-based decision.
4. EXPERIMENTAL SETUP AND RESULTS
In this section, we introduce results of a set of experiments performed to validate the efficiency of our proposed method.
4.1 Experimental Setup
We performed real-time voice detection experiments with several participants to verify the efficiency of the proposed VAD approach. We chose several speech utterances of short phrase such as “speech_start”, “mic_input’, “ok_speech”, and “ok_speech_start”. The short phrases were chosen in order to concentrate on the correctness of VAD excluding other factors generated from long phrases or full sentences.
[image:5.612.92.521.273.466.2]4309
4.2 Experimental Results
In general, the VAD performance is measured by two kinds of error rates: false rejection rate (FRR) and false alarm rate (FAR). FRR means an error rate at which a speech region is determined as a non-speech region. On the other hand, FAR means an error rate at which a non-speech region is recognized as a non-speech region [14].
We tested the VAD performance using participants’ recording data entered into our system on real time. Figure 7 displays real-time execution results on input speech signals. As shown in this figure, we made similar amount of speech regions and non-speech regions for evaluation.
We firstly investigated the voice detection on time and spectral domain energy to compare the
performance of two domains. In this experiment, the threshold was empirically estimated. For fair verification, same test data were used in each experiment.
Table 1 and Table 2 represent the VAD performances conducted on time and spectral domain, respectively. Table 3 summarizes the results. As shown in these tables, the spectral domain energy provided better accuracy than the time domain energy.
[image:6.612.87.296.332.424.2]Next, to find the reason of such a difference, we analyzed the distribution of time and spectral domain energy using a set of speech data. Figure 8 and Figure 9 represent the distribution. These results explain that the spectral energy demonstrates more intensive energy property than time energy, thus positively affecting the VAD performance.
Table 1: VAD Performance on Spectral Domain. (Fr and Fa denote FRR and FAR, respectively.)
Thres
hold Fr Person1 Fa Fr Person2 Fa Fr Person3 Fa Fr Person4 Fa
1
0.3 0.8 0.2 0.7 0.2 1.0 0.1 0.72
0.6 0.3 0.6 0.2 0.6 0.3 0.5 0.33
0.6 0.3 0.6 0.2 0.6 0.3 0.5 0.24
0.8 0.2 0.8 0.2 0.8 0.3 0.8 0.2Table 2: VAD Performance on Time Domain. (Fr and Fa denote FRR and FAR, respectively.)
Thres
hold Fr Person1 Fa Fr Person2 Fa Fr Person3 Fa Fr Person4 Fa
1
0.2 0.9 0.1 0.8 0.1 1.6 0.1 0.72
0.4 0.4 0.3 0.4 0.6 0.5 0.2 0.33
0.6 0.3 0.4 0.2 0.6 0.4 0.4 0.24
0.6 0.3 0.6 0.2 0.6 0.4 0.6 0.2Table 3: VAD Performance on Time and Spectral Domains.
Thresh
old FRR Spectral FAR Thresh old FRR Time FAR
1
0.25 0.87
1 0.20 0.992
0.73 0.29
2 0.48 0.423
0.73 0.26
3 0.65 0.334
1.00 0.20
4 0.75 0.30These experiments explain a reason why we concentrate on the spectral domain energy rather
than time domain energy as a frame energy-based approach in this study.
Next, we investigated two conventional VAD approaches (zero-crossing rate based method and frame energy based method). Both FRR and FAR tend to change according to the threshold that determines a speech and a non-speech region in a VAD process. Thus, we investigated the frequencies of false rejection and false alarm, while changing the threshold values.
[image:6.612.313.524.523.688.2]Table 4 summarizes the VAD performance of the proposed approach based on low frequency energy along with two conventional VAD methods. Each approach demonstrates different aspects in FR and FA according to threshold variation. To fairly compare the performance, we investigated the performance of
4310
Figure 9: Distribution of Spectral Domain Energy
FA when similar false rejection frequencies are indicated.
[image:7.612.91.296.94.256.2]As shown in this table, three VAD methods indicate similar FRR, but demonstrates different FAR performance. Energy-based approaches showed slightly better performance than the ZCR method. However, the methods indicated different performance in false alarm results in which the proposed approach achieved significant performance improvement superior to two conventional methods. This result explains that the proposed approach determines non-speech regions and disregards the regions efficiently, by concentrating on low frequency components that human voice preserves.
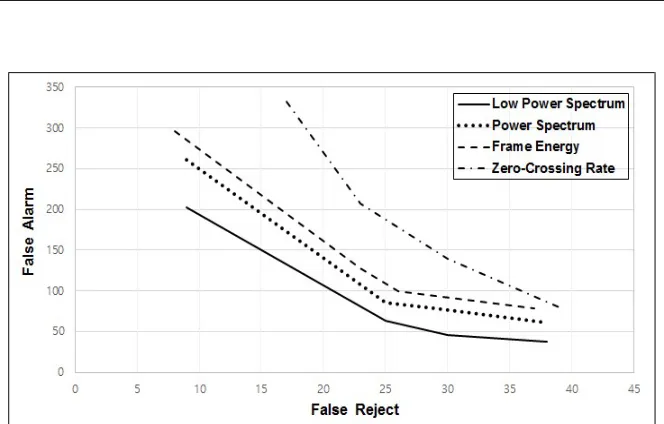
[image:7.612.94.518.337.438.2]Figure 10 represents another performance comparison indicating a definition error tradeoff (DET) curve. The DET curve represents false alarm frequencies upon false rejection frequencies.
Table 4: VAD Performance Comparison (Frequencies of FR and FA).
Threshold Zero-crossing rate (Time domain) Frame energy Low frequency energy (Spectral domain)
FR FA FR FA FR FA
Th1 17 332 8 296 9 202
Th2 23 207 23 127 25 63
Th3 30 139 26 100 30 46
[image:7.612.158.490.439.651.2]Th4 39 80 37 79 38 38
Figure 10: DET Curve for the Performance Comparison of VAD Approaches
A curve approximating the origin gives superior performance indicating low FAR and FRR. In this experiment, we compared four VAD
4311 the conventional time domain energy based approach (Frame energy), and the conventional zero-crossing rate based approach (Zero-crossing rate).
As shown in this figure, the proposed spectral energy based method showed better VAD performance, indicating lower FRR and FAR. Two energy based approaches (Power spectrum, Frame energy) achieved similar performances, but the power spectrum energy provided slightly better criterion for VAD. Zero-crossing rate showed the worst performance.
5. CONCLUSION
In this study, we proposed an efficient voice activity detection (VAD) to apply for real-time voice interface systems. The conventional VAD approaches are easy to implement, but tend to be vulnerable to environmental noises. The proposed approach concentrates on spectral energy of frequency regions in which human voice components exist. Spectral energy is estimated within a certain range of frequency bins for every frame and the value is used as a criterion to determine if the frame is a speech or a non-speech frame.
For validation of the proposed approach, we conducted several VAD experiments using real-time input speech signals. The proposed spectral energy-based method exhibited superior VAD performance compared to the conventional approaches.
6. DISCUSSION (FUTURE WORKS)
Even though the proposed approach was successfully verified using real-time speech data, further verification under noise environments is required to be employed for real-world voice interface applications in which various environmental noises contaminate the input speech signals. In future work, we will validate our method using various types of noises for further verification and then apply the method to a speech recognition task.
7. ACKNOWLEDGMENTS
This research was supported by Kyungpook National University Research Fund, 2014.
REFRENCES:
[1] Y. Moon, K. Kim, and D. Shin, “Voice of the internet of things: an exploration of multiple voice effects in smart homes”, Distributed, Ambient and Pervasive Interactions, Vol. 9749, 2016, pp. 270-278.
[2] A.A. Arriany and M.S. Musbah, “Applying voice recognition technology for smart home networks”, Proceedings of International Conference on Engineering & MIS (ICEMIS), 2016.
[3] J. Park, G. Jang, J. Kim, and S. Kim, “Acoustic interference cancellation for a voice-driven interface in smart TVs”, IEEE Transactions on Consumer Electronics, Vol. 59, 2013, pp. 244-249.
[4] M.H. Cohen, J.P. Giangola, and J. Balogh, Voice user interface design, Addison-Wesley Professional, 2004.
[5] L.R. Rabiner, and B. H. Juang, Fundamentals of speech recognition, 1993.
[6] S. Yiming, and W. Rui, “Voice activity detection based on the improved dual-threshold method”, Proceedings of IEEE International Conference on Intelligent Transportation in Big Data and Smart City (ICITBS), 2015, pp. 996-999.
[7] X. Yang, B. Tan, J. Ding, J. Zhang, and J. Gong, “Comparative study on voice activity detection algorithm”, Proceedings of IEEE International Conference in Electrical and Control Engineering, 2010, pp. 59-602. [8] J. Ramirez, J.M. Górriz, and J.C. Segura,
“Voice activity detection. fundamentals and speech recognition system robustness”, Robust Speech Recognition and Understanding, 2007. [9] M.H. Moattar, and M.M. Homayounpour, “A
simple but efficient real-time voice activity detection algorithm”, Proceedings of IEEE European Signal Processing Conference, 2009. [10] J.S. Choi, “A detection method of
speech/non-speech sections using scale of cepstrum distance”, Proceedings of KIIT Conference, 2012, pp. 489-492.
4312 [12] Y.K. Lau, and C.K. Chan, “Speech recognition
based on zero crossing rate and energy”, IEEE Transactions on Acoustics, Speech, and Signal Processing, Vol. 33, 1985, pp. 320-323. [13] L.R. Rabiner, and M.R. Sambur, “An
algorithm for determining the endpoints of isolated utterance”, Bell System Technical Journal, Vol. 54, 1975, pp. 297-315.