http://dx.doi.org/10.4236/aces.2014.43036
How to cite this paper: Shahzad, K., Saleem, M., Ghauri, M., Khan, W.A. and Akhtar, N.A. (2014) Modeling and Analysis of SO2 Emissions under Fast Fluidized Bed Conditions Using One Dimensional Model. Advances in Chemical Engineering and Science, 4, 327-338. http://dx.doi.org/10.4236/aces.2014.43036
Modeling and Analysis of SO
2
Emissions
under Fast Fluidized Bed Conditions Using
One Dimensional Model
Khurram Shahzad
1*, Mahmood Saleem
2, Moinuddin Ghauri
3, Waqar Ali Khan
4,
Niaz Ahmed Akhtar
21Centre for Coal Technology, University of the Punjab, Lahore, Pakistan
2Institute of Chemical Engineering & Technology, University of the Punjab, Lahore, Pakistan 3Department of Chemical Engineering, Comsats Institute of IT, Lahore, Pakistan
4NFC-IEFR, Faisalabad, Pakistan
Email: *[email protected]
Received 2 May 2014; revised 2 June 2014; accepted 30 June 2014
Copyright © 2014 by authors and Scientific Research Publishing Inc.
This work is licensed under the Creative Commons Attribution International License (CC BY).
http://creativecommons.org/licenses/by/4.0/
Abstract
Fluidized bed combustion behavior of coal and biomass is of practical interest due to its significant involvement in heating systems and power plant operations. This combustion behavior has been studied by many experimental techniques along with different kinetic models. In this study, SO2 emissions have been studied out in a pilot scale test facility of Circulating Fluidized Bed combustor (70 KW) under fast fluidized bed conditions burning coal with Pakistani wheat straw. One dimen- sional Mathematical model is being developed to predict the SO2 emissions under different oper- ating conditions like bed temperature, Ca/S molar ratio, solids circulation rate, excess air ratio and secondary to primary air ratio. These parameters are varied to validate the model and en- couraging correlation is found between the experimental values and model predictions.
Keywords
Fast Fluidization, Emissions, Modelling
1. Introduction
Biomass as an alternative energy source is getting a lot of attention due to the environmental and cost benefits. Globally, attention has been diverted for the replacement of fossil fuels with biomass. In UK, utilization of the
fossil fuels will be replaced with renewables by 10% up to 2010 and 20% up to 2020 [1]. CO2 and SO2 emis-
sions from coal fired power plants can effectively be reduced by co-firing the CO2 neutral fuels with coal. About
534.23 million tons of wheat straw is produced worldwide in 2011 [2]. A major portion of the wheat stubble is burned in the field which causes significant environmental and health problems [3]. Reduced SO2 emissions
have been reported during the combustion of coal and Pakistani wheat straw under fast fluidized bed conditions [4]. About 1200 circulating fluidized bed combustion (CFBC) plants with installed capacity of 65 GWth are in
operation worldwide [5]. Along with reduction of CO2, biomass also reduces NOx, SO2 and CO emissions in co-
combustion with coal [6]-[8]. Gaseous emissions from co-firing have also being reported as the function of op- erating conditions [4] [9].
The objective of the present study is to model the CFB rig for the estimation of SO2 emissions under different oper-
ating conditions and compare the model values to the experimental values. The values of bed temperature, Ca/S molar ratio, solids circulation rate, excess air ratio and secondary to primary air were varied to validate the model.
Hannes classified the different types of model based on complexity as global models, one dimensional model, multi-dimensional model (computational fluid dynamics) and scaling and expert systems [10]. Hartleben intro-duced the first model for atmospheric and pressurized circulating fluidized beds in which an empirical approach was used for the fluid dynamics and particle size distribution [11]. One dimensional model based on different blocks was also developed for a boiler at Tsinghua University, China [12]. Another dynamic model was devel-oped for the multi solid fluidization in CFB to predict the temperature along the height [13] [14]. Basu intro-duced a new generalized model with sensitivity analysis based on two zones vertically to find the temperature, sulphur capture and NOx formation [15]-[17]. Different models had been developed to estimate the
concentra-tions of CO, CO2, and NOx[18] and to calculate the oxygen concentration, carbon fraction and char size
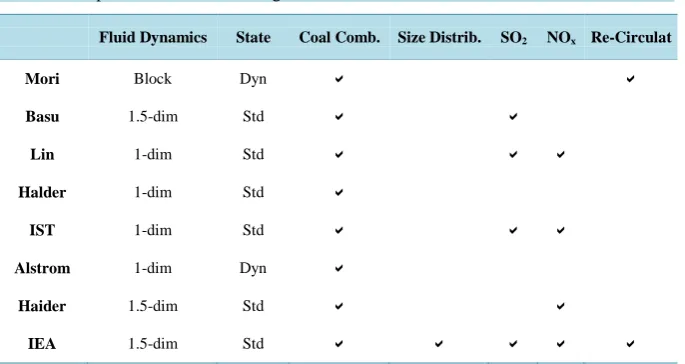
distri-bution [19]. Another detail modelling was done to calculate the char combustion, temperature distribution, pol-lutant formation and heat transfer [20]. Haider developed a detailed CFBC model to cover the cyclone and ex-ternal heat exchanger performance along with fluid dynamics and chemistry of the reactions involved [21] [22]. In Table 1, an overview of some models from the literature is being summarized.
Hannes developed a very detail and comprehensive model for the coal combustion in CFB boiler [10] [23] [24]. In this model, sub models were developed for each calculation and then recalled into main program. Sub models covered the fluidization pattern of solid flow, development of the particle size distribution, gas flow, coal conversion reactions, homogeneous and heterogeneous gas reactions and heat transfer mechanisms.
2. Material and Methods
2.1. Experimental Setup
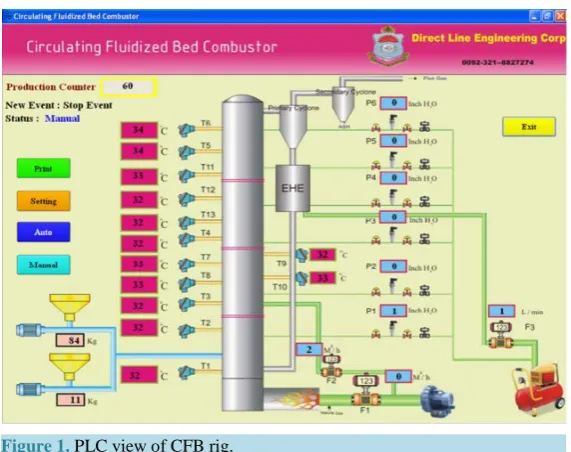
[image:2.595.129.472.526.708.2]CFB combustor used in this investigation is shown in Figure 1. The system comprised of a riser of 0.152 m i.d. and 6.2 m height, two high efficiency cyclones in series, an external heat exchanger (EHE) and an L-valve. The
Table 1. Comparison of some models given in literature.
Fluid Dynamics State Coal Comb. Size Distrib. SO2 NOx Re-Circulat
Mori Block Dyn
Basu 1.5-dim Std
Lin 1-dim Std
Halder 1-dim Std
IST 1-dim Std
Alstrom 1-dim Dyn
Haider 1.5-dim Std
IEA 1.5-dim Std
Figure 1. PLC view of CFB rig.
coal and wheat straw were supplied from gravimetric hoppers with screw feeders coupled with variable speed motors. More detail regarding the experimental setup and operation can be seen elsewhere [4]. Silica sand, hav- ing sauter mean diameter (SMD) of 125 µm and particle density of 2500 kg/m3 is used as the circulating bed material. Wheat straw (SMD = 0.85 mm) and Pakistani subbituminous coal (SMD = 0.49 mm) are used as the fuel in this study. Analyses and heating values of the feed materials are given in Table 2. Reported values are the mean of three values taken as per ASTM standards. The concentrations of SO2, NOx and CO in flue gas are
measured by on line gas analyzers. Dry flue gas is also sampled in Teflon bags to analyze in gas chromatograph, Perkin Elmer Auto system GC Arnel. All reported values are corrected to 6% O2 in the flue gas. Limestone
(98.8% CaCO3, SMD= 129 µm and ρ = 2730 kg/m3) is also added as the sulfur capture sorbent through feeder.
Coal combustion model developed by Hannes [10] was used as a base model in this study. Effect of bed tem- perature, Ca/S molar ratio, solids circulation rate and secondary to primary air ratio, on the sulphur retention was predicted from the mathematical model at different blend ratios. Model results have been compared with the experimental results to see the reliability and synergy effect.
2.2. Modelling Approach
All main reactions were assumed to take place in the riser as in the return leg, temperature dropped and the availability of oxygen was small. For the use of matrix solver, it was reasonable to continue the annular phase into the dense bed, so that bed and freeboard could be solve together and continuously. The lateral mixing be- tween core and annulus in the dense bed region was set high enough to equalize both phases to a common dense bed. All balances were setup by setting the time dependent term to zero to achieve steady state conditions. The gas flows were split using the values from the pre-calculations of the bubble holdup and the annulus width. The gas flow was balanced as molar flow. Changes caused by reactions which were not equimolar were assumed to have no influence on fluidization. The balanced flows were the convective flow in each phase (cor, ann, bub), cross flows from core to annulus (cor-ann), core to bubble (cor-bub) and vice versa, and mixing flows between the phases (corannx, corbubx).
2.3. Mass and Energy Balances
For mass balance, gaseous flows were balanced based on the following differential equation:
source exchange d
d
g g
g
n n
u
t z
∂
= + Ψ + Ψ
∂ (1)
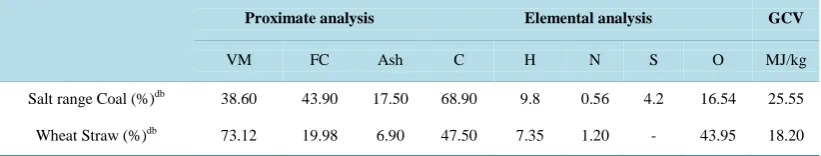
Table 2. Analysis of coal and wheat straw.
Proximate analysis Elemental analysis GCV
VM FC Ash C H N S O MJ/kg
Salt range Coal (%)db 38.60 43.90 17.50 68.90 9.8 0.56 4.2 16.54 25.55
Wheat Straw (%)db 73.12 19.98 6.90 47.50 7.35 1.20 - 43.95 18.20
db = dry basis.
of the different materials (m), (coal, limestone, sand and ash) were balanced separately for each cell (L). The following differential equation was discretized for each phase (cr, anl) considering size, materials and location (cell) of the solids.
,source
d d
d d
s s
s s
m m
u
t = z + Ψ (2)
In the lowest cell of the riser, all annular material had to be returned to the core to conserve the mass balance. Reactive species such as CaO and the combustibles in the coal were modelled as solid fractions. For better system solubility, the mass flow of the particles was kept constant, only the species fractions might vary. The fluidization pattern and char holdup was assumed not to be influenced by these changes. Coal mass was treated as virtual fraction, it did not influence the flow pattern but delivered the source terms for evaporated water and released volatiles. Only the ash residue in the char was balanced in the size distribution calculation. The fixed carbon was treated as ash load. The fraction balance was based on the following equation:
(
)
(
)
,source d
d
s s
s s s
m x m x
u kM x
t z
∂
+ Ψ +
⋅ =
∂ ⋅
(3)
Where the last term represents the release or reaction influence. “k” is a release or reaction constant depend- ing on local gas concentrations and temperature. Drying and devolatilization are time dependent processes. The time dependent fraction was determined and averaged for each cell (L) and class (i) as under:
( )
0(
, ,)
, d
avg
x i L t
x i L t
t
τ∂
= ∂
∫
(4)All these equations were written as first order equations for concentrations. The solution of the concentration equations is done analogue to the enthalpy balances.
The enthalpy balance delivered the average cell temperature. Enthalpy balance was based on the convective flows of gas and solids, changes in formation enthalpies due to reactions and the heat transfer to the walls. Fol- lowing differential equation was used for the energy balance.
(
)
(
)
reac heatexchd d
d d
g pg s ps g g pg s s ps
T T
n C m C u n C u m C Q
t z
+ = + + Ψ + (5)
The total balance system was consisted of the first order and solved through the matrix mechanism by ar- ranging core and annular cells in the form of arrays. More detail about the sequence of calculations can be seen elsewhere [10].
2.4. Sulphation Model
Lime stone is added into the CFB combustor to capture SO2 directly. It is very tough to model the self-desul-
phurization of the coal, done by the mineral and metallic fractions in coal. The self-desulphurization of the coal is not explicitly modelled, however it can be taken into account by reducing the sulphur content in the coal by the amount of available calcium [25]. The capture of sulphur with limestone particles undergoes three principle reaction steps which are as follows:
1) calcination:
3 2
2) oxidation:
2 2 3
SO +1 2 O →SO (7)
3) sulphation:
3 4
CaO SO+ →CaSO (8)
Overall reaction can be written as under:
3 2 2 4 2
CaCO +1 2 O +SO →CaSO +CO (9)
Thus, the sulphur capture capability strongly depends on the residence time, the fragmentation behaviour, and the pore structure of the sorbent. Calcium-sulphur compounds do not only exist as CaSO4 but may also exist as
CaS, depending upon oxidizing or reducing boundary conditions, respectively. Since in fluidized beds the resi- dence times of the particles are high and the sulphation reaction is slow, particle tracking is nearly impossible to distinguish in reducing and oxidizing zones as they mix within short times. Therefore, only the oxidizing condi- tions are considered in the following model.
During the calcination, the equilibrium between CaCO3 and CaO is dependent on the partial pressure of CO2
in the surrounding gas, and on temperature. Baker [26] stated, that this equilibrium pressure can be written as:
( )
72.eq
19124
pCO 1.2 10 exp K bar
T
= × −
(10)
For a given partial pressure of CO2, calcination will only take place above the corresponding temperature.
Dennis and Fieldes [27] have calculated the calcination time tcalc by:
(
3)
2
.0 CaCO
0 pCO2.eq pCO2 pXCO
p calc
R M t
k =
− − (11)
With k0 = 207 (mol/bar⋅m 2⋅
s) and an empirical variable describing a constant molar fraction of CO2 which is
0.065 at 825˚C, 0.1 at 875˚C and 0.17 at 925˚C.
For a kinetically controlled shrinking-core model, Kunii and Levenspiel [28] correlate the calcination time with the core radius and the conversion degree as:
(
)
0.33 ,01 core 1 1
calc
calc p
R t
x
t = − R = − − (12)
The combination with residence time of the particles is done with a residence time distribution:
( )
1exp t
E t
τ
τ
= −
(13)
Where the average residence time is the quotient of limestone mass in the furnace and limestone feed flow. The average calcination degree is
3
0
exp
1 calc tcalc 1 d
calc
t t
x t
t t
τ −
− = −
∫
(14)On integration
2 3
3 6 6 1 exp calc
calc
calc calc calc
t x
t t t
τ τ τ
τ
= − + − −
(15)
During calcination, the released CO2 leaves the limestone with No. of pores which increases the inner surface
Gas-solid reaction model, describing the reactions taking place at the individual particles is combined with the hydrodynamic model delivering the particle flow rates and concentrations. This model has differentials in time and radius, which are to be solved properly. So Wolff approach is implemented into the sulphation model, based on an analytical way to solve the radius dependent integral, so that only a forward integration in time remains [30]. The basic balance is the deliverance of the reactants by diffusion and the reaction at the surface of the un- reacted core [23]:
3 2
2 3 3
SO 2
sulf SO
SO SO SO
d d
4π 4π
d d
C C
r r k c
r r
D D
⋅ + ⋅ = ⋅ ⋅
(16)
Where the equilibrium between SO2 and SO3 can be expressed by:
3 2 2
3
SO 0 SO O 0
m with 0.154
mol
c =K ⋅c c K = (17)
The reaction rate at the core surface can be stated as [10]:
2 2
2 CaO
sulf 0 O SO
d
4π
d r
n
k r K c C
t = − ⋅γ ⋅ ⋅ ⋅ ⋅ (18)
Equation (18) can be solved as follows:
2 3 3 O lime 3 CaO CaCO CaCO 4 π 3 calc C
n r x x
M
ρ
= ⋅ ⋅ ⋅ (19)
Integration over the reacted shell and the gas film leads to the concentration of SO2 on the core surface de-
pendent on the bulk SO2 concentration.
(
)
2 2 2 SO , SO 20 O sulf film shell 1
R r
C C
K C k r f f
δ +
=
+ + (20)
Substitution back into Equation (16) and rewriting yields:
(
)
(
)
(
)
2 3 3 2 SO , lime CaCO CaCO 2 film shell 0 O d 1 d R calc s C x x M r tr f D f D
k k C
δ
γ⋅ ρ +
⋅ ⋅
=
+ +
⋅ ⋅
(21)
From the integration of left side of Equation (16) over the gas shell and over the reacted shell, the diffusion functions ffilm and fshell can be derived [25], which are:
3
2 2
film
SO ,film SO fil, m 0 O
1 1 1
f
R R
D +D K C δ
= −
+
(22)
2, 3, 2
shell
SO shell SO shell 0 O
1 1 1
f
r R
D +D K C
= −
(23)
The conversion 𝛼𝛼lime can be understood as reacted volume fraction of the particle
( )
3( )
lime 1 3
r t t
R
α = − (24)
Averaged conversion is approached with a residence time distribution function [24],
( ) ( )
( )
lime 0 lime
1
d where exp t
t E t t E t
α
α
τ
τ
∞
= ⋅ = ⋅ −
∫
(25)(
)
(
)
(
)
(
)
2 1
3 3
2 lime 3 lime 4 3
lime 1
1 1
1 1
3 C C C C
f α τC α α
− −
= − + − + −
(26)
With values of C1, C2, C3 and C4 as
2 2 3 3 SO , 1 2
lime sulf 0 O
CaCO CaCO , R calc C R C C
k K C
x x
M
δ
γ ρ +
= =
2 3
3 4
SO ,shell SO ,film
1 1
,
x x
R R
C C
D D R R δ
= = −
+
Final integration of Equation (26) is,
(
)
(
)
(
)
lime ,max 1 2
3 4 3
3 3
2 lime lime lime
lime 1
0
1 1
1 1 1 1
2 3
C C C
C
f C
α
α α α
α τ − = − − + − − +
∫
(27)This equation is replaced with residence time distribution function and numerically integrated using a mod-ified Euler method. The function has as very steep gradient for very small values of αlime and flattens with in-creasing values.
The diffusion coefficients consist of the Knudsen diffusion effects in the pores and the diffusion of a binary mixture of gases [21].
In the gas film, only binary diffusion occurs [22], so it can be assumed that SO , film mix x
D = D . In the shell, i.e.
in the pores, Knudsen and gas diffusion must be considered [23]:
lime pore
SO ,shell pore
tort knud mix
1 1 x V D D D D ρ τ = = ⋅ + ⋅
(28)
The calculation of the thickness of the gas film layer δ is estimated by the mass transport coefficient
2 SO k [14]: 2 2 ,film ,shell SO 1 1 SO k D R
δ
= + (29) where 2 0.5 0.66SO , 0.81
g
p g
St u
k St Re Sc
ε − −
⋅
= = ⋅ ⋅
mix
,
g g g p
p g g u d Sc Re D µ ρ ρ µ ⋅ ⋅ = = ⋅
So the reaction rates and concentrations were calculated and following parameters were used in the model,
K0 = 0.154 (SO4/SO3 equilibrium constant) [35];
τtort = 3 (tortuosity factor) [32];
αmax = 0.5 (maximum conversion degree) [28];
ksulf = 0.15 (sulphation constant m/s) [32].
Since the residence time of limestone particles and their sulphation takes place over hours, while gas resi- dence time is in seconds, the sorbent is balanced as a homogenous phase. This is done by considering fragmen- tation and attrition of the sorbent which enlarges the available reactive surface. The conversion rate is calculated with an averaged SO2 bulk concentration. The gas reaction is calculated depending on local holdup of sorbent in
the riser. Weighing the local SO2 concentrations with the local hold-up of sorbent provides the average gas con-
centration for the calculation to determine the conversion of the sorbent. The steady state sorbent conversion and gas concentration is established during the overall mass balance in the program.
3. Results and Discussions
Typical results obtained through the model and experimental studies are shown from Figures 2-6. There is a good agreement between the model predictions and the experimental results in accordance with the synergy ef- fects of coal and biomass combustion, on emissions of SO2. Model was run with a series of input values but re-
ported values are, for bed temperature, excess air factor, secondary to primary air ratio, solid circulation rate and Ca/S molar ratio, for 5%, 10% and 20% blends of wheat straw with coal on weight basis.
It was believed that an increase in bed temperature can accelerate the calcination reaction resulting in low SO2
concentration. High bed temperature also resulted in low CO concentrations which adversely affect the decom- positions reactions of CaSO4. Model predictions were in agreement when compared to the experimental values
for different bed temperatures as shown in Figure 2. At higher temperature, higher conversion of lime stone and higher reaction rates of sulphation reactions were depicted in model as experimentally found to be happening in the furnace.
Agreement between model predictions and experimental results were found to be very encouraging for the effect of Ca/S molar ration on SO2 emission as shown in Figure 3. Predicted values are more close to the ex-
[image:8.595.175.425.310.475.2]perimental values for Ca/S molar ratios of 2 compared to that of 3. Model was also producing the reliable values at low wheat straw ratio in coal. Deviation at high wheat straw ratio in coal blend might be due to the different devolatilization kinetics of biomass compared to the coal.
Figure 2. Bed temperature vs. SO2 concentration, experimental results and model predictions.
Figure 3. Ca/S molar ratio vs. SO2 concentration, experimental results and model predictions.
250 300 350 400 450 500 550 600
0 5 10 15 20 25
SO
2
c
onc
e
nt
ra
ti
on (
ppm
)
Feed wheat st r aw r at i o ( wt . % ) Bed temperature 800°C Bed temperature 800°C, model Bed temperature 920°C Bed temperature 920°C, model
100 150 200 250 300 350 400 450 500
0 5 10 15 20 25
S
O2
co
n
cen
tr
at
io
n
(
p
p
m
)
[image:8.595.172.424.512.694.2]Figure 4. Excess air factor vs. SO2 concentration, experimental results and model predictions.
Figure 5. Solids circulation rate vs. SO2 concentration, experimental results and model predictions.
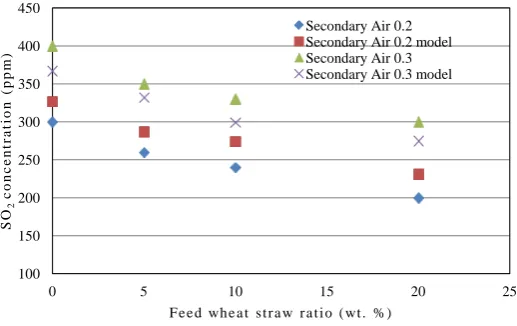
Figure 6. Secondary air to primary air ratio vs. SO2 concentration, ex-perimental results and model predictions.
150 200 250 300 350 400 450 500 550 600
0 5 10 15 20 25
SO
2
co
n
cen
tr
at
io
n
(
p
p
m
)
Feed wheat straw ratio (wt. %)
Excess Air Factor 1.10 Excess Air Factor 1.10, model Excess Air Factor 1.20 Excess Air Factor 1.20, model
100 150 200 250 300 350 400 450 500 550 600
0 5 10 15 20 25
SO
2
c
onc
e
nt
ra
ti
on (
ppm
)
Feed wheat straw ratio (wt. %) Solid circulation rate 11.42 kg/m².s
Solid circulation rate 11.42 kg/m².s, model Solid circulation rate 22.86 kg/m².s Solid circulation rate 22.86 kg/m².s, model
100 150 200 250 300 350 400 450
0 5 10 15 20 25
S
O2
co
n
cen
tr
at
io
n
(
p
p
m
)
[image:9.595.187.439.315.492.2] [image:9.595.184.443.532.695.2]Effect of variation of excess air factor on the SO2 emission, predicted by the model is shown inFigure 4.
Model has shown the correct tendencies for different values of excess air factor at different blends of wheat straw with coal on weight basis, although the model predictions were very slightly higher than the experimental ones. As incorporated in the model, increased concentrations of oxygen would facilitate the sulphation reaction, resulting in low SO2 emission. With an excess air factor of 1.20, reaction rate of sulphation increased due to
higher oxygen concentration in the riser. Based on the same scenario, SO2 emission deceased in the actual ex-
perimental work.
Experimental and model results related to the effect of solids circulation rate on SO2 emissions have been
compared and reported in Figure 5. Model predictions have given the good relation in response to the variation in solid circulation rate, however minor deviations were also observed. At the value of 22.86 kg/m2∙s, the error was small and model has given the good predictions especially at higher wheat straw ratio.
In Figure 6, model predictions of effect of secondary to primary air ratio on SO2 emission have been com-
pared with the experimental results. As clear from the results, model was unable to produce good correlation for the variation in secondary to primary air ratio for the SO2 emission. Model predictions have given a positive er-
ror for lower secondary to primary air ratio while a negative error was observed for the higher values of second- dary to primary air ratio. This might be due to the complex hydrodynamics inside the riser produced after the secondary air injection which could not be accounted in the present correlations used for the hydrodynamic modelling of the riser. As by the injection of secondary air, temperature of that region will be low and more oxi- dizing conditions would be made available making a precarious region regarding the model. Especially variation in the secondary to primary air ratio produced the undesired effect on the hydrodynamics of the riser that ulti- mately affected the SO2 concentration.
4. Conclusion
A fluidized bed model for the steady state combustion and sulphation in a CFB was used to predict the SO2 con-
centrations in the exit flue gases. It was based on the shrinking core model. Agreement between model predic- tion and experimental results was found encouraging for the parameters like bed temperature, fluidizing air ve- locity, excess air ratio and solids circulation rate. However for secondary to primary air ratio, some short com- ings in the model were observed.
Acknowledgements
Authors wish to thank the Higher Education Commission of Pakistan for their financial support to this project. (Project No. 1380-HEC).
References
[1] Mitchell, C. and Connor, P. (2004) Renewable Energy Policy in the UK 1990-2003. Energy Policy, 32, 1935-1947.
http://dx.doi.org/10.1016/j.enpol.2004.03.016
[2] Zhang, Y.N., Ghaly, A.E. and Li, B.X. (2012) Physical Properties of Wheat Straw Varieties Cultivated under Different Climatic and Soil Conditions in Three Continents. American Journal of Engineering and Applied Sciences, 5, 98-106.
http://dx.doi.org/10.3844/ajeassp.2012.98.106
[3] Yang, S., He, H., Lu, S., Chen, D. and Zhu, J. (2008) Quantification of Crop Residue Burning in the Field and Its In- fluence on Ambient Air Quality in Suqian, China. Atmospheric Environment, 42, 1961-1969.
http://dx.doi.org/10.1016/j.atmosenv.2007.12.007
[4] Khurram, S., Mahmood, S., Waqar, A.K., Najaf, A. and Niaz, A.A. (2012) Parametric Study of NOx Emissions in Cir- culating Fluidized Bed Combustor. Journal of Pakistan Institute of Chemical Engineers, 40, 61-68.
[5] McMullan, J. (2004) Fossil Fuel Power Generation. State-of-the-Art. Technical Report. Power Clean Thematic Net-work, Coleraine.
[6] Armesto, L., Boerrigter, H., Bahillo, A. and Otero, J. (2003) N2O emissions from Fluidised Bed Combustion. The Ef- fect of Fuel Characteristics and Operating Conditions [Small Star, Filled]. Fuel, 82, 1845-1850.
http://dx.doi.org/10.1016/S0016-2361(03)00169-8
[7] Youssef, M.A., Wahid, S.S., Mohamed, M.A. and Askalany, A.A. (2009) Experimental Study on Egyptian Biomass Combustion in Circulating Fluidized Bed. Applied Energy, 86, 2644-2650.
[8] Sathitruangsak, P., Madhiyanon, T. and Soponronnarit, S. (2009) Rice Husk Co-Firing with Coal in a Short-Combus- tion-Chamber Fluidized-Bed Combustor (SFBC). Fuel, 88, 1394-1402. http://dx.doi.org/10.1016/j.fuel.2008.11.008
[9] Madhiyanon, T., Sathitruangsak, P. and Soponronnarit, S. (2009) Co-Combustion of Rice Husk with Coal in a Cyclon-ic Fluidized-Bed Combustor ([psi]-FBC). Fuel, 88, 132-138. http://dx.doi.org/10.1016/j.fuel.2008.08.008
[10] Hannes, J.P., Svoboda, K. and van den Bleek, C.M. (1995) The IEA Model for Circulating Fluidized Bed Combustion. 13th International Conference on Fluidized Bed Combustion, Orlando, 287-296.
[11] Hartleben, B. (1983) Mathematische modellierung von blasenbildenden kohlewirbelschicht-feuerungsanlagen. Ph.D. Thesis, Siegen University, Siegen.
[12] Zhang, W., Tung, Y. and Johnsson, F. (1991) Radial Voidage Profiles in Fast Fluidized Beds of Different Diameters.
Chemical Engineering Science, 46, 3045-3052. http://dx.doi.org/10.1016/0009-2509(91)85008-L
[13] Mori, S., Narukawa, K., Yamada, I. and Tanii, H. (1991) Dynamic Model of a Circulating Fluidized Bed Coal Fired Boiler. 11th International Conference on Fluidized Bed Combustion, Montreal, 21-24 April 1991, 1261-1265.
[14] Mori, S. and Wen, C.Y. (1975) Estimation of Bubble Diameter in Gaseous Fluidized Beds. AlChE Journal, 21, 109- 115. http://dx.doi.org/10.1002/aic.690210114
[15] Sengupta, S.P. and Basu, P. (1991) A Generalized Mathematical Model for Circulating Fluidized Bed Boiler Furnace. 11th International Conference on Fluidized Bed Combustion, Montreal, 21-24 April 1991, 1295-1301.
[16] Talukdar, J., Basu, P. and Joos, E. (1993) Sensitivity Analysis of a Performance Predictive Model of Circulating Flui-dized Boiler Furnace. 4th International Conference on Circulating Fluidized Beds, Somerset,1-5 August 1993, 541- 546.
[17] Xu, X. and Mao, J. (1993) Mathematical Model and Simulation of Circulating Fluidized Bed Boilers. 4th International Conference on Circulating Fluidized Beds, Somerset,1-5 August 1993, 104-109.
[18] Lin, X. and Li, Y. (1993) A Two Phase Model for Fast Fluidized Bed Combustion. 4th International Conference on Circulating Fluidized Beds, Somerset,1-5 August 1993, 547-552.
[19] Halder, P.K. and Datta, A. (1993) Modelling of Combustion of a Char in a Circulating Fluidized Bed.4th International Conference on Circulating Fluidized Beds, Somerset,1-5 August 1993, 92-97.
[20] Saraiva, P.C., Azevedo, J.L.T. and Carvalho, M.G. (1993) Modelling the Flow, Combustion and Pollutants Emission in a Semi Industrial CAFBC. 4th International Conference on Circulating Fluidized Beds, Somerset,1-5 August 1993, 72-79. [21] Haider, A. and Levenspiel, O. (1989) Drag Coefficient and Terminal Velocity of Spherical and Nonspherical Particles.
Powder Technology, 58, 63-70.http://dx.doi.org/10.1016/0032-5910(89)80008-7
[22] Hiller, R. (1995) Mathematische modellierung der kohleverbrennung in einer circofluid wirbelschichtfeuerung. Ph.D. Thesis, Dortmund University, Dortmund.
[23] Hannes, J.P., Svoboda, K. and van den Bleek, C.M. (1993) Mathematical Modelling of CFBC: An Overall Modular Programming Frame Using a 1.5-Dimensional Riser Model. 12th International Conference on Fluidized Bed Combus-tion, San Diegi,9-13 May 1993, 455-463.
[24] Hannes, J.P., Svoboda, K. and van den Bleek, C.M. (1993) Modelling of Size Distribution and Pressure Profiles in a CFBC. 4th International Conference on Circulating Fluidized Beds, Somerset,1-5 August 1993, 199-204.
[25] Hannes, J.P. (1996) Mathematical Modelling of Circulating Fluidized Bed Combustion. Ph.D. Thesis, Technical Uni-versity Delft, Delft.
[26] Baker, E.H. (1962) The Calcium Oxide-Calcium Dioxide System in the Pressure Range 1 - 300 Atmospheres. Journal of Chemical Society, 165, 464-470.http://dx.doi.org/10.1039/jr9620000464
[27] Dennis, J.S. and Fieldes, R.B. (1986) Simplified Model for the Rate of Sulphation of Limestone Particles. Chemical Engineering Research and Design, 64, 279-287.
[28] Kunii, D. and Levenspiel, O. (1991) Fluidization Engineering. 2nd Edition, Butterworth-Heinemann, Boston.
[29] Korbee, R. (1995) Regenerative Desulphurization in an Interconnected Fluidized Bed System. Ph.D. Thesis, Technical University Delft, Delft.
[30] Wolff, E.H.P. (1991) Regenerative Sulphur Capture in Fluidized Bed Combustion of Coal. Ph.D. Thesis, Technical University Delft, Delft.
[31] Hartman, M. and Trnka, O. (1993) Reactions between Calcium-Oxide and Flue Gas Containing Sulfur-Dioxide at Lower Temperatures. AIChE Journal, 39, 615-624.http://dx.doi.org/10.1002/aic.690390410
[32] Dam, J. and Ostergarrd, K. (1991) High Temperature Reaction between Sulphur Dioxide and Limestone in Two Reac-tors. Chemical Engineering Science, 46, 822-831.
[33] Hartman, M., Svoboda, K., Trnka, O. and Vesely, V. (1999) Removal of Sulphur from Hot Coal Gas. Chemicke Listy,
[34] Hartman, M., Svoboda, K., Trnka, O. and Vesely, V. (1988) Reaction of Sulfur-Dioxide with Magnesia in a Fluidized- Bed. Chemical Engineering Science, 43, 2045-2050.http://dx.doi.org/10.1016/0009-2509(88)87082-9
currently publishing more than 200 open access, online, peer-reviewed journals covering a wide range of academic disciplines. SCIRP serves the worldwide academic communities and contributes to the progress and application of science with its publication.
Other selected journals from SCIRP are listed as below. Submit your manuscript to us via either