© 2017, IRJET | Impact Factor value: 5.181 | ISO 9001:2008 Certified Journal | Page 839
Comparision of Energy Efficient WSN in Coverage and Connectivity
Bhumika Ingole
1, Arpita Chirde
21,2
Electronics & Communication Department, Tulsiramji Gaikwad Patil College of Engineering,
Nagpur, Maharashtra, India
---***---Abstract -
Wireless Sensor network (WSN) comprises of tiny sensor nodes with very limited initial energy and are deployed in sensing area of particular interest to fetch necessary environment data and sending it back to end user via base station. One of the major issue in WSN is energy efficient coverage in which major goal of routing protocol is to observe every possible physical space without any loss of data due to lack of energy or power in sensor node. Such situation may occur due to over burden on nodes when unbalanced clusters are formed leading to extra communication overhead. In this Paper we are discussing the comparison of LEACH & SEP protocols in terms of Packet transmission, energy dissipation and number of Nodes alive and stability period and we will discuss the advantage and disadvantage of these protocols under various conditions.Key Words: Wireless Sensor Network, Coverage,
Clustering, Routing Protocol, Stability period,LEACH protocol, SEP protocol
1. INTRODUCTION
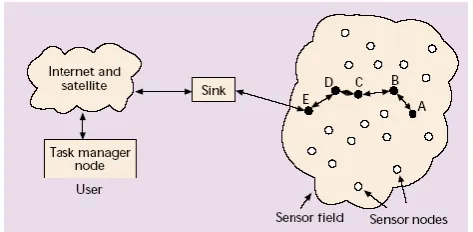
A wireless sensor network (WSN) consists of a collection of low power, low cost, and autonomous sensor nodes, which communicate among themselves through wireless link only. Each sensor node is facilitated with multiple power levels to transmit the data in wireless channel. Each sensor node runs mostly by battery power. The constraint imposed on WSN is due to less supply of energy A Wireless Sensor Network (WSN) is a collection of tiny sensor nodes which are interconnected by wireless communication channels. Each sensor node is a small device that can collect data from its surrounding area, carry out simple computations and communicate with other sensors or with the base station (BS).The nodes are deployed in a monitoring field as shown in the following Figure 1.1 [1] and each of them capture data and sends data back to the base station or sink. Data are routed back to the sink by following direct or multi-hop dedicated path. The base station may communicate with the task manager via Internet or satellite. The information flow in typical WSN is explained in Figure 1.1. The design of WSN is influenced by many factors such as initial energy, scalability, production costs, sensing environment, and network topology and power consumption of sensor nodes. Therefore designing wireless sensor network is a very challenging task when coverage along with network lifetime is considered. There exit a tradeoff between coverage and network lifetime because if we consider full
coverage then network lifetime get reduced and if we try to increase network lifetime then coverage gets reduced. The specified environment may be in the form of entire deployment area, specific points in the deployment area, or across certain region where there is some possibility of breach. Based on these above criteria, coverage is categorized into 3 types.
1) Area Coverage
2) Target Coverage
3) Barrier Coverage
• Area Coverage: It refers to observe the entire area. This means, every single point in the given field of interest must be coming under the sensing range of at least one active sensor node [2]. Ideally, the number of active sensor nodes are minimum even if the number of deployed sensor nodes are quite high.
• Target Coverage: In this case, the targets are represented as set of discrete points within the given field of interest and each target or point must be covered by at least one active sensor node[3], [4]. This type of coverage is basically used in military applications.
[image:1.595.315.552.570.686.2]• Barrier Coverage: It refers to observing the movement of mobile objects that enter into the boundary of a given field of interest or moving across the sensor field [5], [6]. Intrusion detection is an important application of barrier coverage.
Figure 1.1: Information flow in wireless sensor network
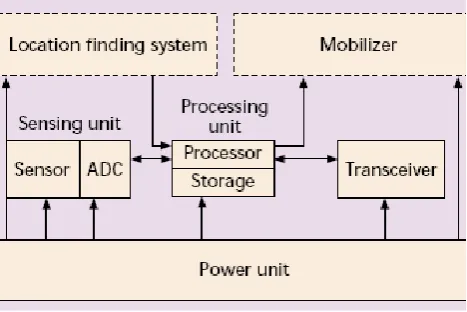
© 2017, IRJET | Impact Factor value: 5.181 | ISO 9001:2008 Certified Journal | Page 840 application dependent components such as a location
[image:2.595.44.278.133.289.2]finding system, power generator and mobilize.
Figure 1.2: The components of a wireless sensor node
Although many algorithms and protocols have been proposed for traditional wireless adhoc networks like MANET, they are not well suited for wireless sensor networks because of the following differences between wireless sensor networks and ad-hoc networks like MANET
1) The number of wireless sensor nodes in a typical WSN are much higher than the nodes in a simple ad-hoc network.
2) Sensor nodes are densely deployed and the rate of node failure is much higher mainly due to limited initial energy at the time of deployment.
3) The topology of a WSN changes very frequently for specific applications.
4) Sensor nodes mainly use a broadcast communication, whereas most adhoc networks are using point to point communications.
5) Wireless Sensor nodes are limited in energy, computation and storage memory.
6) Absence of unique and global identification (ID’s) because of the large amount of overhead and large number of nodes taking part in WSN resulting in inability to maintain database of sensor nodes.
2. REVIEW OF CLUSTERING ALGORITHMS FOR WIRELESS SENSOR NETWORK
2.1. LEACH (Low Energy Adaptive Clustering Hierarchy)
LEACH is one of the most popular clustering algorithms. The main idea behind leach is to form clusters based upon the signal strength of the sensors. Some of the nodes are
randomly chosen as the cluster heads (CH) and a node is assigned to the CH based upon the signal strength received by that node from the CH. CHs have to do a lot more work than the normal nodes, hence they dissipate a lot more energy and may die quickly. In order to maintain a stable network, CHs keep on rotating, in every round. So, a node which had become CH may not get an opportunity to become CH again before a set interval of time.
A node can become the cluster head for the current round if its value is less than the threshold T(n) where T(n) is given by –
P is the percentage of cluster heads, r is the rth round, G is the set of nodes which are not cluster heads in the last 1/P rounds.
Advantages:
LEACH is completely distributed.
LEACH does not require the control information from the base station, and the nodes do not require knowledge of the global network in order for LEACH to operate.
LEACH reduces communication energy by 8 times as compare to direct transmission and minimum transmission energy routing.
2.2. SEP (Stable Election Protocol)
SEP was an improvement over LEACH in the way that it took into account the heterogeneity of networks. In SEP, some of the high energy nodes are referred to as advanced nodes and the probability of advanced nodes to become CHs is more as compared to that of non-advanced nodes. Advantage:
SEP does not require any global knowledge of energy at every election round.
Limitations:
The drawback SEP method is that the election of the cluster heads among the two type of nodes is not dynamic, which results that the nodes that are far away from the powerful nodes will die first.
2.3. DEEC (Distributed Energy Efficient Clustering)
© 2017, IRJET | Impact Factor value: 5.181 | ISO 9001:2008 Certified Journal | Page 841 (advanced or normal) and the total initial energy in the
network Etotal.
The value of Total Energy is given as
Etotal = N. (1−m).Eo+N.m.Eo. (1+a) (1)
The average energy of rth round is set as follows E(r) = 1 Etotal (1 −R) (2) N
R denotes the total rounds of the network lifetime and is defined as
Etotal
R
Eround
(3)ERound is the total energy dissipated in the network during a round, is equal to:
ERound = L(2NEelec +NEDA + kEmpd4toBS+NEfsd2toCH)
k: number of clusters
EDA: data aggregation cost expended in the cluster heads
dtoBS: average distance between the cluster head and the base station
dtoCH: average distance between the cluster members and the cluster head.
Because we are assuming that the nodes are uniformly distributed, we can get:
/ 2
dtoCH
M
K
0.765
/ 2
dtoBS
M
Advantages:
DEEC does not require any global knowledge of energy at every election round.
Unlike SEP and LEACH DEEC can perform well in multi-level Heterogeneous wireless network.
Limitations:
Advanced nodes always penalize in the DEEC, particularly when their residual energy reduced and become in the range of the normal nodes. In this position, the advanced nodes die rapidly than the others.
3. ENERGY MODEL ANALYSIS
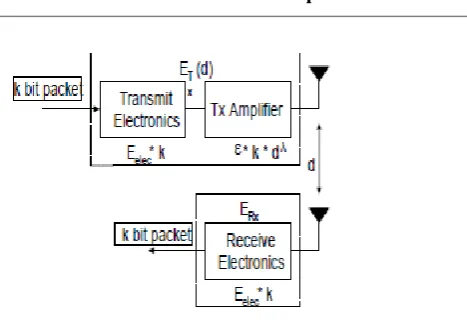
[image:3.595.320.554.75.239.2]In this paper, we are analysing three protocols – LEACH, SEP and DEEC-based on the energy dissipation model shown in the following figure –
Fig -1: Energy dissipation diagram
For a particular node, the energy is dissipated because of receiving and transmitting. The energy expanded in transmitter to transmit k-bit message is given by –
ET (k,d) = (Eelec * k) + (Efs*k*d2) if d<=d0
(Eelec * k) + (Emp*k*d4) if d>d0
Eelec is the energy dissipated to run the electronics circuits
k is the packet size
Efs and Emp are the characteristics of the transmitter amplifier
d is the distance between the two communicating ends
Energy dissipation to receive a k-bit message is given by- ER(k) = Eelec* k
The values of radio characteristics are – Eelec = 50 nJ/bit
Efs = 10 pJ/bit/m2 Emp = 0.0013pJ/bit/m4
In addition to above energy expansions, a CH also dissipates energy because of data aggregation. The data aggregation energy EDA has the value
of 5nJ/bit/signal.
4. Simulation Results
We have carried out a number of experiments and used them for the comparison of LEACH, SEP and DEEC for various performance metrics. Simulation results on MATLAB depict that DEEC has better stability period and less energy dissipation per round
.
A. Network Settings
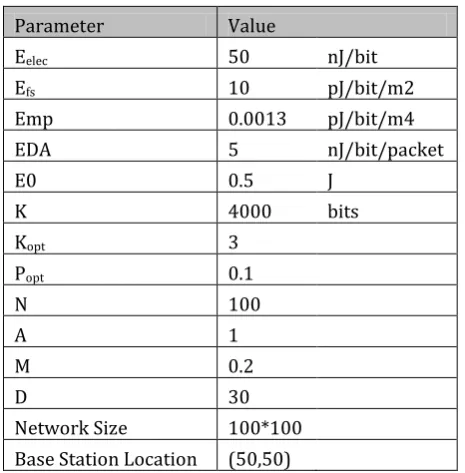
© 2017, IRJET | Impact Factor value: 5.181 | ISO 9001:2008 Certified Journal | Page 842 kept as 0.2, so the number of advanced nodes is 20. The
packet size is considered to be of 4000 bits. The various parameter values taken for experiments are shown in the following table –
Parameter Value
Eelec 50 nJ/bit
Efs 10 pJ/bit/m2
Emp 0.0013 pJ/bit/m4
EDA 5 nJ/bit/packet
E0 0.5 J
K 4000 bits
Kopt 3
Popt 0.1
N 100
A 1
M 0.2
D 30
Network Size 100*100 Base Station Location (50,50)
We have measured performance on the basis of following measurements:
(i) Stability Period is the period (or round) up to which all nodes are alive. This period lies between rounds 1 to the round at which the first node dies.
(ii) Instability period is the period between the first dead node and last dead node. This period should be kept as small as possible.
(iii) Energy dissipation
[image:4.595.46.279.155.392.2](iv) Different values of heterogeneity.
Figure 2: Number of Nodes alive Vs Number of rounds
From the figure 1 it is clear that the DEEC is more stable than the SEP and LEACH as the first node dead in DEEC after LEACH and SEP shows stability period of DEEC is prolong than the LEACH and SEP.
[image:4.595.320.550.482.673.2]Table 1.Comparision table for LEACH, SEP and DEEC
Figure 3: Energy dissipation diagram of LEACH, SEP and DEEC
Performance
Criteria LEACH SEP DEEC
Heterogeneity
level Not present Two Multilevel
Cluster Stability
Lower than SEP and
DEEC Moderate High
Energy Efficient
Low as Compare to
SEP & DEEC Moderate High
Cluster Head Selection
Criteria
Based on initial & Residual
Energy
Based on initial & Residual
Energy
Based on initial, Residual &
Average Energy of
Network
Network Lifetime
Lower than SEP and
DEEC Moderate
[image:4.595.41.294.537.749.2]© 2017, IRJET | Impact Factor value: 5.181 | ISO 9001:2008 Certified Journal | Page 843 Figure 4: Number of Data packets transmitted to base
station Vs. Number of rounds.
We can see from the figure 4 that the packets transferred to the base station are large in DEEC
as compare to SEP
and LEACH.
5. CONCLUSION
We had compared the LEACH SEP and DEEC protocol under various performances metric through simulation. The performance of the three protocols are judged under the various performance metric .Simulation results shows that DEEC outperforms the two .The table (1) shows the comparison of three protocols under various performance metrics.
REFERENCES
[1] M. Cardei and D.-Z. Du, “Improving Wireless Sensor Network Lifetime through Power Aware Organization”, ACM Wireless Networks, Vol. 11, No. 3, 2005.
[2] M. Cardei, D. Mac Callum, X. Cheng, M. Min, X. Jia, D. Li and D.- Z. Du, “Wireless Sensor Networks with Energy Efficient Organization”, Journal of Interconnection Networks, Vol. 3, No. 3-4, pp. 213-229, Dec. 2002.
[3] M. Cardei, M. Thai, Y. Li andW. Wu, “Energy-Efficient Target Coverage in Wireless Sensor Networks”, Proc. of IEEE INFOCOM, 2005.
[4] F. Akyidiz, Y. Sankara Subramaniam W. Su, and E. Cayirci, "A survey on sensor networks", IEEE Communication, August 2002.
[5] J. N. Al-Karaki and A. E. Kamal, "Routing techniques in wireless sensor networks: a survey," IEEE Wireless Communications, vol. 11, no. 6, pp. 6-28, Dec. 2004.