International Journal of Emerging Technology and Advanced Engineering
Website: www.ijetae.com (ISSN 2250-2459, Volume 2, Issue 4, April 2012)167
Wavelet Transform Techniques for Image Resolution
Enhancement: A Study
Bagawade Ramdas P.
1, Bhagawat Keshav S.
2, Patil Pradeep M.
31,M.E. Scholar. Department Of Computer Engineering,
2M.E. Scholar, Department Of Computer Engineering,
3
Assistant Professor Department Of Information Technology, Vidya Pratishthan College Of Engineering, Baramati ,India
1[email protected] 2[email protected]
Abstract— Images are being used in many fields of research. One of the major issues of images is their resolution. In this paper we are studying different image resolution enhancement techniques that use Wavelet Transform (WT).
Basis functions of the WT are small waves located in different times. They are obtained using scaling and translation of a scaling function and wavelet function Therefore, the WT is localized in both time and frequency. In this paper we are comparing different image resolution enhancement techniques those using Wavelet Transform.
Keywords— Image Interpolation, Peak signal-to-noise ratio (PSNR), Wavelet Zero Padding (WZP), Cycle Spanning (CS),
Dual-Tree Complex Wavelet Transform (DT-CWT), Discrete
Wavelet Transform (DWT), Stationary Wavelet Transform (SWT).
I. INTRODUCTION
Resolution has been frequently referred as an important property of an image. Images are being processed in order to obtain super enhanced resolution. One of the commonly used techniques for image resolution enhancement is Interpolation. Interpolation has been widely used in many image processing applications. Interpolation in image processing is a method to increase the number of pixels in a digital image. Traditionally there are three techniques for image interpolation namely Linear, Nearest Neighbor and Bicubic. Nearest Neighbor result in significant ―Jaggy‖ edge distortion [1]. The Bilinear Interpolation result in smoother edges but some what blurred appearance overall [1]. Bicubic Interpolation look’s best with smooth edges and much less blurring than the bilinear result [1].
By applying the 1-D discrete wavelet transform (DWT) along the rows of the image first, and then along the columns to produce 2-D decomposition of image[8].
[image:1.612.336.546.385.514.2]DWT produce four subbands low-low(LL),low-high(LH),high-low(HL)and high-high(HH).By using these four subands we can regenerate original image[8]. Theoretically, a filter bank shown in Fig. 1 should work on the image in order to generate different subband frequency images.
Fig 1. Block diagram of DWT Filter Banks of level 1 [8]
II. REGULARITY-PRESERVING IMAGE INTERPOLATION
International Journal of Emerging Technology and Advanced Engineering
Website: www.ijetae.com (ISSN 2250-2459, Volume 2, Issue 4, April 2012)168 Two-step process is carried out to obtain the unknown high-frequency subbands separably. In First step, in each row edges with significant correlation across scales are identified.
[image:2.612.49.284.279.490.2]Then near these edges the rate of decay of the wavelet coefficients is extrapolated to approximate the high-frequency subband required to resynthesize a row of twice the original size. In second step, the same procedure as in first step is then applied to each column of the row-interpolated image. Block diagram of interpolation system for 1-D row and column signals is shown in Fig. 2.
Fig 2. Block diagram of interpolation system for 1-D row and column signals[2].
III. NEW EDGE-DIRECTED INTERPOLATION
A hybrid approach produced by combining bilinear interpolation and covariance-based adaptive interpolation is used in [3] to reduce the overall computational complexity. Traditional linear interpolation schemes (e.g., bilinear and bicubic) based on space-invariant models are not able to capture the fast evolving statistics around edges and consequently produce interpolated images with blurred edges and annoying artifacts. Linear interpolation is good due to it’s computational simplicity but not good due to it’s the performance issue. Geometric regularity is very much important for the visual quality of a natural image such as the sharpness of edges and the freedom from artifacts.
Without the loss of generality, Xin Li & Michael T.
Orchard assume that the low-resolution image
X
i j, of sizeH
W directly comes from of size of 2H
2
W, i.e.2 ,2i j i j,
Y
X
.
They use the following basic problem to introduce their new interpolation technique: How do they interpolate the interlacing lattice
Y
2i1,2j1 from the lattice2 ,2i j i j,
Y
X
.They constrain their selves to the fourth-order linear interpolation.1 1
2 1,2i j 1 k 0 l 0 2k 1 2(i k),2(j l)
Y
Y
(1)
The above equation is core part of this algorithm invented in [3]. In order to manage the computational complexity, they used the following hybrid approach: covariance-based adaptive interpolation is only applied to edge pixels (pixels near an edge); for nonedge pixels (pixels in smooth regions), they still use simple bilinear interpolation. Such a hybrid approach is based on the observation that only edge pixels benefit from the covariance-based adaptation and edge pixels often consist of a small fraction of the whole image. A pixel is considered as an edge pixel if an activity measure (e.g., the local variance estimated from the nearest four neighbors) is above a preselected threshold value . Since the computation of the activity measure is typically negligible when compared to that of covariance estimation, dramatic reduction of complexity can be achieved for images containing a small fraction of edge pixels. Xin Li & Michael T. Orchard in [3] have found that the percentage of edge pixels ranges from 5% to 15% for the test images used in their experiments, which implies a speed-up factor of 7– 20 [3].
IV. WZP-CSBASED IMAGE RESOLUTION ENHANCEMENT
International Journal of Emerging Technology and Advanced Engineering
Website: www.ijetae.com (ISSN 2250-2459, Volume 2, Issue 4, April 2012)169
i) Using high resolution image in part (1) a number of low resolution images are generated by spatial shifting, wavelet transforming, and discarding the high frequency subbands.
ii)N high resolution images are obtained by applying the WZP processing to all those low resolution images.
iii)The final high resolution image is reconstructed by re-aligning and averaging these intermediated high resolution images. Fig. 3 shows the block diagram of the WZP- and CS-based image super resolution[4].
Fig3. Block Diagram of the WZP-and-CS-based image Resolution Enhancement [4].
V. DT-CWTBASED IMAGE RESOLUTION ENHANCEMENT
In this technique, as stated in [5],[8] dual-tree CWT (DT-CWT) is used to decompose an input image into different subband images. DT- CWT is used to decompose an input low-resolution image into different subbands. Then, the high-frequency subband images and the input image are interpolated, followed by combining all these images to generate a new high-resolution image by using inverse DT-CWT. The resolution enhancement is achieved by using directional selectivity provided by the CWT, where the high-frequency subbands in six different directions contribute to the sharpness of the high-frequency details, such as edges. Fig. 4 shows details of this technique, where the enlargement factor through the resolution enhancement is α.
Fig4. Block Diagram of DT-CWT Based Image Resolution Enhancement [5]
VI. IMAGE SUPERRESOLUTIONBASEDON INTERPOLATIONOFWAVELETDOMAINHIGH FREQUENCYSUBBANDSANDTHESPATIAL DOMAIN
INPUT IMAGE[6]
High-frequency components(i.e. the edges) are main loss of an image after being super-resolved by applying interpolation. This loss occur due to the smoothing caused by interpolation. To increase quality of the super-resolved image, preserving the edges is essential. In [6] work by Hasan Demirel and Gholamreza Anbarjafari, DWT has been employed in order to preserve the high-frequency components of the image. DASR technique uses DWT to decompose an image into different subband images; namely, low-low (LL), low-high (LH), high-low (HL), and high-high (HH).
These subband images contain the high-frequency components of the input image. In the DASR technique, the interpolation is applied to high-frequency subband images.
International Journal of Emerging Technology and Advanced Engineering
Website: www.ijetae.com (ISSN 2250-2459, Volume 2, Issue 4, April 2012)170 FIG 5. BLOCK DIAGRAM OF IMAGE SUPER RESOLUTION BASED ON
INTERPOLATION OF WAVELET DOMAIN HIGH FREQUENCY SUBBANDS AND THE SPATIAL DOMAIN INPUT IMAGE[6]
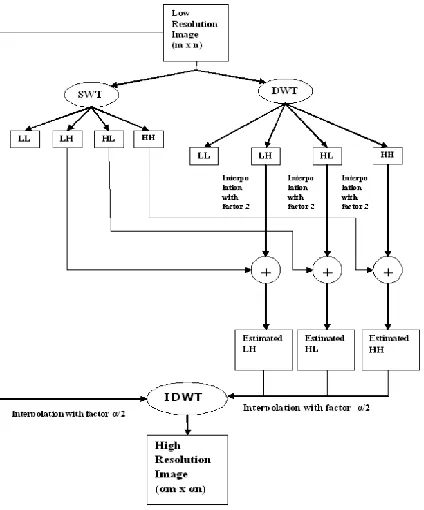
VII. IMAGE RESOLUTION ENHANCEMENT METHOD USING
SWT AND DWT[7]
The main loss in image resolution enhancement by using interpolation is on its high frequency components (i.e., edges), which is due to the smoothing caused by interpolation. Edges plays very important role in image. To increase the quality of the super resolved image, it is essential to preserve all the edges in image. In [7] work, DWT has been employed in order to preserve the high frequency components of the image(i.e. edges). The redundancy and shift invariance of the DWT mean that DWT coefficients are inherently interpolable.In this correspondence, one level DWT (with Daubechies 9/7 as wavelet function) is used to decompose an input image into different subband images. Three high frequency subbands (LH, HL, and HH) contain the high frequency components of the input image(i.e. edges). In this technique, bicubic interpolation with enlargement factor of 2 is applied to high frequency subband images. Information loss occur due to downsampling in each of the DWT subbands caused in the respective subbands. That is why SWT (Stationary Wavelet Transform) is used to minimize this loss.
The SWT is an inherently redundant scheme as the output of each level of SWT contains the same number of samples as the input – so for a decomposition of N levels there is a redundancy of N in the wavelet coefficients. The interpolated high frequency subbands and the SWT high frequency subbands have the same size which means they can be added with each other. The new corrected high frequency subbands can be interpolated further for higher enlargement. Also it is known that in the wavelet domain, lowpass filtering of the high resolution image produce the low resolution image. In other words, low frequency subband is the low resolution of the original image. Therefore, instead of using low frequency subband, which contains less information than the original high resolution image, Hasan Demirel and Gholamreza Anbarjafari [7] are using the input image for the interpolation of low frequency subband image. The quality of the super resolved image increases using input image instead of low frequency subband. Fig. 6 illustrates the block diagram of the used image resolution enhancement technique.
[image:4.612.50.278.137.342.2]International Journal of Emerging Technology and Advanced Engineering
Website: www.ijetae.com (ISSN 2250-2459, Volume 2, Issue 4, April 2012) [image:5.612.66.278.134.389.2]171 Fig 6. Block diagram of image resolution enhancement method using
SWT and DWT [7].
VIII. EXAMPLES AND DISCUSSION
These results are obtained by Hasan Demirel and Gholamreza Anbarjafari as shown in table I from [7]. PSNR and Entropy values are used to measure the quality of an image. Peak signal-to-noise ratio (PSNR) and root mean square error (RMSE) have been implemented in order to obtain some quantitative results for comparison. PSNR can be obtained by using the following formula :
2 10
10
log
( R )PSNR
MSE
(2)
Where R is the maximum fluctuation in the input image (255 in here as the images are represented by 8 bit, i.e., 8-bit grayscale representation have been used radiometric resolution is 8 bit).
2 ,
( in( , ) org( , ))
i j
I i j I i j
MSE
M N
(3)
Where M and N are the size of the images. When the two images are identical, the MSE will be zero.Clearly, RMSE is the square root of MSE, hence it is given by:
RMSE MSE
(4)
Image entropy is a quantity which is used to describe the `business' of an image, i.e. the amount of information which must be coded for by a compression algorithm. Image entropy is calculated with the formula:
2
i i
i
ENTROPY
p Log p (5)In the above expression, Pi is the probability that the
difference between two adjacent pixels is equal to i, and Log 2 is the base 2 logarithms.
TABLE I
PSNR (DB) VALUES FOR DIFFERENT RESOLUTION ENHANCEMENT TECHNIQUES FROM 128x128 TO 512x512 . [7].
Techniques PSNR(dB)
Lena
Bilinear 26.34
Bicubic 26.86
WZP(db. 9/7) 28.84
Regularity preserving Image
Interpolation 28.81
New Edge Directed Interpolation 28.81
HMM 28.86
HMM SR 28.88
WZP-CS 29.27
WZP-CS-ER 29.36
DWT SR 34.79
CWT SR 33.74
SWT SR 32.01
Discrete & Stationary Wavelet
[image:5.612.318.566.338.704.2]International Journal of Emerging Technology and Advanced Engineering
Website: www.ijetae.com (ISSN 2250-2459, Volume 2, Issue 4, April 2012)172 IX. CONCLUSION
It is cleared from table I values that the image resolution enhancement method using DWT & SWT is giving far better result than any other technique studied in this paper.
REFERENCES
[1] Digital Image Processing Using MATLAB (Second Edition) by Rafel C. Gonzalez and Richard E. woods and Steven L. Eddins.
[2] W. Knox. Carey, Daniel. B. Chuang, and S. S. Hemami, ―Regularity Preserving image interpolation,‖ IEEE Trans. Image Process., vol. 8, no. 9, pp. 1295–1297, Sep. 1999.
[3] Xin. Li and Michael. T. Orchard, ―New edge-directed interpolation,‖
IEEE Trans. Image Process., vol. 10, no. 10, pp. 1521–1527, Oct. 2001.
[4] Alptekin. Temizel and Theo. Vlachos, ―Wavelet domain image resolution enhancement using cycle-spinning,‖ Electron. Lett., vol. 41, no. 3, pp. 119–121, Feb. 3, 2005.
[5] Hasan. Demirel and Gholamreza. Anbarjafari, ―Satellite image resolution enhancement using complex wavelet transform,‖ IEEE Geosci. Remote Sens. Lett., vol. 7, no. 1, pp. 123–126, Jan. 2010.
[6] Gholamreza. Anbarjafari and Hasan. Demirel, ―Image super resolution based on
interpolation of wavelet domain high frequency subbands and the
spatial domain input image,‖ ETRI J., vol. 32, no. 3, pp. 390–394, Jun. 2010.
[7] Hasan. Demirel and Gholamreza. Anbarjafari, ―IMAGE Resolution Enhancement by Using Discrete and Stationary Wavelet Decomposition,‖ IEEE IMAGE PROCESSING, VOL. 20, NO. 5, MAY 2011..
![Fig 1. Block diagram of DWT Filter Banks of level 1 [8]](https://thumb-us.123doks.com/thumbv2/123dok_us/8735621.888426/1.612.336.546.385.514/fig-block-diagram-dwt-filter-banks-level.webp)
![Fig 2. Block diagram of interpolation system for 1-D row and column signals[2].](https://thumb-us.123doks.com/thumbv2/123dok_us/8735621.888426/2.612.49.284.279.490/fig-block-diagram-interpolation-d-row-column-signals.webp)
![FIG 5.INTERPOLATION OF WAVELET DOMAIN HIGH FREQUENCY SUBBANDS BLOCK DIAGRAM OF IMAGE SUPER RESOLUTION BASED ON AND THE SPATIAL DOMAIN INPUT IMAGE[6]](https://thumb-us.123doks.com/thumbv2/123dok_us/8735621.888426/4.612.50.278.137.342/interpolation-wavelet-domain-frequency-subbands-diagram-resolution-spatial.webp)