Distributed Optical Fiber Strain Sensing in a Secant Piled Wall
Hisham Mohamad1, Peter J. Bennett2, Kenichi Soga3,
Assaf Klar4and Adam Pellow5
ABSTRACT
An optical fiber strain sensing technique, based on Brillouin Optical Time Domain Reflectometry (BOTDR), was used to obtain the full deformation profile of a secant pile wall during construction of an adjacent basement in London. Details of the installation of sensors as well as data processing are described. By installing optical fiber down opposite sides of the pile, the distributed strain profiles obtained can be used to give both the axial and lateral movements along the pile. Measurements obtained from the BOTDR were found in good agreement with inclinometer data from the adjacent piles. The relative merits of the two different techniques are discussed.
INTRODUCTION
In this study the strain distribution inside a secant pile wall was measured using a BOTDR analyzer (Yokogawa AQ8603). This unit allows the measurement of strain distribution along a standard single-mode optical fiber using a reflective technique, requiring access to only one end of the optical fiber (e.g. Klar et al., 2006). By measuring the strain along two fibers placed symmetrically with respect to the axis, it is possible to monitor the behaviour of a diaphragm wall. The plane deformation problem of a pile, with two fibersaandb, is shown in Figure 1. By obtaining strains
aand bshown in the figure, and assuming that the wall is deforming elastically, one
can derive the quantities of lateral component from Eq. 1a, i.e. the curvature , the
1
Researcher, Schofield Centre, High Cross Site, Madingley Road, Cambridge University, Cambridge CB3 0EL, UK
2
Senior Research Associate, Schofield Centre, High Cross Site, Madingley Road, Cambridge University, Cambridge CB3 0EL, UK
3
Reader in Geomechanics, Cambridge University Engineering Department, Trumpington Street, Cambridge CB2 1PZ, UK
4
Senior Lecturer, Faculty of Civil and Environmental Engineering, Technion – Israel Institute of Technology, Haifa 32000, Israel
5
Senior Engineer, Arup Geotechnics, 13 Fitzroy Street, London W1T 4BQ, UK
FMGM 2007: Seventh International Symposium on Field Measurements in Geomechanics © 2007 ASCE
Copyright ASCE 2007 Field Measurements in Geomechanics (FMGM 2007)
gradient , and the lateral displacement u, while quantities for vertical component
can be obtain from Eq. 1b, consists of averaged axial strain and vertical
displacementw.
(
a b)
d= 1 = dz+A u= dz+B (1a)
(
a+ b)
= 2 1
C dz
w= + (1b)
The constants A, B and C can be found by taking further measurements, such as
measuring the pile tip displacements from theodolites, or by considering known boundary conditions.
FIELD MEASUREMENT SITE
The site is located on former BT Telephone Exchange in Chesham Place, Belgravia, London and was recently replaced by six substantial lateral apartments which included an underground car park. Bored pile walls were constructed to allow ground excavation with a maximum depth of 10m, supported by up to four levels of braces. The wall consisted of 450mm diameter hard-soft secant piles with male piles spaced at intervals of 0.6m providing the reinforcement. The secanting female piles provided a temporary ground water cut off.
The bored piles were installed using a minipile technology, using temporary casings pushed into the clay to the toe of the male/female piles. Out of 192 male piles constructed across the perimeter of the wall, eight of them were equipped with inclinometer tubes, while optical fiber strain sensors were installed in two piles. Figure 2 shows the optical fiber sensors installed at Pile 117 and Pile 126 where comparison of measurements can be made with inclinometer readings made in Piles 116 and 125.
INSTALLATION
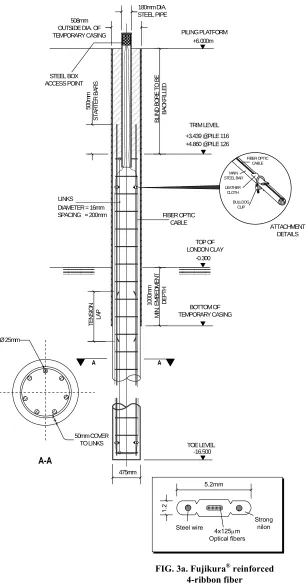
A special type of tight buffered cable was used (see Figure 3a) that can withstand the harsh installation conditions, but is still sensitive to strain. The cable consists of four optical fibers that are reinforced with a pair of steel wires. Only one fiber is required for connection to the strain analyzer, the others provide redundancy.
A single optical cable was attached along the two opposing sides of reinforcement cage by firstly fixing the cable with two clips at the bottom of the cage as shown in
Figure 3. The cable on each side was fed in as the cage was lowered into the
borehole. Once the top section of the cage was positioned just above ground level,
the two sections of the cable were pre-tensioned to about 2000µ and clamped onto
b a
O O
a b
d
a b
P P
Deformed axis
Equivalent curvature with no axial strain
’a
’b
u w
z
Neutral axis
P
’
A A
[image:3.612.211.402.87.355.2]Plane A-A
FIG. 1. Determination of plane deformation by measuring strains aand b along fibers a and b
FIG. 2. (a) Locations of the instrumented piles (b) Protected steel tube on Pile 126 with inclinometer tube on Pile 125 (c) Optical fiber access point
FMGM 2007: Seventh International Symposium on Field Measurements in Geomechanics © 2007 ASCE
Copyright ASCE 2007 Field Measurements in Geomechanics (FMGM 2007)
[image:3.612.131.512.421.648.2]PILING PLATFORM +6.000m TRIM LEVEL TOP OF LONDON CLAY BOTTOM OF TEMPORARY CASING TOE LEVEL -16.500 +3.439 @PILE 116 +4.860 @PILE 126
-0.300 BL IN D BO R E TO BE BA C KF IL LE D 50 0m m ST AR TE R BA R S 10 00 m m M IN .E M BE D M EN T D EP TH TE N SI O N LA P LINKS DIAMETER = 16mm SPACING = 200mm
A A
[image:4.612.155.461.91.675.2]508mm OUTSIDE DIA. OF TEMPORARY CASING 475mm 50mm COVER TO LINKS A-A Ø 25mm 180mm DIA. STEEL PIPE ATTACHMENT DETAILS STEEL BOX ACCESS POINT FIBER OPTIC CABLE FIBER OPTIC CABLE MAIN STEEL BAR LEATHER CLOTH BULLDOG CLIP 5.2mm 1. 2 Steel wire Strong nilon 4x125 m Optical fibers
FIG. 3a. Fujikura®reinforced
4-ribbon fiber
0 10 20 30 40 50 60 70 80 90 100 -0.2
-0.1 0 0.1 0.2 0.3 0.4 0.5
D istance (m )
S
tr
a
in
(%
)
Averaged Base Reading Averaged Second Reading OUTERSIDE
EXCAVATION NEARSIDE
EXCAVATION
PILE'S TOE
FIG. 4. Actual strains measured in Pile 126
To ensure that the optical fibers survived the whole construction process, a steel pipe was used to protect the fibers, particularly whilst breaking down the concrete at the top of the pile, as shown in Figure 2 and Figure 3. The two ends of the sensing cable were safely stored in a box where they could later be accessed from the top of the protruding steel pipe and connected to the strain analyzer.
DATA INTERPRETATION
As the change in temperature influences BOTDR strain measurement, temperature compensation is required. A small unstrained section of the fiber that ran across the bottommost link was selected as a fiber that only changes the readings due to temperature. Taking the average reading at this section and comparing the averaged reading of the same location from the subsequent readings, the difference between the two will be the amount that is required to be compensated to the subsequent readings.
An example of the strain measurements of the optical fibers attached along the reinforcing cage is shown in Fig. 4. The figure consists of a baseline reading taken before the excavation and a subsequent reading made after the excavation, with each measurement taken three times and averaged to improve the accuracy. After temperature compensation the traces recorded at the toe from both readings were similar. On the other hand, the strains measured along the two opposite sides of the pile have changed as the pile deflected.
In this study, two sets of strain data from Pile 126 and one set of strain data from Pile 117 are presented. The measurements were made when the excavation depth was at -2.4m OD (11 Oct 2005) and at -4.5m OD (8 Nov 2005) from a baseline reading on 12 Aug 2005. Pile 117 unfortunately had no measurement taken before the
FMGM 2007: Seventh International Symposium on Field Measurements in Geomechanics © 2007 ASCE
Copyright ASCE 2007 Field Measurements in Geomechanics (FMGM 2007)
excavation took place, and therefore comparison can only be made between 11 Oct 2005 and 8 Nov 2005.
Figure 5 shows the axial strains, measured in Pile 125 and Pile 117 deduced from
the strain measurements of the two opposite side of the piles. The averaged axial strains indicate that the diaphragm wall was actually under compression especially above the ground level due to the existence of vertical loads at the top. There was an additional influence of temperature variance between the exposed pile and the embedded section.
Comparison with Inclinometer Readings
The difference in the strains measured in the fibers on opposite sides of the pile, shown in Figure 5, can be converted into curvature using Eq. 1a. By integrating the curvature once inclination of the pile can be deduced, and by integrating it twice lateral displacement of the pile is obtained. For simplicity, the piles instrumented
were assumed not to move at the toe and therefore constantsAandBwere set as zero.
For data comparison, inclinometer data obtained from the adjacent piles can be differentiated once to get the curvature and integrated once for lateral displacement. In this paper, integration on the actual data was done using Trapezoidal Rule while the differential method is based on centered differences.
In order to obtain a realistic comparison between the two measuring systems, inclinometer readings were interpolated or averaged between the two dates closest to the date of the BOTDR readings. Figures 6 and 7 show the comparisons between BOTDR and inclinometer readings from Piles 126 and 125 in terms of displacement, gradient and curvature at the excavation depths of -2.4m and -4.5m OD respectively. In case of Pile 116 the baseline for the inclinometer readings also had to be adjusted before comparison with strain measurement in Pile 117. The baseline was obtained by averaging readings from 6/10/05 and 14/10/05 and this was compared with an average of readings on 3/11/05 and 21/11/05 as illustrated in Figure 8a. The lateral displacements, slopes and curvatures of the two instrumentations are shown in Figure 8b, c, and d respectively.
Results from Figures 6, 7, and 8 indicate that the measurement of the basement wall deformation between BOTDR and inclinometer in terms of deflection, gradient and curvature are very much alike. The assumptions that there is no displacement and rotation at the pile’s toe seems to match both data very well. The maximum displacements were found at a depth of just above the ground level while the overall movements recorded throughout the whole stage of construction fall within the acceptable designed range.
Page 7
-0.04 -0.03 -0.02 -0.01 0 0.01 0.02 -16
-14 -12 -10 -8 -6 -4 -2 0 2 4
Strain (% )
E
le
v
a
ti
o
n
(m
)
Pile 126: BOTDR Strain Measurement between 12/08/05 and 11/10/05
Excavation
Level
Outerside of Excavation Nearside of Excavation Axial strain
-0.04 -0.03 -0.02 -0.01 0 0.01 0.02 -16
-14 -12 -10 -8 -6 -4 -2 0 2 4
Strain (% )
Pile 126: BOTDR Strain Measurement between 12/08/05 and 8/11/05
Exc. Lvl.
Outerside of Excavation Nearside of Excavation Axial strain
-0.04 -0.03 -0.02 -0.01 0 0.01 0.02 -18
-16 -14 -12 -10 -8 -6 -4 -2 0 2 4
Strain (% )
Pile 117: BOTDR Strain Measurement between 08/11/05 and 11/10/05
Outerside of Excavation
Nearside of Excavation
Axial Strain
[image:7.612.109.687.116.456.2](a) (b) (c)
FIG. 5. Strain profiles measured in Piles 126 and 117 show the movements of piles laterally and axially
FMGM 2007: Seventh International Symposium on Field Measurements in Geomechanics © 2007 ASCE
Copyright ASCE 2007
Field Measurements in Geomechanics (FMGM 2007)
-2 0 2 4 6 8 10 12 -16 -14 -12 -10 -8 -6 -4 -2 0 2 4 6
LateralD isplacem ent(m m )
E le v a ti o n (m ) 1st Prop (26 Sep 05)
2nd Prop (6 Oct 05)
BOTDR 11 Oct 05 Incl 6 Oct 05 Incl 14 Oct 05 Incl Averaged 10 Oct 05
-3 -2 -1 0 1 2
x 10-3
G radient
Excavation Level
BOTDR 11 Oct 05 Incl Averaged 10 Oct 05
-0.1 -0.05 0 0.05
C urvature (% /m ) Excavation
Level
BOTDR 11 Oct 05 Incl Averaged 10 Oct 05
[image:8.612.118.498.92.352.2](a) (b) (c)
FIG. 6. Comparisons of first strain measurement recorded in Pile 126 and averaged inclinometer readings from Pile 125.
-2 0 2 4 6 8 10 12 14
-16 -14 -12 -10 -8 -6 -4 -2 0 2 4 6
D isplacem ent(m m )
E le v a ti o n (m ) Exc. Lvl. Base Slab Floor 1st Prop 2nd Prop 3rd Prop (26 Oct) BOTDR 8 Nov 05 Incl 3 Nov 05 Incl 21 Nov 05 Incl Averaged 12 Nov 05
-3 -2 -1 0 1 2
x 10-3 G radient
BOTDR 8 Nov 05 Incl Averaged 12 Nov 05
-0.1 -0.05 0 0.05
C urvature (% /m ) BOTDR
8 Nov 05 Incl Averaged 12 Nov 05
(a) (b) (c)
[image:8.612.117.496.398.658.2]-2 0 2 4 6 8 10 12 -18 -16 -14 -12 -10 -8 -6 -4 -2 0 2 4
D isplacem ent(m m )
E le v a ti o n (m )
6 Oct 05 14 Oct 06 Averaged 10 Oct 06 3 Nov 05 21 Nov 05 Averaged 12 Nov o5
-2 0 2 4 6 8 10 12
-18 -16 -14 -12 -10 -8 -6 -4 -2 0 2 4
D isplacem ent(m m ) Inclinometer BOTDR
(a) (b)
-2 -1 0 1 2
x 10-3 -18 -16 -14 -12 -10 -8 -6 -4 -2 0 2 4 G radient E le v a ti o n (m ) Inclinometer BOTDR
-0.1 -0.05 0 0.05 0.1
-18 -16 -14 -12 -10 -8 -6 -4 -2 0 2 4
C urvature (% /m ) Inclinometer
BOTDR
(c) (d)
FIG. 8. (a) Displacements recorded from inclinometer readings. (b), (c) and (d) are the comparisons of BOTDR and interpolated inclinometer measurements
recorded at Pile 117 and Pile 116.
FMGM 2007: Seventh International Symposium on Field Measurements in Geomechanics © 2007 ASCE
Copyright ASCE 2007 Field Measurements in Geomechanics (FMGM 2007)
[image:9.612.109.484.93.658.2]TABLE 1 A summary of the ground and the wall properties
Stratum
(kN/m3) ’ (°)
c' (kN/m2)
cu
(kN/m2)
Drained E’
(MN/m2)
Undrained Eu
(MN/m2)
Made Ground & Terrace Gravel
20 36 0 - 30
-London Clay 20 24 0 100+6z* 0.80cu 1cu
*zis depth below the top of London Clay, here assumed to be 0.0m OD
EIof the wall = 93,934 kNm2/m run and prop stiffness as 70,000 kN/m/m
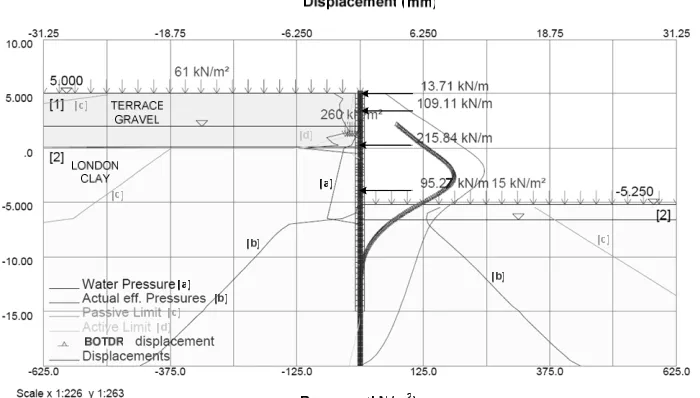
FIG. 9. Ground conditions of the site with prediction of lateral displacement compared to BOTDR displacement
The program is essentially a 2D plane strain analysis, whereas the actual ratio of excavation depths in relation to the wall lengths is 10m/33m, so strong 3D effects were expected, which would reduce the actual displacements and stresses in the walls. Therefore, the analysis is intrinsically conservative. A summary of the ground and the wall properties is listed in Table 1. Figure 9 displays the ground conditions and the calculated earth pressures at the excavation level -4.5m OD along with a comparison of the lateral deflections calculated by FREW and BOTDR.
Although the actual displacement was significantly smaller than the predicted value, the predicted bending moment and shear force were much closer to the field data.
Using the relationships ofM = EIandQ=dM/dz, the bending moment, M and
shear force, Q for Pile 126 are plotted in Figure 10. In the design calculations, i.e.
Ultimate Limit State (ULS), the wall flexural stiffness (EI) was taken as 0.7EoI
during construction and the short-term Young’s modulus of concrete,Eowas chosen
as 28GPaas according to CIRIA C580 Report. The bending moment profiles (Figure
[image:10.612.132.482.234.433.2]the highest peak of 125 kNm while the inclinometer showed a maximum bending moment of 87 kNm and the FREW analysis gave a value in between the two.
Because the analyzer used in this study produces a random error of ± 30µ and the
measurement is densely plotted, at every 10cm, it is sensible to filter the data in order to get an appropriate shear force diagram when differentiating the bending moment. The data points were fitted with a polynomial curve, which is a second degree of Savitzky-Golay (1964) smoothing filtering, on 25 data points.
Figure 10b compares the differentiated shear force diagram from BOTDR and inclinometer readings together with the FREW analysis results. The shear forces measured by both BOTDR and inclinometers were found to be smaller than the FREW analysis but still gave its ‘zig-zag’ shape caused by the prop loads. The reason that both measurement techniques give a lower shear force is because that they are unable to detect sharp changes of shear loads. A good shear force measurement would require the instruments make measurements over considerably smaller distance intervals in order to detect such local events as well as make precise measurements. In the case of the inclinometer, the distance resolution is only every half a metre. In the case of the BOTDR, readings can be taken down to every 5cm, but the analyzer actually measures a weighted average of strain along approximately 1 m gauge length (Klar, et. al., 2006).
-50 0 50 100
-16 -14 -12 -10 -8 -6 -4 -2 0 2 4
B ending M om ent,(kN m )
E
le
v
a
ti
o
n
(m
)
BOTDR Filtered BOTDR Inclinometer FREW
-150 -100 -50 0 50 100
ShearForce,(kN )
-150 -100 -50 0 50 100
ShearForce,(kN )
[image:11.612.117.495.364.602.2](a) (b) (c)
FIG. 10. Diagrams of bending moment (a) and shear force (b) measured at excavation depth of -4.5m OD. A shear force diagram from an earlier
excavation depth of -2.4m OD is shown in (c).
BOTDR VS. INCLINOMETER
Although the measurements obtained from the inclinometer and BOTDR are very similar, there are a few important notes that can be highlighted in using optical fiber
FMGM 2007: Seventh International Symposium on Field Measurements in Geomechanics © 2007 ASCE
Copyright ASCE 2007 Field Measurements in Geomechanics (FMGM 2007)
strain sensing as opposed to the conventional inclinometer technique. One of the main advantages of using BOTDR is that the strain measured in the piles would give a direct curvature/bending moment distribution. This is better than needing to differentiate the gradient from the inclinometer data. In terms of deriving the shear force diagram, inclinometer data has shown less stable results compared to the filtered BOTDR data especially in measuring small movements as presented in Figure 10c. The other benefit of using BOTDR to measure wall deflection is that the wall can still be monitored long after the construction of basement and ground floors since the optical fiber cables can be buried, or carried in ducts, and accessed from different locations. Furthermore, the axial behavior of the wall can also be observed which is not possible when an inclinometer is used.
On the other hand, the disadvantage of using BOTDR strain sensing is that the derivation of lateral displacement involves acquiring two boundary conditions, i.e. the constantsAandB. The inclinometer only requires the knowledge of constantB. It should also be noted that this measurement technique requires that the strain profile must be obtained in both optical fibers.
Nevertheless, because of the simple and quick installation technique, distributed optical fiber sensing in piles can be as practical as inclinometer measurements. Furthermore, further development of the technology is likely to mean that optical strain sensing can become more accurate and cheaper in the near future.
CONCLUSIONS
A novel technique for measuring the full deformation of laterally loaded piles was demonstrated using distributed optical fiber strain sensors based on BOTDR at a site in London. The results obtained from the strain measurements were in good agreement with inclinometer data obtained from adjacent piles. Further analysis in terms of bending moment and shear force showed that BOTDR gave a better measurement than the inclinometer. The benefits and the limitations of using distributed optical fiber sensing, as opposed to inclinometers, in retaining walls were discussed.
REFERENCES
CIRIA Report C580: Embedded retaining walls: guidance for economic design, Gaba A.R., Simpson, B., Powrie, W. and Beadman, D.R. (2003)
Klar, A., Bennett, P.J., Soga, K., Mair, R.J., Tester, P., Fernie, R., St John, H. and Torp-Peterson, G. (2006) “Distributed Strain Measurement for Pile Foundations.”
Proceedings of the Institution of Civil Engineers- Geotechnical Engineering, (159): 135-144.
Savitzky, A. and Golay, M.J.E. (1964) “Smoothing and Differentiation of Data by