With 8 text-figures Printed in Great Britain
Concentrations of potassium in the dry matter and tissue water of
field-grown spring barley and their relationships to grain yield
BY R. A. LEIGH AND A. E. JOHNSTON
Rothamsted Experimental Station, Harpenden, Hertfordshire, AL5 2JQ
(Received 13 April 1983)
SUMMARY
In 68 spring barley crops grown in five experiments at Rothamsted and Woburn between 1980 and 1982, and given adequate K fertilizer, there was a positive correlation (r = 0-76; P< 0-001) between maximum % K in dry matter of young plants and the grain yield at final harvest. In all crops changes in % K in dry matter during the growing season were directly related to changes in fresh weight to dry weight ratio (FW: DW) suggesting that differences in % K in dry matter were the result of differences in tissue hydration. Potassium concentrations expressed on the basis of tissue water were not correlated with grain yield. All crops maintained K concentrations in their tissue water of about 200 mmol/kg tissue water, except at the end of the growing season when water loss during ripening caused a steep rise.
The correlation between % K in dry matter and yield was the result of differences in FW: DW. Within each experiment there was a good correlation between FW: DW and grain yield, but because the relationship was different for each experiment the overall correlation for all crops was poor. The correlation between FW: DW and grain yield within experiments probably arises because crops with a higher FW: DW will have higher specific leaf areas and hence higher relative growth rates and yields.
1978) there have been no detailed studies with field-grown cereals nor has the relationship Schafer (1977) reported that in 665 cereal crops between grain yield and K concentrations in the grown in Germany between 1963 and 1965 there tissue water been investigated. In this paper we was a highly significant, positive correlation compare the changes in K concentrations in dry between % K in dry matter of the plants at stem matter and in tissue water during the growth of elongation and yield. Although the crops received spring barley crops in the field, and examine the K fertilizer it remains uncertain whether the relationship between these K concentrations and correlation resulted from small, but physiologically grain yield at final harvest,
important, differences in K status or whether some
other factor linked the two sets of observations. MATERIALS AND METHODS Thus to understand the relationship between % K
experi-Table 1. Treatment received by the lowest and highest yielding crops in the four experiments sampled in 1980 and 1981
Grain yields and manurial treatments on lowest and highest yielding plots
Expt A B C D Year 1980 1981 1981 1981 Cultivar Georgie Georgie Georgie Triumph Seed rate (kg/ha) 150 160 160 160 Sowing date 21 Feb. 17 Feb. 6 Apr. 10 Apr. Harvest date 18 Aug. 17 Aug. 1 Sept. 17 Aug. Grain yield , (t/ha) 1-39 7-30 1-02 6-12 2-33 6-61 1-86 8-07 N* 0 144 0 48 0 120 0 100 P (kg/ha) 0 0 0 0 27 27 26 26 K 90 0 90 0 50 50 50 50 •^ FYMf (t/ha) 0 35 0 35 0 0 0 0
• Applied as 'Nitro-Chalk 26'.
•f FYM, farmyard manure; supplied in total 235, 45 and 340 kg/ha of N, P and K, respectively.
yielding plots from Expts A-D are presented in detail, although all data are used in the correlations in Figs 2, 6 and 7. Details of the treatments applied to the highest and lowest yielding plots in Expts A-D are in Table 1. The soil at Rothamsted is a silty clay loam and that at Woburn a sandy loam. The exchangeable K in the surface soils was in excess of 120 mg/kg and 90 mg/kg at Rothamsted and Woburn, respectively, the levels below which Johnston, Warren & Penny (1970) found that spring barley responded to freshly applied K fertilizer at the two sites. Thus differences in grain yield should not have resulted from inadequate soil K.
In all experiments sampling began when the plants had three leaves and continued until just before harvest, except in 1982 when it stopped at anthesis. Before anthesis samples were collected every 3-5 days but less frequently thereafter. On each sampling occasion all the above-ground parts of the plants were removed from a single, randomly-selected 1 m length of row from each plot. Sequen-tial samples were not taken adjacent to earlier sampling areas and roots of sampled plants were dug from the soil to prevent regrowth of the shoots. The top samples were sealed in moisture-proof bags and brought to the laboratory where fresh weight and dry weight were determined. Samples were dried at 80 °C overnight. Tissue water was assumed to be the difference between fresh and dry weight. Potassium was extracted from ashed tissue (450 °C, 3 h) with HC1 and was measured using an atomic absorption spectrometer or an inductively coupled plasma optical emission spectrometer
(Applied Research Laboratories Ltd, Luton, Bedfordshire). Grain yields were determined by combine harvesting an area of crop measuring between 21-7 and 30-6 m2, depending on the experiment.
RESULTS AND DISCUSSION
% K in dry matter and its relation to grain yield and tissue hydration
677
Expt A
H 0"70 90 HO 130 150 170 190 eg
e
c
0
Expt C
JLj I I I I I
<Pr30 M) 70 90 HO 130
Expt B
yfe
80 100 120 140 160 180Expt D
O'fyo 50 70 90 110 130
No. of days after sowing
7r
.1
01 g
Grain yield (t/ha)
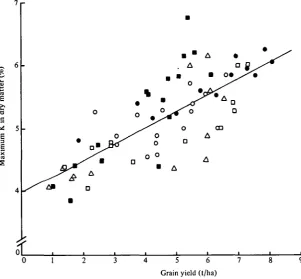
Fig. 2. Relationship between maximum measured % K in dry matter of young spring barley crops and their grain yield at harvest. D> Expt A; • , Expt B; O. Expt C; • , Expt D; A. Expt E. The fitted line has the equation y = 0*273;+3'95;r = 0*76.
matter and grain yield (Fig. 2), confirming Schafer's (1977) findings. However, our correlation coefficient (0-76) was much greater than Schafer's (0-39), per-haps because we used maximum % K in dry matter whereas Schafer (1977) used % K in dry matter at the time of stem elongation. Our observations indicate that % K in dry matter is declining rapidly at this time and may be quite different in plants of only slightly different physiological ages. Although the correlation between % K in dry matter and grain yield was highly significant this does not establish a physiological basis for the relationship because it is unclear whether differences in % K in dry matter represent real differences in K status. All our crops received K either as fertilizer or farmyard manure and the exchangeable K contents of the soils at Rothamsted and Woburn were above the levels at which spring barley responds to K fertilizer on these sites (Johnston et al. 1970). Thus it is unlikely that inadequate K supply was directly responsible for the observed relationship. Of particular interest in this context is the suggestion that tissue K
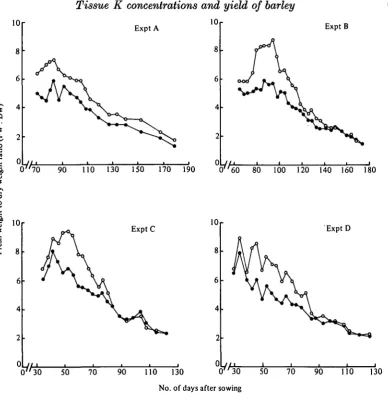
concen-trations should be expressed on the basis of tissue water to take account of the osmotic role of this nutrient (Cassidy, 1970; Pitman, 1975; Ahmad & Wyn Jones, 1982). To test whether the differences in % K in dry matter could result from differences in tissue hydration, the relationship between % K in dry matter and fresh weight to dry weight ratio (FW:DW) was examined. We chose FW:DW because it provides a simple, convenient measure-ment which is related to water content.
o 0
10r Expt A
8
Expt B
OL//J
90 110 130 150 170 190 0"60 80 100 120 140 160 180
•o o
f 10
£ 8
6
4
ExptC 10 Expt D
OL/ii
50 70 90 HO 130 07 r30 SO 70 90 110 130
No. of days after sowing
Expt A
10
Expt
oo c
B
A
(
0
p
o / /
/ o y^
10
ExptC
10 0
Expt D
10
Fresh weight to dry weight ratio (FW : DW)
600
500
400
300
200
a
IOOExpt A
600
500
400
300
200
100
67/7(J 9 0 M O 130 1 5 0 1 7 0 190
E E
I 600
I
§ 500
400
300
200
100
ExptC
600
500
400
300
200
100
50 70 90 MO T30 0
Expt B
80 100 120 140 160 180
Expt D
0^30" 50 70 90 MO 130
No. of days after sowing
Table 2. Mean K concentrations maintained in the tissue water of the lowest and highest yielding crops from Expts A, B, C and D, measured between the
3-leaf stage and the cessation of dry-matter accumula-tion
Mean + S.E. K concentration (mmol/kg tissue water)
Experiment A B C D Lowest yielding crop 202 + 7 188±4 176 + 6 182±10
Highest yielding crop 225 ±4 205 ±7 174 + 5 187 + 6
important osmotic role of K in plants (Lauchli & Pfliiger, 1979; Wyn Jones et al. 1979), tissue water is a more appropriate basis on which to recalculate the concentrations.
Concentrations of K in the tissue water of growing barley crops and their relation to grain yield
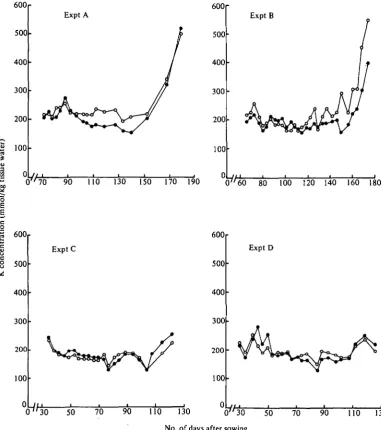
As expected from Fig. 4, calculating K concen-trations on the basis of tissue water substantially decreased differences between the low and high yielding crops from each experiment (Fig. 5). On all plots the K concentration was maintained at about 200 mmol/kg tissue water from the 3-leaf stage until the cessation of dry-matter accumula-tion. The rapid increase in concentration at the end
of the growing season coincided with water loss during ripening (Figs 5A and B). There were some day-to-day variations in K concentration in the tissue water which probably resulted from varia-tions in the amount of water associated with the crops rather than from real fluctuations in crop K status.
During the period when K concentrations were relatively constant the average K concentrations maintained in the tissue water of the low and high yielding crops ranged from 174 to 225 mmol/kg tissue water (Table 2). Crops from Expts C and D had slightly lower mean concentrations than those from Expts A and B. These differences may indi-cate small differences in K status, but they did not influence grain yield (see Table 1). Potassium concentrations in the tissue water at the time of maximum % K in dry matter showed no relation-ship to grain yield (Fig. 6). Thus in these crops, which were well supplied with K, the correlation between % K in dry matter and grain yield (Fig. 2) does not result from differences in K status. Nonetheless, the relationship between % K in dry matter and yield may have some predictive value. On any given site, % K in dry matter of young cereals is likely to be related to maximum potential yield for a particular set of treatments, though this yield may subsequently be reduced by other factors such as disease, water stress or lodging. To improve the predictive value of the relationship the influence of these factors will need to be decreased. 300 250 200 150 100 • A A • -*
8
—^
0B
i 0 0 D8
• • • • c • A •o A 8 A•i
• 0•A ftD
•
oo
0 1 2 3 4 5 6 7 8 9 Grain yield (t/ha)
683
10
o ! 7
I 5
1
u.
of
0 1 2 3 4 5 6 7 8 9
Grain yield (t/ha)
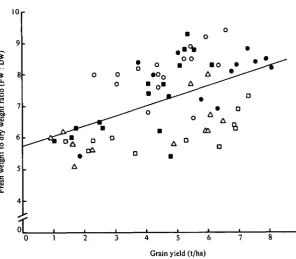
Fig. 7. Overall relationship between fresh weight: dry weight ratio (at the time of maximum % K in dry matter) and grain yield. D, Expt A; • , Expt B; O, Expt C; • , Expt D; A, Expt E. The fitted line has the equation y = 0-32x+5'li;r = 0-51.
The relationship between grain yield and FW :DW of young barley plants
Figure 7 shows the relationship obtained when FW: DW, measured at the time of maximum % K in dry matter, was plotted as a function of grain yield. Although the correlation coefficient was highly significant (P< 0-001) it was less than that obtained when % K in dry matter was plotted against yield (Fig. 2) even though FW: DW and % K in dry matter were closely related (Fig. 4). This poorer correlation resulted both from the inter-experiment variation in the relationship between % K in dry matter and FW:DW (compare slopes in Fig. 4) and because within
10
2
I
Expt A Day 81
10
8
Expt B fm Day 91
10 0 2 4 6 8 10
0
10 Expt C
Day 49
0
8 10 0
Expt D Day 43
8 10
Grain yield (t/ha)
Fig. 8. Relationship between freah weight to dry weight ratio (measured on the day after sowing indicated) and grain yield for Expts A, B, C and D. The equations for the fitted lines and values for the correlation coefficients are: Expt A, y = 0-29z + 4-55, r = 0-86; Expt B, y = 0-72x + 4-39, r = 0-87; Expt C, y = 0-61Z+4-78, r = 0-85; Expt D,^ = 0-42a;+4-92>r = 0-91.
The benefit of expressing K concentrations on a tissue water basis
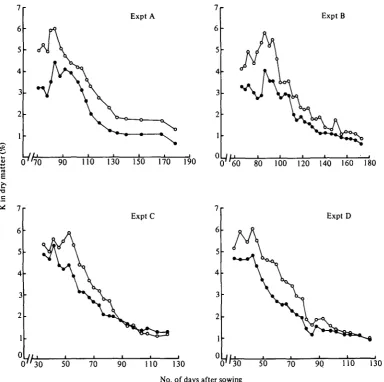
Expressing K concentrations on the basis of tissue water eliminated differences between low and high yielding crops and also revealed a different pattern of behaviour of this nutrient during the growth of barley. Whereas % K in dry matter generally declined during growth (Fig. 1), K concentrations in the tissue water remained reasonably constant at about 200 mmol/kg tissue water (Fig. 5; Table 2). Barley seedlings grown in K-sufficient nutrient solution in controlled
tissue water stays relatively constant during most of the growth of the crop it should prove a more useful measure of K status than % K in dry matter and may provide an age-independent method for assessing tissue K status. In
another paper (Leigh & Johnston, 1983) we further investigate the usefulness of K concentra-tions in tissue water by examining the effect of fertilizers and drought on these and on % K in dry matter.
REFERENCES AHMAD, N. & W r a JONES, R. G. (1982). Tissue
distri-bution of glycinebetaine, proline and inorganic ions in barley at different times during the plant growth cycle. Journal of Plant Nutrition 5,195-205.
ASHER, C. J. & OZANNE, P. G. (1967). Growth and potassium content of plants in solution cultures maintained at constant potassium concentrations. SoilScience 103, 155-161.
CASSIDY, N. G. (1970). The distribution of potassium in plants. Plant and Soil 32, 263-267.
HUNT, R. (1978). Plant Growth Analysis. London: Edward Arnold.
JOHANSBN, C. (1978). Effect of plant age on element concentrations in parts of Desmodium intortum cv. Greenleaf. Communications in Soil Science and Plant Analysis 9, 279-297.
JOHNSTON, A. E., WARREN, R. G. & PENNY, A. (1970).
The value of residues from long-period manuring at Rothamsted and Woburn. V. The value to arable crops of residues accumulated from potassium fertilizers. Rothamsted Experimental Station, Report for 1969, Part 2, pp. 69-90.
JUNGK, A. (1970). Mineral nutrients and moisture content in relation to plant development. Zeilschrift fur Pflanzenerndhrung und Bodenkunde 125, 119-129. LAUCHLI, A. & PFLUOER, R. (1979). Potassium
trans-port through plant cell membranes and metabolic role of potassium in plants. In Potassium Research -Review and Trends, pp. 111-163. Bern, Switzerland: International Potash Institute.
LEIGH, R. A. & JOHNSTON, A. E. (1983). The effects of fertilizers and drought on the concentrations of potassium in the dry matter and tissue water of field-grown spring barley. Journal of Agricultural Science, Cambridge 101, 741-748.
PITMAN, M. G. (1972). Uptake and transport of ions in barley seedlings. III. Correlation between transport to the shoot and relative growth rate. Australian Journal of Biological Sciences 25, 243-257.
PITMAN, M. G. (1975). Whole plants. In Ion Transport in Plant Cells and Tissues (ed. D. A. Baker and J . L. Hall), pp. 267-308. Amsterdam: North-Holland. SCHAFER, P. (1977). Comparative investigation of plant
analyses and soil tests in cereal cultivation with regard to the accuracy for the assessment of the effect of potassium on yields. Die Bodenkultur 28, 340-365.
WYN JONES, R. G., BRADY, C. J. & SPIERS, J . (1979).