Research Journal
Volume 10, No. 31, Sept. 2016, pages 64–73
DOI: 10.12913/22998624/64007 Research Article
TRANSIENT FINITE ELEMENT SIMULATION AND MICROSTRUCTURE
EVOLUTION OF AA2219 WELD JOINT USING GAS TUNGSTEN
ARC WELDING PROCESS
Sivaraman Arunkumar1, Anup Kulkarni Shrikrishna1, Sathiya Paulraj1, Kandasami Devakumaran2, Subramanian Ramesh Kumar3
1 Department of Production Engineering, National Institute of Technology, Tiruchirappalli 620015, Tamilnadu,
India, e-mail: [email protected]
2 Welding Research Institute, BHEL, Tiruchirappalli, Tamilnadu, India
3 School of Mechanical Engineering, SASTRA University, Thanjavur, Tamilnadu, India
ABSTRACT
In this study we focus on finite element simulation of gas tungsten arc welding (GTAW) of AA2219 aluminum alloy and the behavioral of the microstructure before and af -ter weld. The simulations were performed using commercial COMSOL Multiphysics software. The thermal history of the weld region was studied by initially developed mathematical model. A sweep type meshing was used and transient analysis was per -formed for one welding cycle. The highest temperature noted was 3568 °C during welding. The welding operation was performed on 200×100×25 mm plates. Through metallurgical characterization, it was observed that a fair copper rich cellular (CRC) network existed in the weld region. A small amount of intermetallic compounds like Al2Cu is observed through the XRD pattern.
Keywords: AA2219 aluminium alloy, gas tungsten arc welding, finite element simu -lation, metallurgical characterization.
INTRODUCTION
AA2219 is basically an Al-Cu-Mn ternary alloy and has a unique combination of proper -ties such as good weldability and high strength to weight ratio [1]. The alloy is extensively used in the fabrication of cryogenic tanks and pressure vessels due to its high strength, superior resis -tance to cracking and corrosion resis-tance. The AA2219 aluminium alloy contains a major al -loying addition of copper and minor additions of manganese, titanium, vanadium and zirconium. Generally, the alloy is produced in the T87 tem -per condition (solution treatment +7% cold work -ing + ag-ing)[2]. One of the drawbacks of most of the high strength Al alloys is that they suffer from poor weldability. However, AA2219 is an excep -tion due to the presence of more Cu that helps in healing the cracks by providing extra eutectics.
A lot of studies have been carried out in order to assess the effect of copper content and the distri -bution of second phase intermetallic particles on the properties of AA 2219 alloy [3].
GTAW welding is one of the mostly used fabrication processes in the industry due to its wide range of applications. The gas tungsten arc welding (GTAW) process was originally de -veloped in 1940s to weld magnesium and alu -minum alloys for aircraft applications. Argon gas soon became the most widely used shield gas because of its lower cost and smoother arc. Gas tungsten arc weldment of AA2219 alumi -num alloy was characterized by its microstruc -ture, transverse shrinkage, metallurgical and mechanical properties. AA2219 alloy is widely used for fabrication of fuel tanks in Aerospace application industries. Fracture toughness of this alloy is the most important design criteria
for some selected missile, space vehicles and aircraft [4]. This analysis shows also that, with -in the bounds of measured un-certa-inty, the pre -diction remains acceptable with respect to the largest mismatch revealed in temperature [12].
The use of the Finite Element Method (FEM) in product development is now well established. Its use in manufacturing processes is increasing and is part of the field of new applications in com -putational mechanics. The most important reason for this development is the industrial need to im -prove productivity and quality of products and to have better understanding of the influence of dif -ferent process parameters [5]. The modeled phe -nomena play an important role at various stages of the production of steel parts, such as welding, heat treatment and casting, among others. The impor -tance of these applications lies in determining the evolution of stresses and deformations to predict, for example, susceptibility to cracking and thus prevent failures during welding or even service. Furthermore, this simulation tool can be used to optimize different aspects of welding processes.
Simulation is a very powerful tool to help in understanding the factors limiting the quality of welding. A 3D finite element model of heat and fluid flow in weld pool considering free surface of the pool and traveling speed has been developed for the GTAW process. COMSOL software is also used to compute all the governing equations. The free surface of the weld pool is calculated by mini -mizing the total surface energy. The combined ef -fects of surface tension gradient, buoyancy force, arc pressure, gravity to drive the fluid flow are in -cluded in our model. The deformation of the weld pool surface and the welding speed affect fluid flow, heat flow and thus temperature gradients, molten pool dimensions and the humping phenom -ena which occur at a high arc pressure and welding speed. Welding trials study is presented to com -pare our numerical results with macrograph of the molten pool [6-8].The goal of thermo-mechanical analysis is to realize the significance of simulation of arc welding using finite element method. FEM is usually preferred to monitor and predict the weld -ing process that focused on 3D-thermo-mechanical simulation of welding process.
The buoyancy force is observed to increase with increase in electrode tip angle. Increasing the arc length decreases the buoyancy force in the weld pool. Pool convection decreases with increase in tip angle. The computed weld pool shapes are observed wide and shallow with small
and narrow and deep with large electrode tip an -gle. The computed pool shapes are compared with the experimental results and are observed in good agreement [13]. The FEM dynamic heat source model was used to simulate the low frequency PCGTAW, which has successfully demonstrated the dynamic temperature field in the welding pro -cess. In some welding process simulation, espe -cially for those whose dynamic characteristic is more obvious, the dynamic yielding heat source model has more advantages over the static mod -els. The static heat source model is the special case of the dynamic heat source model, which is not varied with time [14]. The main objective of this simulation is the determination of tempera -tures and stresses during and after the process. Temperature distribution defines the heat affected zone where material properties are affected.
EXPERIMENTAL PROCEDURE
Welding
Two 25 mm-thick AA2219 plates were butt-welded by GTAW process. The plates were rigid -ly fixed to avoid distortion during welding. Dou -ble V groove design was used as shown in Figure 1. The welding parameters used for the present study are given in Table 1. The welding was car -ried out in an automatic mode. During welding, the welding parameters such as arc voltage and welding current were measured using a digital meter fitted in the welding power source. Prior to the welding, the plates were cleaned with brush followed by acetone to remove oxide layers over faying surfaces. In the double V-groove, initially, welding was carried out on side-B followed by side-A (Figure 1). Experimental setup has been shown in Figure 2 and the base material proper -ties are shown Table 2.
Studies on weld joint characteristics
KMnO4 and 1 g of NaOH). The scanning electron microscope (SEM) was used to characterize the various features of microstructures of weld joints.
MATHEMATICAL MODEL
The thermal model
The following differential equation for 3D heat conduction is satisfied by the spatial and temporal temperature distribution [9]:
(1)
From equation (1), where T(x, y, z, t) is the current temperature, Q(x, y, z, t) is the rate of internal heat generation, kx, ky, and kz are the thermal conductivities in the x, y and z directions, respectively, ρ is density, Cp is specific heat, and v is the relative speed of the heat source. The thermal conductivity and specific heat were considered temperature dependent. The initial condition was defined as T(x, y, z, 0) = T0(x, y, z), while the boundary conditions were defined as the followings [9]:
(2)
In equation (2) nx, ny, and nz are direction cosines of the outward drawn normal to the boundary, qr is the boundary heat flux, hc is the convective heat transfer coefficient, σ is Stefan–Boltzmann constant, ε is emissivity, and F is the configuration factor. The radiation heat exchange can be treated as convec -tion, expressed by the following (equation 3) equivalent heat transfer coefficient.
(3)
Table 1. Welding parameters used for preparation of weld joints
Welding position 1G Welding current/A 125-138 Arc voltage/V 10.5-11.8 Welding speed /(cm·min-1) 10-11 Heat input/(kJ·cm-1) 7.16 - 9.77 Filler wire diameter and
specifications 2-2.5 mm & ER 2319
Shielding gas Commercially pure argon at gas flow rate of 15 lpm
Polarity AC
Tungsten electrode size
and specifications 2% Zirconated
Inter pass temperature Less than 100°C
Table 2. Material Properties
Property Value
Heat capacity (Cp) 900 [J/(kg-K)]
Density (ρ) 2700 [kg/m3]
Thermal Conductivity (k) 201[W/(m*K)]
Coefficient of thermal
expansion (α) 23.4e-6[1/K]
Young’s modulus (E) 69e3 MPa Poisson’s ratio (µ) 0.33 Melting point temperature
range 543-643 OC
Fig. 1. Schematic diagram showing locations side-A and side-B of double V groove
The heat source model
In the present analysis, to represent the heat generated by the torch in the GTAW process, a mov -ing heat source is developed based on the Goldak model. An important feature in this model is that a double ellipsoid energy is distributed by two ellipsoidal regions, one ahead and one after the weld torch. The power density distribution inside the front quadrant is determined using the following equation (4) [10-11].
(4)
In the same way, the power density distribution for the rear quadrant of the source inside the ellip -soid is determined by the equation (5) [10-11].
(5)
The energy input rate or heat input is Q =VI and where Q is the arc efficiency, v is arc voltage, I is arc current, V is the welding speed and τ is the incubation time. The energy deposited in the front and rear quadrants is defined by the fractions ff and fr where ff + fr = 2. The variables a, b, cf and cr are the shape parameters determining the shape and size of the weld pool. In this work, depth and width of the weld pool were experimentally measured from the micrographs, when the values of cf and cr were esti -mated based on the ellipsoid shape of the weld pool. Hence, the values of a, b and c were considered as 2, 2 and 4 mm for the root pass and 2, 2 and 6 mm, respectively. These values were consistent with the data reported in literature. The main source was moving along the weld center line, element by element, whose speed was depending on the welding speed. Time increments were automatically optimized for each time step by the computer program. The modified Newton–Raphson method was used in each time step for the heat balance iteration.
SIMULATION MODEL
In this work, a finite element model was
developed using COMOSL Multiphysics simi
-lar to the plate dimension 200×100×25 mm used for experimentation. The objective of this work is to study thermal history of welding process and its validation with experiments. The material properties were fed to the model as given in Table 2. A thermal time-dependent (transient analysis) model was opted for simu -lation. The bead preparation was also neglect -ed during the study.
Geometry and meshing
A 3D model of two plates each 200×100×25 mm was created in COMSOL. Since it is vital to get accurate simulation model, the type of ele -ment chosen for meshing becomes important.
The center part of mesh model was chosen as the weld path which was along the x-direction. The weld region and heat affected zone exhibited high heat flux and temperature and microstruc -tural changes, which were target zones of study. Hence fine meshing was employed in this region.
Fine meshing was done up to 10 mm on either side of weld path. The other zone represents unaf -fected region of base metal, hence coarse mesh -ing was used to save computational time.
The accuracy of any simulation model relies on quality of meshing. Initially, simulations were per -formed with coarse meshing. After convergence, it was found that the results were unacceptable as compared to experimental results. Hence mesh re -finement was performed until the results were in -dependent of mesh quality and the solution was ac -ceptable. This mesh was finalized for the simulation work. COMSOL provides three dimensional mesh -ing with sweep function. Initially top surface of the plates was meshed as shown in Figure 3. The 0 and 1 in the legend indicate fine and coarse meshing re -spectively. Later, surface mesh was swept for the entire three dimensional surface. A complete mesh was consisted of 16420 prism elements, 6568 trian -gular elements and 350 quadrilateral elements.
Boundary Conditions
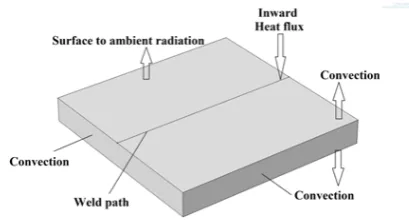
-of two parts. This line acts as weld path during simulation where inward heat flux was given as input. All the faces had an interaction with sur -roundings. Hence heat loss due to conduction, convection and surface to ambient radiation was considered. The thermal boundary conditions are shown in Figure 4.
Simulation
Equation-based modeling in Heat transfer module under COMSOL Multiphysics is utilized to introduce the developed heat source equations in the FE model for simulating the plasma arc weld -ing on titanium sheets. This enables the use of time-dependent loads and sources during the process. A time dependent nonlinear heat transfer analysis is run by applying initial and natural boundary condi -tions to simulate the temperature distribution pro -files for predicting the weld bead geometry.
RESULTS AND DISCUSSION
Nodal temperature
The temperature distribution during simula -tion is shown in Figure 5. The temperature dis
-tribution was plotted along the weld path. The total welding time was 120s. The maximum temperature during welding was found to be 3568 OC. At the end of the welding process due
to arc concentration the temperature obtained was 4225 OC.
Figure 6 shows the temperature distribution in width direction on the work piece from the weld centerline which showed that the arc fol -lows the Gaussian distribution. The temperature distribution is shown from time 55-65 sec at cen -ter of the plate. The peak temperature was seen at the weld centerline and along the transverse direction the temperature was getting reduced and attained ambient temperature at a distance of 20 mm. The highest temperature was attained at 60 sec, when arc was at the top of the center point of the plate. The half width of the molten pool was observed to be 10 mm. The tempera -ture distribution across the width at different time level is shown in Figure 5.
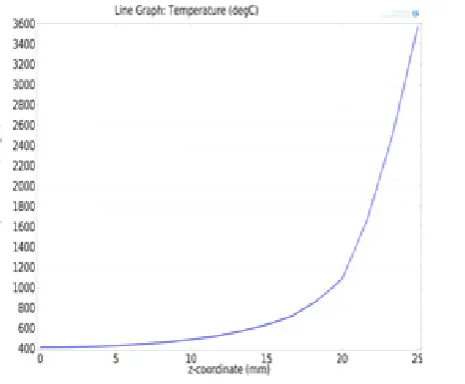
Figure 7 shows the temperature gradient along the thickness direction. The temperature at the top of the plate was observed to be 3568 OC.
The liquidus temperature of the AA2219 was 643 OC. Only a distance upto 8-10 mm from the
top of the plate was maintained above 643 OC
and a molten pool was formed. From the bottom of the plate, only a distance of 8-10 mm above was heated because of the lack of heat input. Hence partial penetration was obtained and the depth of penetration was observed as 8-10 mm.
Figure 8 shows the temp vs. time curve when the heat source approached the center of plate. As heat source came near to the center of the plate say t=50 sec, the temperature started rising and attained maximum temperature at t=60 sec i.e. center of plate. As time increased i.e. welding arc moved away from center of the plate, the temperature at the center of the plate started decreasing.
Fig. 3. Meshing of parts
Metallurgical characterization
Typical microstructure of base metal is shown in Figure 9. It is observed from Figure 8 that the copper rich phase was distributed in the alumin -ium matrix.
The changes in microstructure of GTAW welds is shown in Figure 10. It was revealed from microstructures that the dendrite and reheat re -fined regions in the multi-pass weld deposition existed. The bright areas represented copper and
the dark areas represented aluminium. From Fig -ure 9, it is also observed that the partial copper rich cellular (CRC) network was in the welds. The weld structure contributed to the improve -ments in yield strength through the absence of aligned CRC networks [8]. Typical microstruc -ture of HAZ of both the weldments near fusion line is shown in Figure 11.
The distributed copper rich particles act to strengthen the matrix of the weld. The EDS analysis of the weld also indicated the presence
Fig. 6. Temperature distribution across the width at different time
Fig. 7. Temperature distribution across the plate thickness
of CuAl2 phase in an aluminium matrix Figure 12. Similar observations were reported in EBW of AA2219 alloy [8]. The chemical composition of the weld deposits are presented in Table 3.
The width of heat affected zone was compared for simulated and experimental results as shown in Figure 13. Table 4 shows length of heat af -fected zone from weld centerline. It is confirmed that simulated results comply with experimen -tal results. Figure 14 shows the XRD pattern of GTAW welds. It clearly shows that all the peaks
were corresponding to the Al and small amount of intermetallic compounds like Al2Cu was observed through the XRD pattern.
The base metal shows beta phase (Cu rich) in the matrix and alpha phase (Al rich) it is ob -served that the beta phase is in the form of nearly spherical shape. Further it is observed from mi -crostructure that beta phase is oriented in the one direction. This is due to rolling. Figure 10 shows the weld zone. It is observed that the beta phase is uniformly distributed in the alpha matrix and the slope of the beta phase has found to be fully elongated. From the micro structure shows that the dendritic of alpha phase. The elongated beta phase in alpha dendrite indicates that modular casting of significant during rolling.
CONCLUSIONS
Gas tungsten arc welding of AA2219 alumin -ium alloy was simulated using 3D finite element model on COMSOL multiphysics softrware. The weld bead geomentries were compared for both
Fig. 9. Base metal microstructure
Fig. 11. Typical microstructure of HAZ near to fusion
Table 3. Chemical composition of weld deposits Weld
deposit
Chemical composition/wt% Si Mn Mg Fe Cu Al GTAW 0.02 0.93 0.35 0.19 6.24 Bal.
Table 4. Length of HAZ from weld centerline
Parameter Simulation results Experimental results
Length of heat affected zone from
experimental and simulated results. The compat -ibility of COMSOL software for welding simula -tions was perceived. The following conclusions were drawn from the study.
1. 3568 °C temperature was observed during welding and the temperature profile was pre -dicted by simulations.
2. Gaussian distribution was observed in the transverse direction of temperature profile. 3. In simulation and experimental the half width
of heat affected zone was predicted and the
values are 12 mm and 11 mm. It shows the simulation results were shallow of the experi -mental results.
4. XRD patterns revealed that Aluminum was a major phase, and a small amount of Al2Cu was observed in the weld metal.
Acknowledgements
We acknowledge Shri P.Sankaravelayutham, Dy. General Manager, MMD/MME, VSSC, ISRO, Thiruvanandhapuram-695022 to provide the base material and WRI, BHEL, Trichy, Tam -ilnadu to carry out the welding trials.
REFERENCES
1. Hartman J.A., Beil R.J. and Hahn G.T.: Effect of copper rich regions on tensile properties of VPPA weldments of 2219-T87 aluminuim, Welding Re -search Supplement, 66, 1987, 73-83.
2. Nair B.S.., Rakesh S, Phanikumar G., Prasad Rao K, Sinha P.P.: Fracture toughness (J 1C) of electron beam welded AA2219 alloy, Materials & Design 31 (10), 2010, 4943-4950.
3. Arunkumar S., Rangarajan P., Devakumaran K. and Sathiya P.: Comparative studies on transverse shrinkage, mechanical and metallurgical properties of aa2219 aluminium weld joints by gas tungsten arc and gas metal arc welding processes, Defence Technology, 11, 2015, 262-268.
4. Malarvizhi S., Balasubramanian V.: Effect of weld -ing processes on AA2219 aluminium alloy joint properties, Trans. Nonferrous met. Soc. China 21, 2011, 962-973.
5. Andrés Anca, Alberto Cardona, José Risso, Víctor, Fachinotti D.: Finite element modeling of welding processes, Applied Mathematical Modelling 35, 2011, 688–707.
Fig. 12. EDS results of AA2219 weldments
Fig. 13. Experimental and simulated weld bead
6. Gonçalves C.V., Vilarinho L.O., Scotti A., and Gui -marães G.: Estimation of heat source and thermal efficiency in GTAW process by using inverse tech -niques, Journal of Materials Processing Technol -ogy, 172, 2006, 42-51.
7. Salehi Yegaie Y., Kermanpur A., Shamanian M.: Nu -merical simulation and experimental investigation of temperature and residual stresses in GTAW with a heat sink process of Monel 400 plates, Journal of Ma -terials Processing Technology 210, 2010, 1690–1701. 8. Gupta R.K., Ghosh B.R., Biju S., Sinha P.P.: Weld -ing research supplement-GTAW process design for improved weld strength of AA2219, Australasian Welding Journal 54 (2), 2009, 37-48.
9. Ilegbusi O.J., Iguchi M., Wahnsiedler W.: Mathe -matical and Physical Mod-elling of Materials Pro -cessing Operations. Chapman & Hall/CRC, 2000. 10. Goldak J., Chakravarti A., Bibby M.: A new finite
element model for welding heat sources. Metall.
Trans. B 15, 1984, 299–305.
11. Goldak J., Akhlaghi M.: Computational Welding Mechanics. Springer Science Business Media, New York, 2005, 29–34.
12. Aissani Sofiane Guessasma, Abdelhalim Zitoun, Rabah Hamzaoui, David Bassir, Younes Benked -da: Three-dimensional simulation of 304L steel TIG welding process: Contribution of the thermal flux Mouloud. Applied Thermal Engineering 89, 2015, 822- 832.
13. Abid M., Parvez S., Nash D.H.: Effect of different electrode tip angles with tilted torch in stationary gas tungsten arc welding: A 3D simulation, Inter -national Journal of Pressure Vessels and Piping 108-109, 2013, 51-60.

![Fig. 5. Temperature profiles of welding process [Start to finish]](https://thumb-us.123doks.com/thumbv2/123dok_us/8808402.1775856/6.595.74.528.68.585/fig-temperature-profiles-welding-process-start-finish.webp)