R C
O S
T N
Publisher: Research Council of Science and Technology, Biratnagar, Nepal: p. 70
BIBECHANA
A Multidisciplinary Journal of Science, Technology and Mathematics ISSN 2091-0762 (print), 2382-5340 (online)
Journal homepage: http://nepjol.info/index.php/BIBECHANA
First-principles study of solid methane at high pressure
Nurapati Pantha, Jagaran Acharya, Narayan Prasad Adhikari**
Central Department of Physics, Tribhuvan University, Kathmandu, Nepal
*
E-mail:[email protected]
**
E-mail: [email protected]
Accepted for publication: December 17, 2014
Abstract
We study the structural and electronic properties of solid methane of space group P212121 at high pressure. The density-functional theory (DFT) based first-principles calculations within the Generalized Gradient Approximations (GGA) have been performed by using Quantum Espresso package. Our findings show that the solid methane in orthorhombic structure compresses fast at the first, and then slowly as a function of elevated hydrostatic pressure. The pressure-volume diagram agrees with the available previously reported data up to pressure of around 200 GPa. In orthorhombic structure, solid methane is a wide band gap insulator at low pressures (tens of GPa). The band gap decreases with increase in the pressure. At high pressure (around 900 GPa), the band gap decreases to semi-conductor range (1.78 eV). Our results reveal that methane to be metallic above the pressure coverage of the present study which is consistent to the interior of the giant planets. The band gap as a function of pressure (from the present work) agrees well with the previously reported data.
DOI: http://dx.doi.org/10.3126/bibechana.v12i0.11779 © 2014 RCOST: All rights reserved.
Keywords: Density-functional theory; Solid methane; High pressure; Band gap.
1. Introduction
Methane is an important energy source with a great abundance in nature. It plays a significant role in a planetary physics, being one of the major constituents of giant planets Uranus and Neptune, and also Pluto [1, 2] where it is subjected to high pressure and thousand degrees of temperature [3, 4]. It is anticipated that, methane in both the liquid and solid phases is also present in different outer planets and satellites. Methane is also present in earth's mantle and crust at high pressure and temperature, where it is mainly found in the hydrated form forming a methane clathrate structure. Thus, the knowledge of H2O-CH4 fluid mixtures throughout the wide range of temperature and pressure can
Pantha et al./BIBECHANA 12 (2015) 70-79: p.71
Methane is the simplest alkane, the main component of natural gas, and is probably the most abundant organic compound on the earth, which makes it an attractive natural gas fuel. It is important from the view of petrology also. In addition, it is also used in industrial chemical processes and may be transported as a refrigerated liquid. Gas pipelines, that distribute large amount of natural gas, have methane as principal component. However, being gaseous at normal conditions, methane is difficult to transport from its sources. For the transportation and storage, economical ways, safety and feasibility are always the prime concern. As an alternative technique, adsorption of gases like CH4 and
H2O in modified carbon nano-structures have been studied through DFT calculations [6-9] in recent
time. Methane is also a potent greenhouse gas. The Biological aspect of methane is also important as its concentration is increasing day by day [10]. We know methane is released in atmosphere during methanogenesis process. Furthermore, the knowledge of properties of methane is also important in understanding the abiogenic formation of methane [11, 12]. This increasing concentration of methane has made it necessary and urgent to study its both biological and physical aspects. Methane concentration affects tropospheric ozone chemistry, carbon monoxide concentration, and climatic variations, which ultimately affect the human activities and hence, measures should be taken to reduce its concentration.
Methane is the simplest of all the saturated hydrocarbon compounds. It is tetrahedral molecule with C-H bond 1.09 Å and H-C-H bond angle 109.5o in phase without orientational ordering. In spite of the simplicity of its molecular structure, it has a complex and poorly understood phase diagram [13-24]. Furthermore, depending on the pressure and temperature, different phases are produced due to the degree of freedom of orientations. Solid methane also exhibits a wide variety of phases due to orientational ordering. Recently Hirai et al. [25] has reported wide variety of structures due to difference in orientational ordering ranging from Fcc structure at 1.7 GPa to phase A (rhombohedral or tetragonal structure) at 5.2 GPa, and transforms to phase B(cubic or hcp) at 10-18 GPa and further transforms to (cubic or hcp) at 25 GPa. Zhao et al. [26] suggested a new monoclinic structure P21/b,
with four molecules of methane in a unit cell. This structure is reported to be stable at above 10 GPa upto 90 GPa. Also, their calculations show that it is not metallic until 90 GPa. There is more controversy regarding the phase transition of solid methane which has complex phase diagram. The phase diagram of methane is both rich and intricate, and is poorly understood, which needs a careful investigation. As a first step to understanding the rich and poorly understood phase diagram of solid methane we focus on the one of its stable structures, of space group P212121, in the order of GPa of
pressures. The structure has been searched by ab-initio calculations, which has also been supported by
neutron experiment (at low temperature) for the similar compounds, as mentioned in [27] and references thereby.
In the present work, we present first-principles simulations to determine structural changes and electronic properties of solid methane in P212121 space group. The calculations cover a wide range of
pressure values (10 GPa to 900 GPa) and reveal the change in cell-dimensions/molecular-volume as well as the band structure of solid methane.
Pantha et al./BIBECHANA 12 (2015) 70-79: p.72
2. Computational Details
We have used plane wave self consistent field (PWSCF) implementation of density functional theory (DFT) calculations [28, 29] in quantum espresso package [30]. The interaction between the ion-cores and the valence electrons are accounted by the ultrasoft pseudo-potentials. The plane wave basis set with cut off values of 40 Ry and 520 Ry for wave-functions and charge density respectively, is used through-out the calculations. The exchange and correlations parts of electron-electron interactions are treated by generalized gradient approximation (GGA) as suggested by Perdew-Burke-Ernzerhof (PBE) [31].
Both the internal (atomic co-ordinates) and external (cell dimensions) parameters of solid methane in orthorhombic unit cell, as described by Gao et al., [27] are relaxed for geometrical optimization. The calculations are performed over the first Brillouin zone by using the Monkhorst-Pack scheme with 4× 5 × 8 mesh of K-points. The convergence threshold for self-consistency is considered as 10-7 Ry.
The structural optimization, within the limitations of standard DFT calculations (which assumes zero temperature), has been performed at different pressure values starting from 10 GPa and up to 900 Gpa, in the steps of 10 GPa. The structural parameters, like cell dimensions and volume
of the unit cell are noted, and compared with the available literature. Similarly, band structure calculations at some of the representative pressures are included to specify their electronic properties.
3. Results and Discussion
We have performed variable-cell relaxation of solid methane (in space group P212121) within the DFT
levels of calculation using GGA exchange-correlation functional in quantum espresso package. The unit cell contains four methane molecules in orthorhombic structure, as shown in Figure 1. The unit
cell of solid methane is compressed through a number of steps (of interval 10 GPa) of hydrostatic pressure up to 900 GPa.
The (unit) cell sides of solid methane compress almost by one-third of their original (uncompressed) values a = 7.81 Å,b = 7.46 Å and c = 5.35 Åuntil reaching up to 50 GPa of pressure (not shown in
figure). This implies the high rate of hardening of the structure at low pressures values. At moderate pressures, just above 50 GPa, the rate of compression decreases comparing to that at lower pressures, however, has sufficient space for further compression. Within the range of pressure covered in Figure
2 (50-900 GPa), we can notice that the cell-sides compress a bit faster at the moderate pressures and
become harder and harder for further compression at higher pressures. With pressure, the sides of the unit cell decrease.
Percentage decrease on the cell sides at the pressure of 200 GPa, with respect to the values at 50 GPa, are found to be 12.84 %, 13.90 % and 12.94 % for sides a, b and c respectively. Similarly, the
Pantha et al
Fig. 1.: Solid methane in orthorhombic structure
molecules, and the structure is compressed by hydrostatic (homogeneous) pressure (P). The figure contains two unit cells in every direction (2
Fig. 2: Compression of cell-dimensions with the elevated pressure. The cell parameters are compressed monotonically in all the directions.
Pantha et al./BIBECHANA 12 (2015) 70-79: p.73
thane in orthorhombic structure [27]. Every unit cell has four methane molecules, and the structure is compressed by hydrostatic (homogeneous) pressure (P). The figure contains two unit cells in every direction (2× 2 × 2 supercell) for the clear illustration.
dimensions with the elevated pressure. The cell parameters are compressed monotonically in all the directions.
Every unit cell has four methane molecules, and the structure is compressed by hydrostatic (homogeneous) pressure (P). The
2 supercell) for the clear illustration.
Pantha et al./BIBECHANA 12 (2015) 70-79: p.74
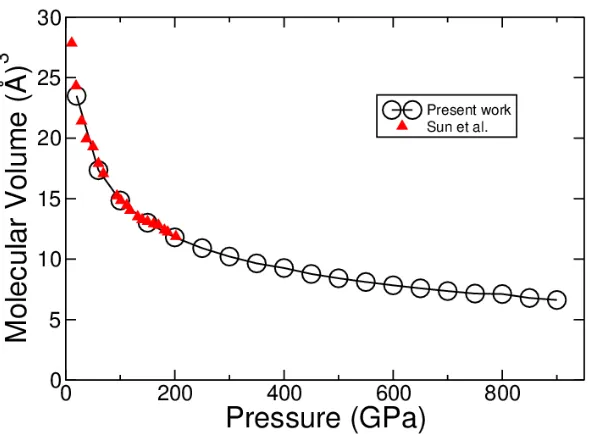
Fig. 3: Compression of molecular volume of methane with elevated pressure. The volume decreases faster at lower pressures where as compression becomes slower while moving up towards higher pressures. The black line with open circles represent the values from the present calculations where as red up-triangles represent those taken from the experimental equation of state [32].
To check the pressure-volume relation of the compressed system, we compare the P-V diagram of the present work with that obtained from Brich-Murnaghan Equation of state (EOS) [32],
(
)
− − + − = − − − 1 4 4 3 1 23 2/3
0 ' 3 / 5 0 3 / 7 0 0 V V B V V V V B
P o (1)
In Eq. (1), B0 is the isothermal bulk modulus at zero pressure, B'0 is the pressure derivative of B0 at
zero pressure and (V/V0) is the ratio of the volume at high pressure to that at zero pressure. On
comparing our data for pressure-volume values to that obtained in [32] by using experimental EOS mentioned in Eq. (1), we notice that our calculations agree very well with the reported values (Figure
3).
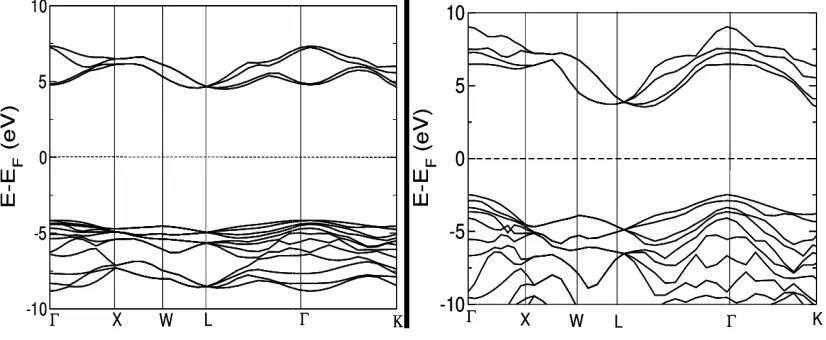
To study the effect of elevated pressure on the electronic structure of solid methane, we performed the band structure calculations at various pressure values. The band structures at representative pressures (20 GPa, 200 GPa and 550 GPa) are shown in Figure 4. The figures illustrate that solid methane has
Pantha et al
with pressure. Due to compression, the distance between different atoms decreases and hence the probability of overlapping of different molecular orbitals increases. The estimated band gap values agree with the previously reported (simulated) values within 20%
understood on the difference between the methods used.
Fig. 4: The band gap decreases with the elevated pressure. Figures from left to right represent the band structure calculations at 20, 200 and 550 GPa
Pantha et al./BIBECHANA 12 (2015) 70-79: p.75
pressure. Due to compression, the distance between different atoms decreases and hence the probability of overlapping of different molecular orbitals increases. The estimated band gap values agree with the previously reported (simulated) values within 20%. The slight difference can be understood on the difference between the methods used.
The band gap decreases with the elevated pressure. Figures from left to right represent the band structure calculations at 20, 200 and 550 GPa respectively.
pressure. Due to compression, the distance between different atoms decreases and hence the probability of overlapping of different molecular orbitals increases. The estimated band gap values . The slight difference can be
Pantha et al./BIBECHANA 12 (2015) 70-79: p.76
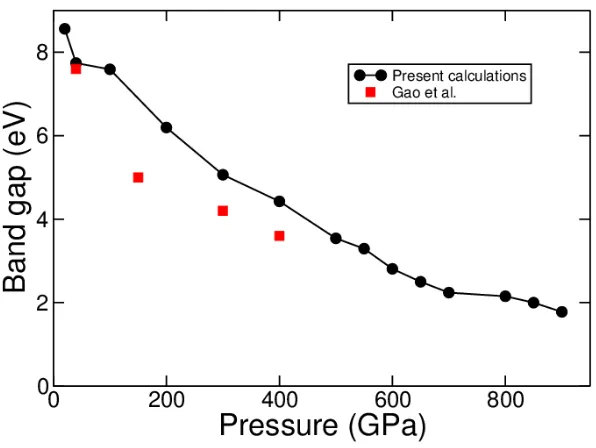
Fig. 5: The band gap decreases with the elevated pressure. The band gap form the present calculations at low pressure agree well with the references and where as deviation increases on increasing pressure. The computed reference values are within 20% of the present calculations (up to 400 GPa) [27].
4. Conclusions and Concluding Remarks
The structural and electronic properties of solid methane have been studied by using DFT levels of calculations in quantum espresso package. The structural analysis shows that the cell parameters of the unit cell compress fast at the first and then a bit slowly as a function of pressure. At higher pressures ( > 200 GPa), the longest cell-side compresses more than the others. Also the molecular volume of methane decreases fast at low pressures and slowly at higher pressures. The molecular volumes from the present calculations agree well with the available range of previously reported values. The band gap of the solid methane decreases on increasing pressure. Present calculations predict that solid methane is a large gap insulator at low pressures and comes to semi conductor range (1.78 eV) at 900 GPa. It also implies that it may become metallic above the coverage of the present calculations. Future study will include the study of complete phase diagram of solid methane at various temperatures and pressures.
Acknowledgements
Pantha et al./BIBECHANA 12 (2015) 70-79: p.77
References
[1] S. Protopapa, H. Boehnhardt, T. M. Herbst, D. P. Cruikshank, W. M. Grundy, F. Merlin, and
C. B. Olkin, Astron. Astrophys, 490 (2008) 365.
http://dx.doi.org/10.1051/0004-6361:200809994
[2] S. Doute, B. Schmitt, E. Quirico, T. Owen, D. Cruikshank, C. de Bergh,T. Geballe, and T.
Roush, Icarus 142 (1999) 421.
http://dx.doi.org/10.1006/icar.1999.6226
[3] W. B. Hubbard, W. J. Nellis, A. C. Mitchell, N. C. Holmes, S. S. Limaye, and P. C. McCandless, Science 253 (1991) 648.
http://dx.doi.org/10.1126/science.253.5020.648
[4] W. B. Hubbard and J. J. MacFarlane, J. Geophys. Res. 85 (1980) 225.
http://dx.doi.org/10.1029/JB085iB01p00225
[5] C. Zhang, Z. Duan, and Z. Zhang, Geochimica et Cosmochimica Acta, (2007) 2036.
http://dx.doi.org/10.1016/j.gca.2007.01.017
[6] B. C. Wood, S. Y. Bhide, D. Dutta, V. S. Kandagal, A. D. Pathak, S. N. Punnathanam, K. G.
Ayappa, and S. Narasimhan, J. Chem. Phys. 137 (2012) 054702.
http://dx.doi.org/10.1063/1.4736568
[7] S. Lamichhane, N. Pantha and N. P Adhikari, Bibechana 11(1), (2014) 107.
http://dx.doi.org/10.3126/bibechana.v11i0.10389
[8] N. Pantha, K. Belabase and N. P. Adhikari, Appl. Nanosci. (available online).
[9] N. Pantha, A. Khaniya and N. P. Adhikari, (submitted in a peer-reviewed journal).
[10] R. J Ciceron and R.S. Oremland, Global Biogeochemical cycles 2 (1988) 299.
http://dx.doi.org/10.1029/GB002i004p00299
[11] H. P. Scott et al. Proc. Nalt.Acad. Sci. U.S.A. 101 (2004) 14023.
http://dx.doi.org/10.1073/pnas.0405930101
[12] A. Kolesnikov, V. Kutcherov, and A. F. Goncharov, Nature Geosci. 2 (2009) 566.
http://dx.doi.org/10.1038/ngeo591
[13] M. M. Thiery, D. Fabre, and K. Kobashi, J. Chem. Phys. 83 (1985) 6165.
http://dx.doi.org/10.1063/1.449612
[14] J. H. Wieldraaijer, J. A. Schouten, and N. J. Trappeniers, High Temp. High Pressures 15
(1983) 87.
[15] M. A. Neumann, W. Press, C. Nȍldeke, B. Asmussen, M. Prager, and R. M. Ibberson,
Pantha et al./BIBECHANA 12 (2015) 70-79: p.78
http://dx.doi.org/10.1063/1.1580809
[16] R. M. Hazen, H. K. Mao, L. W. Finger, and P. M. Bell, Appl. Phys. Lett. 37, 288 (1980).
http://dx.doi.org/10.1063/1.91909
[17] S. K. Sharma, H. K. Mao, and P. M. Bell, Carnegie Institution of Washington Yearbook
79 (1980) 351.
[18] H. J. James and T. A. Keenan, J. Chem. Phys. 31 (1959) 12.
http://dx.doi.org/10.1063/1.1730276
[19] T. Yamamoto, Y. Kataoka, and K. Okada, J. Chem. Phys. 66 (1977) 2701.
http://dx.doi.org/10.1063/1.434218
[20] S. Umemoto, T. Yoshii, Y. Akahama, and H. Kawamura, J. Phys.: Condens. Matter 14
(2002) 10675.
http://dx.doi.org/10.1088/0953-8984/14/44/355
[21] R. Bini and G. Pratesi, Phys. Rev. B 55 (1997) 14800.
http://dx.doi.org/10.1103/PhysRevB.55.14800
[22] R. Bini, L. Ulivi, H. J. Jodl, and P. R. Salvi, J. Chem. Phys. 103 (1995) 1353.
http://dx.doi.org/10.1063/1.469810
[23] W. Press, J. Chem. Phys. 56 (1972) 2597.
http://dx.doi.org/10.1063/1.1677586
[24] R. M. Hazen, H. K. Mao, L. W. Finger, and P. M. Bell, Appl. Phys. Lett. 37 (1980) 288.
http://dx.doi.org/10.1063/1.91909
[25] H. Hirai, K. Konagai, T. Kawamura, T. Yamamoto, and T. Yagi, Chem. Phys. Lett. 454
(2008) 212.
http://dx.doi.org/10.1016/j.cplett.2008.01.082
[26] J. Zhao, W-X. Feng, Z-M. Liu, Y-M. Ma, Z. He, T. Cui, G-T. Zou, Chin. Phys. Lett. 27(6)
066101 (2010).
http://dx.doi.org/10.1088/0256-307X/27/6/066101
[27] G. Gao, A. R. Oganov, Y. Ma, H. Wang, P. Li, Y. Li, T. Iitaka, and G. Zou, J. Chem. Phys.
133 (2010) 144508.
http://dx.doi.org/10.1063/1.3488102
[28] H. Hohenberg and W. Kohn, Phys. Rev. B 136 (1964) 864.
http://dx.doi.org/10.1103/PhysRev.136.B864
Pantha et al./BIBECHANA 12 (2015) 70-79: p.79
http://dx.doi.org/10.1103/PhysRev.140.A1133
[30] P. Giannozzi et al., J. Phys.: Condens. Matter 21 (2009) 395502.
http://dx.doi.org/10.1088/0953-8984/21/39/395502
[31] J.P. Perdew, K. Burke, and M.Ernzerhof, Phys. Rev. Lett. 77 (1996) 3865.
http://dx.doi.org/10.1103/PhysRevLett.77.3865
[32] L. Sun, W. Yi, L. Wang, J. Shu, S. Sinogeikin, Y. Meng, G. Shen, L. Bai, Y. Li, H-K. Mao, W. L. Mao, Chem. Phys. Lett. 473 (2009) 72.