University of Redlands University of Redlands
InSPIRe @ Redlands
InSPIRe @ Redlands
MS GIS Program Major Individual Projects Theses, Dissertations, and Honors Projects 8-2008
Route Planning: Winter Applications
Route Planning: Winter Applications
Brett Vernon Bingham
University of Redlands
Follow this and additional works at: https://inspire.redlands.edu/gis_gradproj
Part of the Geographic Information Sciences Commons, and the Urban Studies and Planning
Commons
Recommended Citation Recommended Citation
Bingham, B. V. (2008). Route Planning: Winter Applications (Master's thesis, University of Redlands). Retrieved from https://inspire.redlands.edu/gis_gradproj/9
This work is licensed under a Creative Commons Attribution 4.0 License. This material may be protected by copyright law (Title 17 U.S. Code).
This Thesis is brought to you for free and open access by the Theses, Dissertations, and Honors Projects at InSPIRe @ Redlands. It has been accepted for inclusion in MS GIS Program Major Individual Projects by an authorized administrator of InSPIRe @ Redlands. For more information, please contact [email protected].
University of Redlands
Route Planning:
Winter Applications
A Major Individual Project submitted in partial satisfaction of the requirements for the degree of Master of Science in Geographic Information Systems
by
Brett Vernon Bingham
James Ciarrocca, M.S., Committee Chair Douglas M. Flewelling, Ph.D.
Route Planning: Winter Applications
Copyright © 2008 by
ACKNOWLEDGEMENTS
I am a man of few words, but I would like to thank my wife, Annie. Without her willingness to sacrifice we would not have been able to come on this adventure for my Masters Program. My advisor, Jim, kept pushing me to do my best. He wouldn’t let me give up. My class mates treated each other like family encouraging one another to succeed. This was a memorable event.
ABSTRACT
Route Planning: Winter Applications
by
Brett Vernon Bingham
Multiple professions require the proficiency of accurately calculated routes. The use of efficient snow plow routes is essential for clearing the streets in a cold-climate
metropolis. For this case study of snow plow routing for the city of Washington, D.C., man-made geographic boundaries were analyzed to determine their influential role in generating resourceful routes. Complex variables, such as turning impedances, multiple passes and many more, were input into a geographic information system (GIS) in order to test the software’s capabilities. The GIS software created reliable results for adequately clearing the streets of Washington, D.C.
Table of Contents
1. Introduction... 1 1.1. Client ... 1 1.2. Problem Statement ... 2 1.3. Proposed Solution ... 2 1.3.1. Objectives ... 3 1.3.2. Scope... 3 1.4. Audience... 3 1.5. Organization of Report... 3 2. Background ... 5 2.1. Graphs ... 5 2.2. Networks ... 5 2.2.1. Edges... 6 2.2.2. Junctions ... 6 2.2.3. Turn Restrictions... 8 2.2.4. Directionality ... 8 2.2.5. Cost of Travel ... 9 2.3. Routing ... 10 2.3.1. Shortest Path ... 102.3.2. Route Inspection Problem... 10
2.3.3. Traveling Salesman Problem ... 11
2.3.4. Closest Facility... 11 2.4. Algorithms... 12 2.5. Routing Applications... 12 3. Requirements Analysis ... 15 3.1. Functional Requirements... 15 3.2. Non-functional Requirements ... 17 3.3. System Architecture ... 18 4. Methodologies... 19 4.1. Training ... 19 4.2. Research ... 19 4.3. Solutions... 19 4.4. Deliverables... 22 4.5. Testing Parameters ... 22 5. System Design ... 27 5.1. System Description ... 27 5.2. Software Design ... 32 6. Results... 35 7. Conclusions... 41 7.1. Recommendations ... 41 7.2. Future Work ... 41 8. References... 43 Appendix A... 45
List of Figures
Figure 2-1. Street Network. ... 6
Figure 2-2. Edges of a Street Network... 6
Figure 2-3. Typical Town Junctions of a Street Network... 7
Figure 2-4. Typical Rural Junctions of a Street Network. ... 7
Figure 2-5. Typical Street Intersection. ... 8
Figure 2-6. Network Directionality... 9
Figure 2-7. Cost attributes of Travel... 10
Figure 2-8. Closest Facility Routing... 11
Figure 3-1. System Architecture for Snow Plow Routing. ... 18
Figure 4-1. Washington D.C.'s Existing Snow Plow Zones. ... 20
Figure 4-2. Light Snow Plow Street Responsibilities... 21
Figure 4-3. A RouteSmart Menu for Routing Options, General Tab. ... 23
Figure 4-4. A RouteSmart Menu for Routing Options, Advanced Balancing Tab... 24
Figure 5-1. RouteSmart Import Wizard for Snow Plow Facilities. ... 28
Figure 5-2. Required Fields for the RouteSmart Software. ... 29
Figure 5-3. General Turning Impedances. ... 29
Figure 5-4. Plow Speed Customization. ... 30
Figure 5-5. Menu to Create the Street Service Locations... 31
Figure 5-6. A RouteSmart Menu for Routing Options, Facilities Tab. ... 32
Figure 6-1. Washington, D.C. Snow Plow Zones... 35
Figure 6-2. Add Extra Route Option... 39
List of Tables
Table 3-1a. Functional Requirements for Snow Plow Routing. ... 16Table 3-1b. Functional Requirements for Snow Plow Routing... 17
Table 3-2. Non-functional Requirements for Snow Plow Routing... 17
Table 6-1. Test Results for the Routing Parameters. ... 36
Table 6-2. Test Results for Zone 12... 37
Table 6-3. Grouped Statistics... 38
Table 6-4. Routing Results for Extended Tests. ... 39
Table 6-5. Group Statistics for Test #9 and Test #19. ... 40
Appendix Table 1. SPSS Sample T Test Results for all Testing Scenarios. ... 45
1.
Introduction
Route planning is an intriguing subject. Planning routes is an important daily activity for many people and methods of route planning are used even if it is done subconsciously. An example of this is the checkout lines at a store. Shoppers scan the horizon to search for the shortest line or the fastest checker. Their objective is to have their items purchased with minimal delay. Trying to find the shortest route or the least costly path is inherent to the human mind.
Whether navigating a personal vehicle or a fleet of trucks, most people want to identify the shortest and fastest routes. Some circumstances, however, may require traversing all routes within a street network. In the case of snow plowing or street sweeping, for example, it is difficult to find the most effective routes due to the intricacies of a street network.
There are many complex variables to consider when conducting these types of routing using elaborate street patterns. In the case of snow plowing, variables include multiple passes for the snow plow equipment, the directionality of traffic on the streets, and end points (e.g., cul-de-sacs) (Goodchild, 1998). A routing application also needs to consider the complexities of winter applications, including diverse weather conditions together with the varied characteristics of different snow plow equipment.
The complexities of routing can be mitigated by the use of a geographic information system (GIS). Because GIS is a tool that can display, analyze and create geographic data, it can also help locate the best routes. This document outlines the development and completion of a unique routing project that utilizes snow plows within geographic boundaries. The project involves a case study for snow plowing, implementing street service routing within a GIS environment using detailed street data from the city of Washington, D.C. and ArcGIS software developed by Environmental Systems Research Institute, Inc. (ESRI). The purpose of this project was to analyze the usefulness of
existing snow plow zones and find efficient snow plow routes for the city of Washington, D.C.
1.1. Client
The client for this project was RouteSmart Technologies Inc. of Columbia, Maryland. They have been in the routing profession for over 25 years. RouteSmart is a supplier of GIS software for efficient routing (RouteSmart Technologies, 2007). Their software technology has enabled them to provide solutions throughout a variety of industries in cooperation with businesses and governmental agencies both locally and internationally. RouteSmart Technologies provided the add-on software to ArcGIS. RouteSmart for ArcGIS was used to analyze the street network for the Washington, D.C. area. RouteSmart Technologies also provided software training, technical support, and experienced guidance throughout the project.
The city of Washington, D.C. and the District Department of Transportation (DDOT) were the beneficiary clients. The city of Washington and the District of Columbia
uniquely share the same boundary and population of 572,059, with a surrounding metropolitan population of 4,923,153 at the 2000 census (Encyclopaedia Britannica, 2007).
The city of Washington, D.C. provided all of the required GIS data (i.e., street network with attributes). They also provided the existing snow plow zones to analyze. DDOT provided the fleet information (i.e., the size and capacity of available trucks) and the business rules or the regulatory guidelines (i.e., the time allowed to finish the plow routes).
Washington, D.C. has invested heavily in a GIS framework with accurate street and parcel data and a competent staff experienced in GIS applications. Therefore, solving a problem within a GIS program provided the client useable and understandable solutions.
1.2. Problem Statement
Snow plow routing is unique when compared to other types of routing applications, such as garbage collection or street sweeping. When the streets are not plowed in a timely manner, travel throughout the city is delayed. Citizens may complain if their streets have not been swept in a while or if their garbage was not picked up on the allotted day, but these do not present a severe or immediate hazard. However, snow left on the streets generally turns into ice, magnifying already dangerous conditions. Therefore prompt snow plowing is critical for public safety.
The available snow removal equipment for Washington, D.C. was not equally dispersed among the current snow plow routes. It could take over an hour to travel from one end to the other of a city this large. Consequently, when one snow plow driver finishes the assigned route early, it is not advantageous for that driver to meander throughout the city in order to help another driver on the other side of town. There are many variables when routing for a major city, which make it difficult and time consuming to organize without the aid of computer software. There were various road sizes and assorted characteristics of snow plow equipment that were challenging to juggle when planning routes.
The officials for the city of Washington, D.C. have realized the importance of clear roads. Within the past year the city has acquired twice the inventory of snow removal
equipment. Their hope is that this increase will help the city clear the roads in a timely manner. Although this increase may help, it has the potential to add to the problem if not managed correctly, as unorganized routes will not become effective with an increase of equipment alone. They now need to reorganize their existing snow plow routes to better deploy this increased fleet.
1.3. Proposed Solution
Previous studies have suggested that geographic information systems produce more efficient routes than routes fabricated by humans (Bodin & Kursh, 1978; Sahoo, Kim, Kim, Kraas, & Popov, 2005; Wigglesworth, 2003). Based on the results attained by these previous researchers, this study did not seek to perform additional comparisons between
GIS routes and man-made routes. Rather it was a study of whether existing man-made boundaries would help or hinder the solutions generated by a GIS application.
The purpose of the project was to evaluate efficiency of the existing snow plow zones in generating routes. The information provided by the city about the zones and the snow plows were then used to model the parameters for the routes generated by the GIS software.
1.3.1. Objectives
The objective of this project was to find more efficient snow plow routes for the city of Washington, D.C. utilizing the RouteSmart Software, and to analyze the usefulness of the existing snow plow zones. This snow plow routing project was developed with the
RouteSmart software. This existing software utilized data that had been prepared by the city of Washington, D.C. The software supplies a pure mathematical solution to provide the best routes with streets being minimally traveled, but visually the routes are scattered. The software also offers clustered routes that may require more back-tracking.
1.3.2. Scope
The scope of the project was to produce a subset of efficient snow plow routes for the city of Washington, D.C. The required data was provided by the city officials along with the regulatory guidelines of the District Department of Transportation. Several routing scenarios were created using various options within the software as explained further in Section 4.5 – Testing Parameters. These parameters were different values to control the compactness of the routes along with the repeat travel along the roads. Analysis of these scenarios was done in order to determine if the existing snow plow boundaries were helpful in generating the snow plow routes.
1.4. Audience
The city of Washington, D.C. and the District Department of Transportation benefited from the work of this project, because it gave them an understanding as to how best to generate routes. RouteSmart Technologies also gained a better comprehension as to how their software operates with man-made boundaries. Others who would like to enrich their understanding of routing applications would also benefit from the work of this project.
1.5. Organization of Report
Sections 2 through 5 review the types of networks and routing, the client’s requirements for completing the project, the methodologies of how the project was completed, along with the project design. Section 6 discusses the results of the project, followed by the conclusions in Section 7.
2.
Background
Routing is the sequencing of objects in a network to allow flow or travel. Complex routing inside a city requires a smart street network (Goodchild, 2000). This means in order for routing to work properly, the software needs, as input: the width of the road, the number of lanes, the direction of the road, and the priority of the street. This type of routing is an edge-based, side-of-street routing, also considered a Chinese postman problem (Bodin & Kursh, 1978; Li & Eglese, 1996), named after the Chinese mathematician, Mei Ko Kuan. Edge-based and side-of-street routing refer to routing focused on the streets more than the points connecting them.
In a large city, routing involves managing high-density complex routes. Specific to snow plowing, almost all roads are too wide to be plowed with just one pass, even one-way streets. The majority of streets need to be traveled at least two times. Snow plow
configurations also vary: width of plow, strength of the vehicle, and capacity for holding and dispersing salt. These varied attributes add to the complexity of routing.
2.1. Graphs
In graph theory, a graph is a group of junctions connected by edges. One type of graph is a tree graph (Encyclopaedia Britannica, 2008). There is only one path from any two junctions or vertices for a tree graph. An example of a tree graph would be a stream network. There is only one path for the water to flow from the intersection of the Snake River and the Clearwater River to reach the Pacific Ocean. On the other hand, a digraph is a type of graph with multiple possibilities between any two vertices. A street network is an example of a digraph where direction is identified on each edge. The direction is an important attribute because it creates ostensibly unlimited options for the route of the snow plows. Route planning uses the directionality of a network to determine the maximized proficiency for each route.
2.2. Networks
Networks are the basis for routing. Chang (2004) states that “a network is a line coverage, which is topology-based, and has the appropriate attributes for the flow of objects such as traffic” (p. 350). Wade and Sommer (2006) define a network as “an interconnected set of points and lines that represent possible routes from one location to another. …this
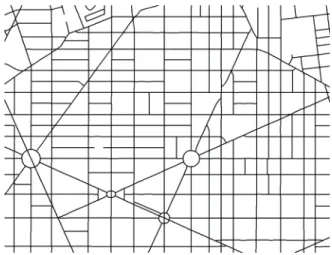
consists of edge, junction, and turn elements and the connectivity between them” (p. 143). There are many types of networks: social, physical, and mental. A social network is the association between people. For example, law enforcement officers investigate who suspect criminals associate with and who those people associate with in order to piece the puzzle together. An example of a mental network would be the nervous system in a being, the nerves serve as the communication lines for messages to and from the brain. A physical network as represented by streets is the type of network required for snow plow routing (see Figure 2-1).
Figure 2-1. Street Network.
2.2.1. Edges
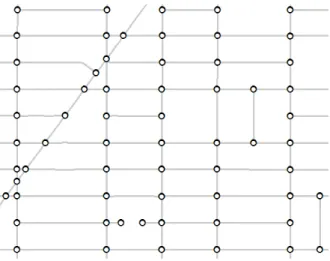
The lines that make up a network are referred to as edges. In transportation networks these edges are the streets, as seen in Figure 2-2. Each edge is a road segment between intersections or junctions. Problems that focus on the edge more than the junctions are referred to as arc routing problems. It is important to identify the correct attributes for each edge when solving arc routing problems. Examples of these attributes are: distance, directionality, number of lanes, and travel speed.
Figure 2-2. Edges of a Street Network.
2.2.2. Junctions
Junctions are the nodes connecting edges. Cities are the junctions between major roadways at a small scale. At a large scale, however, junctions are the intersections of streets. Less back tracking along roads can be accomplished with town junctions compared to rural junctions. Within a city most junctions connect four edges as seen in Figure 2-3.
Figure 2-3. Typical Town Junctions of a Street Network.
Figure 2-4 shows that commonly in rural areas, there is a higher percentage of T-junctions (Eglese & Li, 1992). There are also fewer connectivity choices within a rural area which generates more backtracking.
Figure 2-4. Typical Rural Junctions of a Street Network.
Node-to-Node routing does not need detailed information along the edges because the “demand only occurs at the vertices or nodes of a network” (Li & Eglese, 1996, p. 217). In the case of shipping cargo, the merchandise will only be loaded or unloaded at the harbors, not along the route. Therefore, information about the route is not the concern, only the starting and finishing destinations.
2.2.3. Turn Restrictions
A street network is a representation of the roads found on the surface of the earth. A simple collection of edges and junctions could not justifiably be used to characterize the way traffic flows along roads. Attributes such as turn restrictions are needed to enhance the network model by identifying where turning is discouraged or prohibited.
There are several situations which change the impedance of a turn. Junctions that have all the edges sharing the same priority (e.g. stop lights or four-way stop signs) will have different turning restrictions in comparison to the other intersections. For stop lights, right turns would be faster than the other turns (i.e. left, straight, or u-turn) due to the ability to turn right on a red light. Other intersections generally have one road that has the right-of-way over the other. For these junctions, the road with the right-of-right-of-way would not have a time delay going straight, but would need to slow down to make a right turn and possibly stop and wait to make a left turn if there is oncoming traffic. The other road with the stop sign would be able to turn right easily, but would have to wait to go straight or turn left (see Figure 2-5).
Figure 2-5. Typical Street Intersection.
Some turns are prohibited due to directionality or, in the case of u-turns, municipality law. Other turns are prevented by barriers such as an overpass and underpass. These barriers need to be identified because turning is not an option. A better understanding of the turning restrictions at each junction in a network will provide a more enhanced ability to model the real streets.
2.2.4. Directionality
Roads that limit the course of travel to one direction are referred to as one-way streets. These roads occur most frequently in dense urban areas. They are also common with
interstate freeways or divided highways where both directions of traffic are separated by a barrier or a median. Simple networks will not indicate one-way streets, nor will they illustrate freeways as a pair of one-way edges, but as a single two-directional edge. The level of detail in a network will be influenced by the specific application for which it is intended (Chang, 2004). Figure 2-6 displays the possible directions that networks can offer.
Figure 2-6. Network Directionality.
2.2.5. Cost of Travel
Associated with each edge is a cost of travel. The distance, speed limit, or surface type of the road could be a cost factor that would determine its travel efficiency. For example, more fuel would be used by a semi-truck hauling a heavy load going up and over a hill as opposed to driving a few extra miles on flat ground around the hill. When adding these cost attributes to a street network, the shortest distance is not always the most efficient (see Figure 2-7).
Figure 2-7. Cost attributes of Travel.
2.3. Routing
In order to study a routing problem, the most common types of routing need to be understood. These are: shortest path, route inspection problem, traveling salesman problem, and closest facility routing. Bodin and Kursh (1978) indicate that “a route for a vehicle is defined as the order of covering or servicing a specified collection of entities” (p. 526). In the case of this snow plowing project, the entities to be serviced are the streets themselves.
2.3.1. Shortest Path
One possible result of a network query is an optimal path, which would find the most advantageous course through a collection of linked edges (Tomlinson, 2007). The
shortest path would be traveling from point A to point B as quickly as possible. This type of routing is based on attributes of the road centerline. The length and connectivity of road segments are the most important attributes of shortest path routing. The width of the street is not considered. Knowing the speed limit may be helpful, but this is not a
requirement.
2.3.2. Route Inspection Problem
The opposite type of routing to shortest path would be a high-density, complex route. The route inspection problem, often referred to as the Chinese postman problem, would ensure that every street in a city has been traveled. Now it is not necessary to go from point A to point B, but to make sure that every side of the street has been visited. Most cases would even require multiple trips down the street to cover all the lanes of traffic. Bodin and Kursh (1978) point out that there are two ways to solve a network routing problem: clustering and routing. The clustering method divides the city into clusters or groups and then approaches each cluster individually. The routing method finds a solution for the entire city and then divides that route into multiple routes. There are benefits and drawbacks to both methods. The first will increase the amount of
deadheading, or non-productive travel, due to increased boundary edges. It will, however,
provide compact jurisdictions which are easier for administration. The second method will develop more overlapping routes which are harder to manage, but will reduce the deadhead distance traveled.
2.3.3. Traveling Salesman Problem
A difficult type of the shortest path routing is the traveling salesman problem. This requires the salesman to pass through each destination only once and then return to the starting location (Chang, 2004). United Parcel Service (UPS) has been solving their traveling salesman problem for their trucks and their planes using computer software programs developed specifically for their routing needs. According to UPS, tens of millions of dollars have been saved through the use of their routing software (The Economist, 2007).
2.3.4. Closest Facility
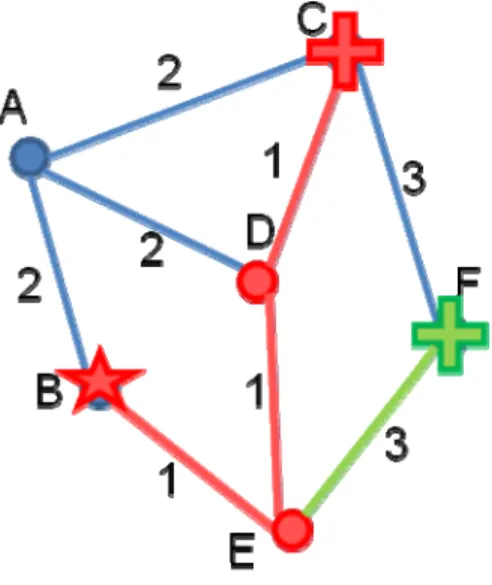
Another type of shortest path routing is the closest facility algorithm. This requires the shortest path to be calculated from each facility to the desired location, and then the closest facility is chosen. One example of this type of routing is for emergency response situations. When a call comes to a 911 call center they need to find the closest emergency response team available to take action (Eichelberger, 2002). To do this, the shortest path is calculated to each available response team and the closest one is dispatched (see Figure 2-8).
2.4. Algorithms
Step-by-step procedures, referred to as algorithms, have been derived to process data faster because humans cannot do it fast enough (The Economist, 2007). These algorithms benefit companies with large amounts of data. A city with an intricate street network is no exception. Bodin and Kursh (1978) found that “computationally efficient
algorithms…can be developed for solving routing problems” (p. 526).
According to the Economist (2007), algorithms will find the right result even if it does not look correct.
The inputs have to be right. One UPS planning model routed all the
packages in the system through Iowa, which perplexed everyone until they found an error in the data that made it appear to be free to send packages via Iowa. The algorithm was right, in other words, but the data were wrong. (Rocket science for non-boffins section, ¶ 1)
In the case of vehicle routing, algorithms are an iterative process for finding the minimal time sequences of traversing the streets. The algorithm calculates one solution and then a second solution to compare to the first and selects the most efficient. It then continues calculating multiple solutions, retaining the best solution, until the specified iterative threshold has been reached.
2.5. Routing Applications
Route planning is accomplished by analyzing the connectivity of lines which are the basis of a network. Geographic information systems can analyze a variety of physical networks (Borruso, 2003). For example, routing has been used for trucks hauling HAZMAT’s (hazardous materials) for decades. When adequate routes are established between two points, change is unnecessary. Nevertheless, considering the tragic events of September 11, 2001, several HAZMAT transporters have had to reevaluate their routes due to the increased necessity for security (Huang, Cheu, & Liew, 2004). The use of GIS helped them plan new routes to provide more secure travel.
Although route planning is widely used, organizing daily routes is not an insignificant task (Sahoo, Kim, Kim, Kraas, & Popov, 2005). It is particularly complex when calculating manually (Bodin & Kursh, 1978). For example, after GIS was added to the route planning of a Sears delivery distribution center, the company was able to cut back the time spent meticulously routing delivery trucks. It normally took long hours for several employees at each distribution center to arrange the daily routes. At present, with the help of GIS, one person can supervise the software to obtain routes for several
regional centers (Mitchell, 1998). Even though simple problems can be solved with paper maps, GIS can add value by making dynamic maps (Wigglesworth, 2003).
Sanitation collection is another facetthat can be assisted by GIS. Fairfax County,
Virginia approximated a yearly savings of $200,000 using RouteSmart (House, 2000). A similar software package resulted in savings of $18 million for Waste Management Inc. (WM) in 2003 after the software was initiated. WM Inc. had a projected savings of $44 million the following year due to the benefits of their GIS software (Sahoo, Kim, Kim,
Kraas, & Popov, 2005). Efficient routes created by a GIS program can help the city of Washington, D.C. save money in a similar fashion.
3.
Requirements Analysis
The administrators for the Public Works Department for the city of Washington, D.C. spent long logistical hours overseeing the division of geographic space in order to efficiently manage the snow clearing process. When introduced to this routing project, the city administrators did not want to abandon their hard workso a project initiation meeting was held to identify the needs of the client. Washington, D.C. officials expressed a need for more efficient snow plow routes in order to reduce overall costs. In discussing the current snow plow zones, a question was raised about how the boundaries were selected. The geographical boundaries were found to be man-made. Further questions regarding whether these boundaries were in the right place or if these zones would hinder the software in creating routes were also considered. Direct communication with all the clients assisted in completing the requirements analysis.
In other venues Mayor Adrian M. Fenty of Washington, D.C. had expressed a need for more time-efficient snow plow routes in order to clear the roads faster. He had also indicated that the budget should not be the concern of those responsible for the streets. Therefore, Mayor Fenty approved the acquisition of more snow plow equipment in order to help speed up the snow clearing process (Silverman, 2008). These comments were also considered within the context of this project.
3.1. Functional Requirements
Through communication with the clients, a list of the functional requirements was organized to identify what the RouteSmart software package needed to perform snow plow routing (see Table 3-1). These requirements were necessary for the actual snow plowing process to be accurately represented in order for the software to generate applicable results.
Table 3-1a. Functional Requirements for Snow Plow Routing.
Number Category Requirement Description
1.1.0 Input Streets There shall be a street network with the following sub categories defined
1.1.1 Input Connectivity The street network shall have the streets connected with the topology defined
1.1.2 Input Turn
Exceptions Turning impedances shall be provided
1.1.3 Input Number of lanes
The number of lanes shall be provided as an attribute
1.1.4 Input Priority Priority level of streets shall be stated
1.2.0 Input Plows Operational attributes of the snow plows must be known
1.2.1 Input Salt The capacity to hold salt shall be known as well as the spread rate for each truck
1.2.2 Input Speed Driving speed (plow up) and the plowing speed of each truck shall be known
1.2.3 Input Snow
The amount of snow on the ground must be known because it affects the speed of the
snow plow vehicles
1.3.0 Input Facilities Facility locations must be known
1.3.1 Input Number of Plows
The number of plows at each facility must be known
2.1.0 Tasks Prepare Data
The input data must be in a GIS format suitable to the GIS software in order for the
spatial problem to be solved
3.1.0 Calculations Effective Routes
Multiple iterations shall be performed to compare the effectiveness of each calculation
3.1.1 Calculations Shortest Path
The sequencing of the streets per route shall be done in a manner to reduce the total
distance traveled
3.1.2 Calculations Least Time The routes shall be balanced based on the overall time to complete each route
Table 3-1b. Functional Requirements for Snow Plow Routing
Number Category Requirement Description
4.1.0 Output Plow Routes Routes that provide total coverage of all the streets shall be provided
4.1.1 Output Maps Paper maps of the individual routes shall be interpretable
4.1.2 Output Directions
Detailed driving directions to complete the routes shall be understandable (i.e., when to
plow, when to turn)
3.2. Non-functional Requirements
The non-functional requirements are specifications furnished by the officials for the city of Washington, D.C. They currently have ArcGIS and RouteSmart software for their garbage collection routing; therefore, they required a solution utilizing their existing software. The nonfunctional requirements are found in Table 3-2.
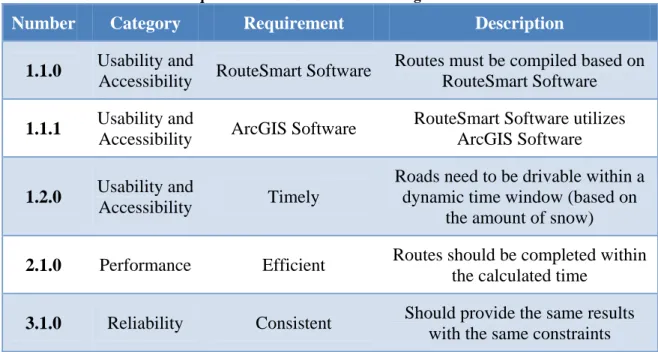
Table 3-2. Non-functional Requirements for Snow Plow Routing.
Number Category Requirement Description
1.1.0 Usability and
Accessibility RouteSmart Software
Routes must be compiled based on RouteSmart Software
1.1.1 Usability and
Accessibility ArcGIS Software
RouteSmart Software utilizes ArcGIS Software
1.2.0 Usability and
Accessibility Timely
Roads need to be drivable within a dynamic time window (based on
the amount of snow)
2.1.0 Performance Efficient Routes should be completed within the calculated time
3.1.0 Reliability Consistent Should provide the same results with the same constraints
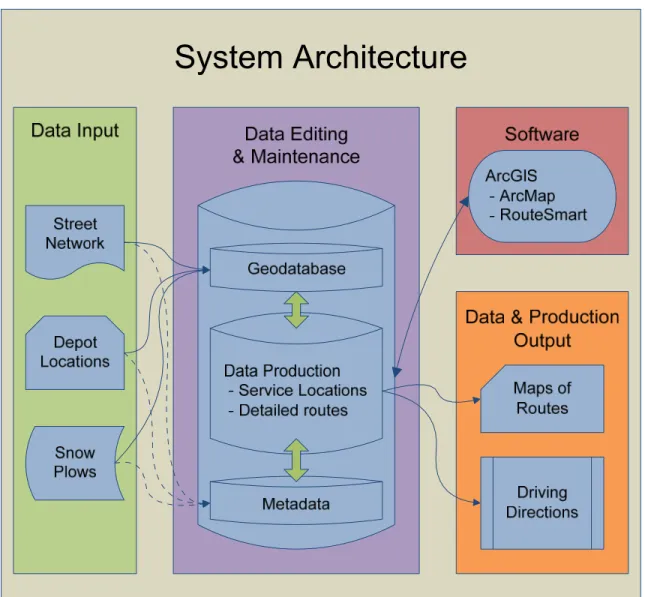
3.3. System Architecture
The RouteSmart software, which runs on the ArcGIS framework as an extension, analyzed the input data to produce the desired outputs. A topologically corrected street network, depot locations, and snow plow attributes were inputs required by the software in order to generate routes. The software then created the service locations from the street information and calculated the routes. The desired outcomes of the project were maps of the routes and detailed driving directions for the snow plow drivers to follow.
The system architecture was setup on a stand-alone workstation utilized by one person. The software creates a set of personal geodatabases to contain all of the required
information for the routing scenarios, such as route report tables, route map grids, and the required input data. These geodatabases were used as provided by the software with no additions made (see Figure 3-1).
Figure 3-1. System Architecture for Snow Plow Routing.
4.
Methodologies
The step-by-step procedures used to complete this project can be categorized into four main components: training, research, solutions, and deliverables. These components were divided into numerous tasks, including software training, data reviews, client interviews, generation and review of solutions, presentation of results, and preparation of a final report.
4.1. Training
The project required an understanding of the software capabilities. Demos of similar projects were reviewed and analyzed, such as snow plow routing for Saint Paul, MN, and street sweeping for Santa Monica, CA. RouteSmart provided the training needed for a comprehensive understanding of the software options through one-on-one instruction and additional training manuals.
4.2. Research
The conducting of extensive research helped with the identification of what others have done in the routing industry. As discussed in the Section 2, many others have studied the complexities of the routing process in order to provide more efficient routing services. A review of their work led to a greater appreciation of the value of routing. The routing algorithms were found to be a key part to providing better results, but having correct data was also imperative. The city's existing zone and street data was gathered and reviewed in order to verify its usefulness for the routing software. The officials for the city of Washington, D.C. were also interviewed to determine the full extent of their requirements for the solutions.
4.3. Solutions
The attributes of the streets and snow plows were carefully associated with each road segment in order for the software to have the best information available to generate efficient routes. Prior to creating routes, information for the street network had to be more than just the basic street name or segment length. Detailed values were essential to
understand the characteristics of each road on the ground, such as the direction of travel for each street segment. Also, the service side is on the right and left for two-way traffic, but only on one side for one-way roads. Some streets will not have the same number of driving lanes on both sides of the centerline. Another factor is that snow plows are not allowed on certain roads (i.e., private roads) and other streets will not be plowed by the light snow plows at all. With each street segment there is a service time and a drive time associated with it based on the speed of the plow. Some streets also have priority over others, such as streets with a steep grade or higher traffic.
The route calculations included three characteristics of the snow plow vehicles. The first was the capacity to hold salt, the second was the dispersal rate of the salt, and the third was the speed of the plows.
After these street and snow plow values were in place the software then calculated the service locations. The software is designed for multiple applications. With garbage collection there are several service locations along a single street segment. The truck only needs to drive each side of the street once picking up the trash for every house along the way. The routing algorithms look at the service locations and their association with a street segment. For the case of snow plowing the software creates one service location for each side of the street; this location represents the whole street segment that needs to be plowed. A service location is created for each lane for streets that have multiple lanes, however, the software requires the plows to make multiple passes along the street instead of one pass as in the garbage collection scenario.
The GIS software then calculated the routing solutions with the use of the various testing parameters, which are discussed in Section 4.5. These routes were generated for the entire city. However, only the maps and detailed driving directions for Zone 12, out of the city’s 14 snow plow zones, were given to the clients (see Figure 4-1). Analysis of all the
solutions determined if the man-made boundaries were helpful in creating routes.
Figure 4-1. Washington D.C.'s Existing Snow Plow Zones.
Figure 4-2 illustrates how the streets, which need to be plowed by the light snow plows, are sporadic throughout the city. This inconsistency adds to the complexity of routing.
4.4. Deliverables
The deliverables consisted of a subset of the solutions (i.e., maps of the snow plow routes for Zone 12) along with a summary report. Based on the requirements for the city of Washington, D.C., the solutions were generated after the data was reviewed and the snow plow routes were then analyzed for efficiency. An explanation of the analysis, found in Sections 6 and 7, was included in the report to inform the city how to move forward utilizing the various options of the RouteSmart software. A presentation to the clients was also provided detailing the extent of this project.
4.5. Testing Parameters
The city officials wanted to find out if their existing man-made boundaries for the snow plow zones were effective inputs for the routing software. In order to test these man-made boundaries, a series of parameters were selected. The software provides an assortment of routing options, offering hundreds of variable combinations which affect the outcome of the generated routes. Washington, D.C. indicated their preference to complete the plowing within a shorter time frame with less of a focus on how much it costs to clear the roads (Silverman, 2008). Therefore, the routes were generated based on a time interval instead of a specific number of routes so that the software would find out how many trucks would be required.
One option of the software is to use existing regions as a boundary to restrain the newly generated routes. With this option checked within the software menu, the routes are constrained to fall within the man-made geographic boundaries. Without this option engaged, the software is free to select the best routes without regard to geographical boundary constraints. Figure 4-3 shows some of the options for the software to calculate the routes.
Figure 4-3. A RouteSmart Menu for Routing Options, General Tab.
Group by regions, on the General Tab, is the option for the software to constrain the routes to be within existing boundaries. This is the option that was tested for this project. An additional parameter to note is the preferred time constraint of two hours, in which the software attempts to balance all the routes around the allotted time.
Only a few parameters were selected due to the time constraints of this project. These parameters are found under the Advance Balancing Tab of the Generate Solver Options Menu, as seen in Figure 4-4.
Figure 4-4. A RouteSmart Menu for Routing Options, Advanced Balancing Tab.
The first parameter was the Non-Productive Travel (NPT) option. The value of this parameter could technically be any number greater than zero, but for the purposes of this test, the values of 1 and 1000 where used. This number is a scale factor that the software uses in the algorithms. The smaller the NPT value (i.e., the value 1) the more balanced the routes will be. The larger the NPT value (i.e., the value 1000) the more compact the routes will be (RouteSmart Technologies).
The Non-Productive Travel option is the most important component in the routing process. With this option the software has to determine how balanced or compact the routes will be. Balance examines how well routes match each other with respect to the time that it takes to complete each route. Compactness refers to how well the routes keep from overlapping each other.
The second parameter was the Reaching option. This determines the number of
connections available between non-serviced streets for the solver. A lower number will reduce overlapping amongst the routes. The default values are between 2 and 6, so these were the values tested. Again these values are a scale factor that the software uses to calculate routes.
The third parameter was the Area Reduction option. This option looks at the total area of the minimum bounding rectangles (MBR) around all the routes. The values for this selection are nominal and not ratio. This means that the value 0 is just a name and in this case it means that the Area Reduction option is turned off. The following is a list from the ‘Advanced Routing Concepts Training Workbook’ of the rules associated with each value (RouteSmart Technologies):
0 – Turns off Area Reduction.
1 – During the initial generation of partitions, a partition that requires more service locations will include those service locations within the rectangle before including those outside the rectangle.
2 – During the balancing stage, this feature will encourage exchanges between partitions that reduce total size of the affected rectangles.
3 – During the balancing stage, this feature will disallow exchanges between partitions that increase total size of the affected rectangles.
4 – During the balancing stage, this feature will always make exchanges between partitions that reduce the size of the affected rectangles even at the expense of balance and deadheading.
In other words, all five values are separate rules for the software to follow with 0 being no rule and 4 being the strictest rule to observe. The extreme values of 0 and 4 were used for the tests.
Two values were used for each of these three parameters, which provided a total of eight combinations to test against the Group by regions option. Therefore eight scenarios were generated with the option to Group by regions and eight more scenarios were generated without this option. The 16 resulting scenarios were then compared.
Normally the extreme values would not be used in generating average routes; for the purpose of this project they were utilized in order to test the capabilities of the software. Two additional scenarios were then generated with more typical values in order to statistically compare the results of the extreme values with the results of the non-extreme values. These extra scenarios had values of 20, 4, and 2 for the Non-Productive Travel, Reaching, and Area Reduction parameters respectively.
5.
System Design
This section outlines a use-case scenario describing the setup of the project within the RouteSmart software package. Recreating routes when changes are needed would give the city an advantage to prepare for the winter to begin and the snow to fall. During the winter season, the appropriate planned routes would be utilized by the drivers, thus assuring adequate driving surfaces within a timely manner. This should result in a decrease in the number of complaints formed by the citizens who normally would not be able to safely leave their homes.
In order to accomplish this routing project it was very important to organize the required input data: how the streets were connected, what the turning impedances were, how many lanes were on a street, and what the priority of each street was. The capabilities of each snow plow needed to be known, including driving speed while plowing, driving speed while not plowing, snow depth, salt capacity, and spread rate. The location of the facilities and how many snow plows each facility houses was also identified. Understanding how the software would work with the data and the output it would provide were also important steps in the routing process.
5.1. System Description
Steps to import the data into a RouteSmart Workspace were as follows:
1. Imported the street data into the map document using the ‘Add Data’ button. This data was provided by the city of Washington, D.C.
2. Imported the facility data using the ‘Import Wizard’ as seen in Figure 5-1. This data was also provided by the city for the location of each truck yard and salt depot.
Figure 5-1. RouteSmart Import Wizard for Snow Plow Facilities.
3. Imported the existing boundaries using the ‘Add Data’ button. This data was provided for the use of the Group by regions option.
4. Made edits to the data as needed, such as, ensuring the correct fields were in the street attribute table for the software to utilize. Examples of these required fields are shown in table 5-2.
Figure 5-2. Required Fields for the RouteSmart Software.
5. Customized the general turning impedances with the ‘Edit Turn Defaults’ button as seen in Figure 5-3. These values are general time restraints for making the respective turns.
6. Customized the driving and plowing speeds for the snow plows based on the road type driven on as seen in Figure 5-4. The snow plow trucks can drive faster while the plow is up versus while the plow is down and in operation.
Figure 5-4. Plow Speed Customization.
7. After the turning impedances and the plow speeds were set, the next step was to create the street network with the ‘Network Manager’ button. This identifies which streets the software will utilize for driving and plowing.
8. Then following the creation of the street network, the service locations were created with the ‘Create Street Service Layer’ button as seen in Figure 5-5. Only the streets that were to be plowed by the light snow plows were selected to create the service layer. With this option the software creates a service location for each lane to be serviced, on each side of the street. These were created in order for the software to recognize how much work needs to be completed.
Figure 5-5. Menu to Create the Street Service Locations
9. The last step was to generate routes with the ‘Run Solver’ button. The parameters for this step were outlined in Section 4.5 except for the facility choice options as seen in Figure 5-6. The starting points for the plows needed to be the closest facility and then they should be returned to the same location. The intermediate facility is for reloading with salt and should be the closest facility.
Figure 5-6. A RouteSmart Menu for Routing Options, Facilities Tab.
After the input data was organized and imported into the RouteSmart program, the route planning began. The plow speeds vary depending on the amount of snow on the ground and the moisture content of the snow. Therefore, average speeds for plowing, not plowing, and spread rate were used in the routing solutions. Another factor to consider was the quantity of trucks and staff available to assist. Due to maintenance, some of the equipment is not always functional. Vacation, holidays, and sickness may also reduce the number of drivers accessible. There is an option to calculate routes by a specific number, but this should be reserved for the times when the number of available trucks and drivers is less than the number of routes and new routes need to be generated. In the case of this project the number of routes was generated based on a specified time window of two hours to complete the plowing.
5.2. Software Design
The RouteSmart software utilizes the GIS capabilities of ArcGIS, such as displaying the points of the depot locations and the lines of the street network. It then adds further
capabilities by analyzing the input data and computing efficient routes. Street data, along with the depot locations, were needed to commence the routing efforts. After the routes were generated they were displayed graphically with ArcGIS and descriptively displayed through report form by detailed directions. The reports provided a timeframe for
completing the route, and driving directions for the route. No customization was done to the RouteSmart software or to the ArcGIS software with this project.
6.
Results
The results of the tests conducted using the RouteSmart software suggest that multiple factors can reduce the routing costs if applied appropriately. Shorter routes would reduce the amount of time spent, which in turn might reduce the labor costs. However, more routes will be needed, which will increase the budget for equipment. Therefore, to have optimal routes, there needs to be a reduction in deadhead travel (i.e. traveling without servicing). As confirmed by Wang and Wright (1994), less deadhead travel would make the routes shorter and would not increase the number of routes. The city of Washington D.C. has two classes of snow plows: heavy and light snow plows. Within the city, there are 1,470.47 miles of roadway that are to be plowed by the light snow plows. This total is calculated by adding the length of each lane of traffic to be plowed. Any miles traveled by the plows in access of the 1,470.47 miles are deadhead travel miles (see Figure 6-1).
As discussed in Section 4.5, a total of 18 routing scenarios were conducted to exercise different limits of functionality within the RouteSmart software. As summarized in Table 6-1, different combinations of attributes were identified for each route with each testing scenario (columns 2 through 5). The results of each test are indicated in Table 6-1 starting with the Number of Routes column. This column indicates the number of routes generated by the software for the selected set of parameters. Each route would require its own plow so the number of routes is also equal to the number of snow plows. The Total Time is how long it would take all of the plows to complete the clearing process. However, each route will not be completed exactly on the specified time; therefore, the Shortest Time and Longest Time for the routes are indicated along with the Time Difference between the extremes. The Average Time is the total time divided by the number of routes. The Miles Traveled is the total number of miles traveled by all the snow plows, including the deadhead travel miles. The Compactness is an indication as to how well the routes look clustered. All time units shown in Table 6-1 are in hours and minutes.
Table 6-1. Test Results for the Routing Parameters.
Te st Nu mb er No n ‐ Pr o d u ct iv e Tr av e l Re ac h in g Ar e a Red u ct io n Ti m e Goal Nu m b er of Ro u te s To tal Tim e Sh o rt es t Tim e Lo n ge st Tim e Tim e D if fer en ce Av era ge Tim e M ile s Tr a vel ed Co m p a ct n es s 1 1 6 0 2:00 75 174:38 1:42 2:46 1:04 2:19 2,980.08 Bad 2 1000 6 0 2:00 74 166:35 0:23 5:40 5:17 2:15 2,835.52 Good 3 1 2 0 2:00 74 174:20 1:49 2:46 0:57 2:21 2,957.39 Bad 4 1000 2 0 2:00 73 166:04 0:23 6:51 6:28 2:16 2,831.85 Good 5 1 6 4 2:00 76 176:46 1:44 2:47 1:03 2:19 3,026.41 Bad 6 1000 6 4 2:00 74 166:57 0:20 8:58 8:38 2:15 2,846.75 Good 7 1 2 4 2:00 74 172:16 1:34 2:44 1:10 2:19 2,913.27 Bad 8 1000 2 4 2:00 74 165:33 0:20 6:15 5:55 2:14 2,823.08 Good 9 20 4 2 2:00 74 171:23 1:20 3:48 2:28 2:18 2,900.25 OK 10 1 6 0 2:00 78 179:15 1:43 2:37 0:54 2:17 3,076.84 Bad 11 1000 6 0 2:00 77 166:55 0:26 6:30 6:04 2:10 2,869.74 Good 12 1 2 0 2:00 78 176:07 1:31 2:43 1:12 2:15 3,006.40 Bad 13 1000 2 0 2:00 77 166:59 0:22 7:30 7:08 2:10 2,835.24 Good 14 1 6 4 2:00 79 180:38 1:42 2:44 1:02 2:17 3,123.27 Bad 15 1000 6 4 2:00 77 167:50 0:21 8:03 7:42 2:10 2,852.26 Good 16 1 2 4 2:00 78 176:00 1:35 2:46 1:11 2:15 3,001.64 Bad 17 1000 2 4 2:00 77 166:52 0:21 7:53 7:32 2:10 2,828.84 Good 18 20 4 2 2:00 77 169:51 0:40 3:09 2:29 2:12 2,913.72 OK Gr ou pe d by Re gi o n s No t Gr ou pe d by Re gi o n s
The values for each scenario were recorded in order to analyze the efficiency of the Group by regions option. A visual comparison between the number of routes for each test
shows that the Group by regions option reduces the number of routes required to complete the work for the city. The other values do not illustrate such a prominent difference.
Out of the city’s current 14 snow plow zones, the city of Washington, D.C. requested routes to be provided for Zone 12. So during the calculation of the routes with the Group by regions option, the combined results for the routes inside Zone 12 were recorded and supplied as seen in Table 6-2.
Table 6-2. Test Results for Zone 12.
Te st Nu mb er No n ‐ Pr oduc ti ve Tr av el R e ac hi ng Ar ea R e duc ti on Tim e Goa l Z 12 Nu mb e r of Ro u te s Z 12 Tot a l Tim e Z 12 Sh o rt es t Ti m e Z 12 Lo n ge st Tim e Z 12 D if feren ce Z 12 Av era g e Ti m e Z 12 Mi le s Tr av el e d Z 12 Co m p ac tn es s 1 1 6 0 2:00 6 14:49 2:12 2:36 0:24 2:28 253.17 Bad 2 1000 6 0 2:00 6 14:12 1:00 4:16 3:16 2:22 244.13 Good 3 1 2 0 2:00 6 14:33 2:17 2:32 0:15 2:25 248.04 Bad 4 1000 2 0 2:00 6 13:59 0:24 6:19 5:55 2:19 238.48 Good 5 1 6 4 2:00 6 15:12 2:17 2:45 0:28 2:32 266.43 Bad 6 1000 6 4 2:00 6 14:01 0:44 6:01 5:17 2:20 238.50 Good 7 1 2 4 2:00 6 14:47 2:14 2:40 0:26 2:27 254.73 Bad 8 1000 2 4 2:00 6 14:03 0:28 4:51 4:23 2:20 240.87 Good 9 20 4 2 2:00 6 14:18 2:13 2:30 0:17 2:23 239.97 OK G roupe d by Re gi o n s
Analysis was not derived for Zone 12 exclusively due to the fact that there was not a counterpart of routes generated without the Group by regions option specific to Zone 12. The results for Zone 12 are supplied only for visual purposes.
The key values in Table 6-1 were summarized and are presented in Table 6-3. The table shows that the Group by regions option (Test #1) has a mean of 74.22 for the Number of Routes. The mean for Test #2 (not grouped by region) is 77.56 routes. Lower means for the Group by regions option are also found when comparing between the other variables.
Table 6-3. Grouped Statistics
Test N Mean Std. Deviation Std. Error Mean
Number of Routes 1 9 74.22 .833 .278 2 9 77.56 .726 .242 Total Time 1 9 170:30 4:17 1:25 2 9 172:16 5:41 1:53 Time Difference 1 9 3:40 2:56 0:58 2 9 3:54 3:05 1:01 Miles Traveled 1 9 2,901.62 73.65 24.55 2 9 2,945.33 110.07 36.68
The difference between these pairs of values, however, does not automatically indicate statistical significance. Therefore, further statistical analysis was performed to test the significant differences.
Based on a t-test for two independent samples, at a 95% Confidence Level, the routing results were tested to validate the hypothesis that there was a significant difference between the Group by regions options (see Appendix Table 1). Statistically these values indicated there was only a significant difference between the two options of Group by regions, with regard to the number of routes generated. In other words, the tests
generated with the option to Group by regions provided significantly fewer routes than the option to not Group by regions.
After discussing these results with Roy Dahl, the Director of Research and Development for RouteSmart Technologies, he indicated that there is a setting in the algorithm which created this false appearance of statistical significance. When calculating routes based on time there is an additional option to add an extra route. The software tries to create the routes as close to the specified time as possible. By default the software will go over the allotted time in order to reduce the number of routes. When the option to add an extra route is checked, the software will add an extra route in order to not exceed the time frame. Therefore, when using the Group by regions option and not adding an extra route, the software would automatically reduce the number of routes for each zone. In turn, it created fewer total routes throughout the city (see Figure 6-2).
Figure 6-2. Add Extra Route Option.
Table 6-4 shows the results of an additional solution, Test #19, which was generated based on Number in order to compare the results of Test #9. The input parameters for Test #18 and Test #19 were the same except that #18 was generated based on Time and #19 was generated based on Number under the Method option on the General Tab of the Generate Solver Options Menu. Time refers to the time interval to complete the routes and Number refers to the number of routes preferred.
Table 6-4. Routing Results for Extended Tests.
G rouped by Region Te st Number Non ‐ Produc tiv e Travel R e ac hing Area R eduction Tim e Goal Num b er of Ro ut es Tota l Tim e Sh or te st Ti m e Lo nges t Tim e Tim e Di fference Aver ag e Ti m e Mi le s Trav ele d Comp actn es s Y 9 20 4 2 2:00 74 171:23 1:20 3:48 2:28 2:18 2,900.25 OK N 18 20 4 2 2:00 77 169:51 0:40 3:09 2:29 2:12 2,913.72 OK N 19 20 4 2 2:00 74 168:11 1:01 3:25 2:24 2:16 2,891.04 OK
If all of the solutions for those not-grouped by region were to be generated again, based on the number of routes of their corresponding Group by regions option, there would no longer be a significant difference in the number of routes. The other categories would
40
also not produce a significant difference due to the variance of the Non-Productive Travel option. Due to the time constraints for completing this project, these additional tests were not conducted.
Table 6-5 displays the average results for the routes generated within Test #9 and #19. The results for the new routes were statistically tested to verify a significant difference, if any, between the solutions of Test #9 and Test #19. Based on a t-test for two independent samples, at a 95% Confidence Level, there was not found to be a significant difference between the Group by regions options (see Appendix Table 2).
Table 6-5. Group Statistics for Test #9 and Test #19.
Test N Mean Std. Deviation Std. Error Mean
Total Time 9 74 2:18 0:23 0:02
19 74 2:16 0:34 0:04
Miles Traveled 9 74 39.19 8.55 0.99
7.
Conclusions
The first statistical results indicated that the city of Washington, D.C.’s current snow plow zones proved to be beneficial in generating new routes based on a lower number of routes created. The Group by regions option was not only efficient with the number of routes, but also with the total time to complete all the routes, the time difference between each route, and the overall miles traveled by all the snow plows. These additional factors were visually supportive to the hypothesis of better routes, but statistically they were not found to be significantly different.
The second statistical results, on the other hand, indicated that there was not a significant difference between the two uses of the current snow plow zones for generating routes. Essentially, the city could generate routes with either method and still create similar results. However, the 14 snow plow zones currently have supervisors who are familiar with their area of responsibility. Thus, utilizing the existing zones would save the city in administrative time. Therefore, to reduce the cost of each snow clearing event – by a reduction in snow plow vehicles, a reduction in time, and a reduction in fuel – it is recommended that the city generate their snow plow routes utilizing the Group by regions option with their current man-made snow plow zones.
7.1. Recommendations
The statistical results do not indicate that the software will always provide comparable routes with the Group by regions options. The results only point toward good routes based on the current geographical boundaries of the snow plow routes. Further studies should be done with different boundaries to validate the hypothesis that geographical boundaries increase the efficiency of the RouteSmart software solutions.
Using parameters other than the ones specified in Section 4.5 might also lead to different conclusions. The software is frequently being updated and changed, therefore it is also recommended to continue to test the advancing technology.
7.2. Future Work
Examples of further study in general routing could be endless. Specific to snow plowing, examples could include a comparison between light and heavy snow plows. Given the same street network, which snow plows would be more efficient based on the various plow characteristics?
The salt demand per route on average is just barely above the capacity of the 4,000 pounds of salt. If more salt depots were add throughout the city it would reduce the amount of deadhead travel for some of the trucks. Another option would be to add more snow plows to bring the salt demand per route below the truck capacity. If the trucks only needed to fill up once per snow clearing event the extra salt depots could be eliminated. Dense urban areas with heavy snow fall require snow removal along with snow plowing. The plowing process pushes the snow to the sides or the middle of the road, awaiting
42
warmer weather to melt the snow. When too much snow is accumulated on the road due to plowing, parking and traveling are further restricted. Integration of snow plow routes and snow removal routes would present an intriguing project.
Although the software is efficient and faster than calculating routes by hand, it still takes hours to generate new routes. When a snow emergency is in place it is not practical for the city officials to start generating new routes to accommodate the new weather scenario. Thus, multiple scenarios should be generated in advance to facilitate the changing accessibility of equipment and the various levels of snow accumulation.
8.
References
Bodin, L. D., & Kursh, S. J. (1978). A Computer-Assisted System for the Routing and Scheduling of Street Sweepers. Operations Research , 525-537.
Borruso, G. (2003). Network Density and the Delimitation of Urban Areas. Transactions in GIS , 177-191.
Chang, K.-t. (2004). Introduction to Geographic Information Systems (2nd ed.). New York: McGraw-Hill.
Eglese, R. W., & Li, L. Y. (1992). Efficient Routeing for Winter Gritting. The Journal of the Operational Research Society, 43 (11), 1031-1034.
Eichelberger, F. P. (2002, April 23). The Benefits of GIS/911 Integration: An Approach Worth Emulating. Directions Magazine .
Encyclopaedia Britannica. (2008). Graph Theory. Retrieved August 14, 2008, from Encyclopaedia Britannica Online:
http://www.britannica.com/EBchecked/topic/242012/graph-theory
Encyclopaedia Britannica. (2007). Washington. Retrieved October 20, 2007, from Encyclopaedia Britannica Online: http://www.britannica.com/eb/article-9108780 Goodchild, M. F. (1998). Geographic Information Systems and Disaggregate
Transportation Modeling. Geographical Systems , 19-44.
Goodchild, M. F. (2000). GIS and Transportation: Status and Challenges. GeoInformatica , 127-139.
House, C. E. (2000, August). GIS helps put trash route changes on track: Northern Virginia county uses system to optimize daily collection setup. Government Computer News State & Local .
Huang, B., Cheu, R. L., & Liew, Y. S. (2004, February 13). GIS and genetic algorithms for HAZMAT route planning with security considerations. International Journal of Geographical Information Science , pp. 769-787.
Li, L. Y., & Eglese, R. W. (1996). An Interactive Algorithm for Behicle Routeing for Winter - Gritting. The Journal of the Operational Research Society, 47 (2), 217-228.
Mitchell, A. (1998). Zeroing In: Geographic Information Systems at Work in the Community. Redlands: Environmental Systems Research Institute, Inc.
RouteSmart Technologies. (2007). About. Retrieved October 20, 2007, from RouteSmart Technologies Web site: http://www.routesmart.com/about.aspx
RouteSmart Technologies. (n.d.). RouteSmart for ArcGIS: Advanced Routing Concepts Training Workbook.
Sahoo, S., Kim, S., Kim, B.-I., Kraas, B., & Popov, A. J. (2005, January-February). Routing Optimization for Waste Management. Interfaces , pp. 24-36.