Image FARMER: Introducing a Data Mining Framework
for the Creation of Large-scale Content-based Image
Retrieval Systems
Juan M. Banda
Montana State UniversityP.O. Box 5122 Bozeman, MT 59717-5122
Rafal A. Angryk
Georgia State UniversityP.O. Box 3994 Atlanta, GA 30302-3994
Petrus C. Martens
Montana State UniversityP.O. Box 173840 Bozeman, MT 59717-3840
ABSTRACT
In this paper we introduce imageFARMER, a framework that allows information retrieval researchers and educators to develop and customize domain-specific content-based image retrieval systems with ease while developing a deeper understanding of the underlying representation of domain-specific image data. imageFARMER incorporates different aspects of image processing and content-based information retrieval, such as: image representation via image parameter extraction, validation via image parameters, analysis of multiple dissimilarity measures for accurate data analysis, testing of dimensionality reduction methods for storage and processing optimization, and indexing algorithms for fast and efficient querying. The unique capabilities of this framework have not been available together as an open-source software package designed for research, while offering enhanced knowledge discovery and validation of all steps involved when creating large-scale content-based image retrieval systems.
General Terms
Image retrieval, content-based image retrieval, open-source software applications, evaluation framework.
Keywords
Content-based image retrieval, retrieval, attribute evaluation, dimensionality reduction.
1.
INTRODUCTION
Developing large-scale content-based image retrieval (CBIR) systems is an important computer science challenge due to the current deluge of digital image data [1, 2]. To facilitate the creation of such systems, a framework that provides a testing environment that allows experimentation with image parameters and large scale image processing techniques in different, domain-specific image retrieval tasks is needed. Said framework should also cover other important CBIR steps, such as: unsupervised and supervised attribute evaluation, dimensionality reduction, and high-dimensional data indexing.
In this work we introduce imageFARMER (Framework for the creAtion of laRge-scale content-based iMagE Retrieval – freely available in [3]), a novel framework that combines aspects of large-scale data processing, which is geared towards the creation of better suited retrieval mechanisms for different domain-specific image data sources. Such a framework will allow researchers and educators to experiment with different aspects, to determine optimal combinations and integrations of their own components. Since many image retrieval techniques tend to produce significantly different
flexible experimenting environment is highly needed. As of writing time, we are not aware of any freely available software that allows the extensive experimentation and testing that imageFARMER permits.
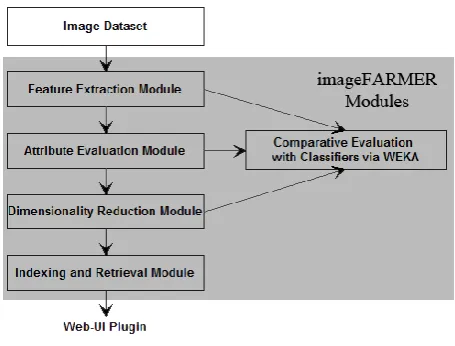
[image:1.595.314.542.380.553.2]We believe that a framework like ours, outlined in Figure 1, will be an invaluable tool for the community, allowing researchers to spend their efforts on the actual problem at hand rather than the construction of a set-up that will allow them to have a flexible and configurable testing environment. By providing a testing platform, researchers and educators working on state-of-the-art image retrieval problems can contribute new plugins while adapting it for their work, allowing them to enrich the experience of future users.
Figure 1. imageFARMER modules and flow
2.
BACKGROUND
surveys of high-dimensional indexing of multimedia data [9] and applications to medicine [10], which fit the constraints of our particular application.
Wide usage of CBIR systems is still not very common, and very few widely used systems exist. Examples include Yahoo! Image Search, and Google Image Search, both of which rely heavily on metadata and have weak performance when it comes to complicated searches, in particular of regions within the images. In terms of CBIR systems freely available for other researchers to customize, we have the Flexible Image Retrieval Engine (FIRE) [11], created by Thomas Deselaers, as the only well-known framework. While the interface and relevance feedback mechanisms are already provided, this system is somewhat complicated to extend and implement new image parameters on it, and it is no longer supported.
During our literature review process of CBIR systems, we discovered that very few researchers actually address their parameter selection in great detail as in [12]. And even in this discussion, there are several key types of dissimilarity evaluations that are not addressed to the extent provided by imageFARMER. Our framework addresses those deficiencies and provides a useful tool for researchers embarking on the task of building domain-specific CBIR systems.
3.
BENCHMARK DATASETS USED
In order to show the functionality of imageFARMER, we selected six different image datasets based on their unique characteristics to contrast them with our base application, the SDO CBIR system. By selecting very different types of datasets we will show the domain-dependency of the image parameters and the need to use all of the modules of imageFARMER in order to gain valuable insights on the experimental datasets. We selected a total of eight classes and 1,600 images (200 per class) for each dataset.
3.1
Solar dataset
[image:2.595.315.540.71.132.2]The dataset was created from the Transition Region and Coronal Explorer (TRACE) mission, fully described in [13].
Figure 2. Sample of Solar dataset images
3.2
INDECS dataset
INDECS stands for INDoor Environment under Changing conditions, described and available in [14].
Figure 3. Sample of INDECS dataset images
3.3
ImageCLEF datasets (2005 and 2007)
[image:2.595.59.280.480.539.2]ImageCLEF is the cross-language image retrieval track that is a part of the Cross Language Evaluation Forum (CLEF) described in [15]. We created two different datasets from images of the 2005 and 2007 editions.
Figure 4. Sample of CLEFMED dataset images
3.4
PASCAL Datasets (2006 and 2008)
[image:2.595.54.280.599.669.2]The PASCAL Visual Object Classes (VOC) challenge is a popular benchmark in visual object category recognition and detection. Fully described in [16], we created two different datasets from the images of 2006 and 2008 editions.
Figure 5. Sample of PASCAL dataset images
4.
CLASSIFICATION ALGORITHMS
In order to provide quantitative evaluation results, most of the modules in imageFARMER’s generate WEKA ARFF files. These files will enable the researcher to experiment with the wide variety of classification algorithms offered in WEKA [17], such as the ones used in this paper: Naïve Bayes (NB), C4.5, and Support Vector Machines (SVM). By using imageFARMER in conjunction with a popular tool such a WEKA researchers will be able to test their findings in a familiar and well supported environment.
5.
FEATURE EXTRACTION MODULE
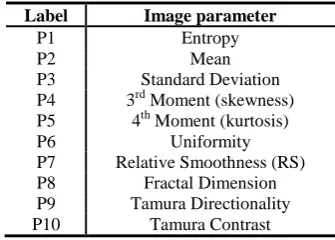
While building imageFARMER, we started like previous researchers, by carefully selecting the parameters we wish to extract from images [12, 18, 19]. Since our framework was developed in parallel with the SDO large-scale CBIR system we primarily implement texture-based image parameters because our images are grayscale and do not contain perfectly outlined shapes, as explained in [12, 20]. Our quantitative analysis in this work uses the 10 most useful parameters determined for our dataset in [18, 19]. However, the framework capabilities allow researchers to implement and test any parameters that they know that work for their domain-specific images. Our framework also allows the usage of software packages that extract image parameters like WND-CHARM [21], and provides extensive facilities for testing and visualization.
Please note that this work is not an overview of image parameters, it just indicates which image parameters have been implemented in our framework. For a comprehensive comparison of image parameters, please refer to [12, 19].
Table 1. List of default image parameters available
Label Image parameter
P1 Entropy
P2 Mean
P3 Standard Deviation P4 3rd Moment (skewness) P5 4th Moment (kurtosis)
P6 Uniformity
[image:2.595.343.511.631.751.2]5.1
Grid-based segmentation
Based on our previous work on the solar dataset [20] and the observations presented on [13], we divide the image with an n-by-n grid before extracting the image parameters. imageFARMER is flexible enough to allow researchers to specify their own grid sizes (if any), or their own image segmentation before extracting their image parameters. After the image segmentation is completed, the extraction of image parameters begins on each section.
5.2
Experimental results
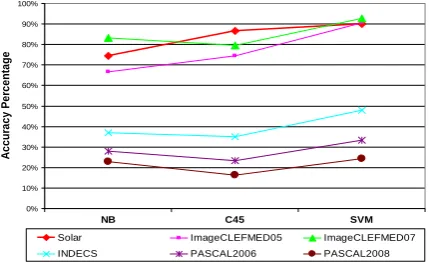
After the initial extraction of our proposed image parameters from Table 1, we present the WEKA classification accuracy results on the six datasets in Figure 6. Note that these preliminary results only assess how accurate the selected image parameters are and they do not represent the final classification results after running all modules. We immediately observe the domain dependency of the image parameters since we have two main performance clusters that correspond to how well the parameters are intended to represent the images (good in the top and bad in the bottom).
Figure 6. Initial classification accuracy for our six datasets using 10-fold cross validation
6.
ATTRIBUTE EVALUATION
MODULE
Choosing redundant image parameters in a CBIR system adds computational overhead when processing images, unnecessary data storage, and retrieval costs. The main goal of this module is to determine which parameters can be safely removed while maintaining a high quality parameter-based representation.
6.1
Unsupervised attribute evaluation
Several automatic methods for image parameter selection have been proposed in [22]. However, these automatic methods do not directly explain how attributes are chosen. The method proposed in [12] analyzes correlations between the values of the parameters themselves and provides the user with information aid in the selection of an appropriate set of attributes using similarity matrices. These matrices will be analyzed in order to find the correlations between parameters.
6.2
Supervised attribute evaluation
By using the class labels of our training dataset, imageFARMER relies on the following supervised attribute evaluation methods found in WEKA [17]: Chi Squared Method, Gain Ratio Method, and Info Gain Method [23].
6.3
Experimental results – unsupervised
evaluation
To build Figure 7, we randomly selected a query image from any class and then analyzed the correlation between the rest of
[image:3.595.317.531.142.283.2]the same class images in order to observe which parameter correlates within the same class (intra-class). imageFARMER can also analyze the correlation between the query image class and the rest of the classes, in order to observe which parameters feature correlations to the rest of the classes, and to the same class (more details in [18]).
Figure 7. Average correlation map of image parameters of the AR class in the solar dataset for the intra-class
correlation scenario
Since some of the correlation differences are not that visible from the correlation maps, we use multi-dimensional scaling plots [24] to better show the correlations as seen on [18].
6.4
Experimental results – supervised
evaluation
Table 2 shows the ranking results for the supervised methods.
Table 2. Supervised attribute evaluation top 3 results
Chi Squared Info Gain Gain Ratio
Ranking Label Ranking Label Ranking Label
2039.06 P7 0.8440 P7 0.3597 P9 2036.05 P6 0.8425 P6 0.3152 P4 2016.69 P1 0.8292 P1 0.3140 P5
6.5
Combined experimental results
Combining the ranking results presented in Table 2 and the correlations in Figure 7, we created four different experiments that are explained in Table 3 for the solar dataset.
Table 3. Description of attribute evaluation experiments
Label - Experiment Description Exp 1 - All Parameters used
Exp 2 - Parameters P3, P6, P10 removed
Exp 3 - Parameters P2, P3, P10 removed
Exp 4 - Parameters P1, P4, P7 removed
Exp 2 is removes image parameters that are uncorrelated and correlated, according to Figure 7, while Exp 3 and 7 remove the bottom and top 3 attributes respectively based on Table 2.
Table 4. Classification Accuracy Results
Label NB C45 SVM
Exp 1 74.50% 86.56% 89.94%
Exp 2 76.81% 85.75% 89.94%
Exp 3 75.19% 85.25% 89.75% Exp 4 72.88% 85.56% 92.56%
Clearly these experimental results show the value and need of performing attribute evaluation in order to determine relevance of the image parameters that are selected for a CBIR system. As shown in Tab. 4, we achieved very similar
0% 10% 20% 30% 40% 50% 60% 70% 80% 90% 100%
NB C45 SVM
Classifier
A
c
c
u
ra
c
y
Pe
rc
e
n
ta
g
e
Solar ImageCLEFMED05 ImageCLEFMED07
[image:3.595.59.274.303.434.2]7.
DISSIMILARITY MEASURES
MODULE
Working as a sub-module for the Attribute Evaluation module, we provide 18 dissimilarity measures that are widely used for clustering, classification, and retrieval of images [25, 26] in order to determine which ones would provide a better differentiation between the dataset’s classes. These measures are listed in Table. 5; for more information see [19].
[image:4.595.56.277.261.423.2]Besides graphically visualizing the combinations of dissimilarity measures and image parameters, the framework also includes the ability to provide analysis based on multi-dimensional scaling (MDS) applied to the dissimilarity matrices. This proves a mechanism for the construction of 2D and/or 3D visualization that depicts class separation (if any) under each measure-parameter combination.
Table 5. List of dissimilarity measures used
Label Distance
D1 Euclidean
D2 Standarized Euclidean
D3 Mahalanobis
D4 City Block
D5 Chebychev
D6 Cosine
D7 Correlation
D8 Spearman
D9 Hausdorff
D10 Jensen-Shannon divergence (JSD)
D11 χ2
D12 Kullback-Leibler divergence (KLD) A-B D13 Kullback-Leibler divergence (KLD) B-A D14-18 Fractional p=0.25,0.50,0.80,0.90,0.95
7.1
Experimental results
[image:4.595.341.516.314.407.2]In Figures 8 and 9, we observe how different measures produce very different results. This will allow researchers to find hidden details on how classes are separated.
Figure 8. Dissimilarity matrix plot for (a) correlation (D7) measure with mean (P2) and (b) Chebychev (D5) measure
with relative smoothness (RS) (P7)
Figure 9. 3D MDS plot for (a) correlation (D7) measure with mean (P2), (b) Chebychev (D5) measure with RS (P7)
In Figures 8 and 9 one clearly observes how different each of the parameter/dissimilarity measure combinations is since we can see a clear separation of a class that we were not able to see before between a) and b).
8.
DIMENSIONALITY REDUCTION
MODULE
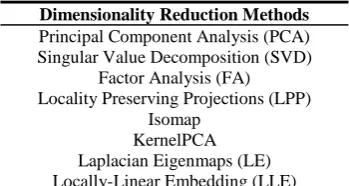
With dimensionality reduction methods already successfully implemented in an image retrieval context, for several domains [27, 28], imageFARMER provides eight dimensionality reduction methods. This is intended to help researchers determine which method is optimal for each particular dataset (if any), and what percentage of dimensionality reduction can be achieved. We selected our eight different methods based on their popularity in literature, computational expense, the preservation of local properties between the data, the availability of a mapping function to map new unseen data points into the new dimensional space, and the types of distances used to calculate the data points (Euclidean versus geodesic). These eight methods are listed in Table 6.
Table 6. Dimensionality reduction methods used
Dimensionality Reduction Methods
Principal Component Analysis (PCA) Singular Value Decomposition (SVD)
Factor Analysis (FA) Locality Preserving Projections (LPP)
Isomap KernelPCA Laplacian Eigenmaps (LE) Locally-Linear Embedding (LLE)
The first four methods are linear and the last four are non-linear. A more detailed explanation and outline of these methods can be found in [29].
8.1
Experimental results - Dimensionality
Thresholding via PCA and SVD
In order to provide dimensionality estimations, we used the number of dimensions returned by PCA and SVD with a variance threshold between 98 and 99% as shown in Table 7.
Table 7. Dimensionality reduction methods used
Datasets tested PCA Variance SVD Variance
98% 99% 98% 99%
Solar 51 58 99 143
INDECS 121 143 270 319
ImageCLEFmed05 103 126 253 307 ImageCLEFmed07 102 126 251 304
Pascal2006 96 114 125 147
Pascal2008 141 160 275 331
Experiment Label 1 2 3 4
For the remaining experiments we selected 67% of our data as the training set and an ‘unseen’ 33% as the test set. With six out of the eight methods (FA, KernelPCA, Isomap, LLE, LE, LPP) implemented from the Matlab Tool box for dimensionality reduction [30].
[image:4.595.54.278.482.579.2]Table 8. Top five classification results for the solar dataset. The number next to the dimensionality reduction method corresponds to the experiment label from Table 7
NB SVM
ORGINAL 83.86% ORIGINAL 92.12% PCA 3 83.49% LPP 4 91.74% PCA 4 82.18% PCA 4 91.18% PCA 2 81.99% Laplacian 4 90.99% SVD 2 81.99% PCA 3 90.81%
9.
INDEXING AND RETRIEVAL
MODULE
In imageFARMER, we have included several different indexing algorithms that are widely used by researchers in the fields of CBIR and database systems [28, 31]. Please note that we emphasize a clear separation between multi-dimensional algorithms that index data points in true n-dimensional spaces, versus single-dimensional indexing for high-dimensional data that maps high-dimensional data points in different ways to index them with single-dimensional indexing structures.
9.1
Multi-dimensional indexing
In our framework we have included implementations for R*-Trees and kd-trees. These traditional algorithms offer great advantages for two and three dimensional objects but tend to get very inaccurate and computationally expensive to search through as the dimensionality increases [10, 31], which is a big issue on our dataset as shown in [19].
9.2
Single-dimensional indexing for
multi-dimensional data
Because of the low number of dimensions handled by multi-dimensional indexing algorithms, researchers have created new indexing algorithms that efficiently index high-dimensional spaces utilizing underlying B+-tree structures and partition mechanisms to break down dimensionality. In imageFARMER we will provide an implementation of the state-of-the-art iDistance algorithm [32, 33]. Current results are produced with a beta version of the algorithm’s implementation.
9.3
Experimental results -
single-dimensional indexing for multi-single-dimensional
data
In this paper we do no present results for the multi-dimensional indexing algorithms since they are not designed to handle the dimensions we are using (640), some analysis can be found in [19] showing how poorly they perform.
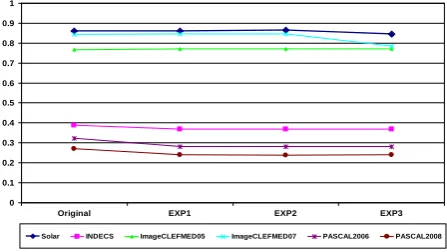
Figure 10. Average retrieval precision values
We compared the original dimensionality of the datasets (640) versus the top 3 results from our dimensionality reduction experiments (Table 8). Figure 13 shows that the retrieval precision between the original dimensional space and the reduced ones is almost identical, validating our usage of the dimensionality reduction module in conjunction with this module of imageFARMER. The domain dependency of the image parameters to the datasets is again clearly shown, as we first saw in Figure 6.
10.
WEB-UI: THE FIRST imageFARMER
PLUGIN
[image:5.595.316.542.281.393.2]After going through the four main modules of imageFARMER, we are left with all the pieces of a very functional and optimized CBIR system. With the Web-UI plugin, we bridge the gap between a research CBIR system and a fully working application that allows researchers and end-users to test the underlying CBIR system in a web environment that anybody can access through a browser.
Figure 11. Web-UI query interface
Similar to FIRE [11], the Web-UI front-end allows users to query images and observe their retrieved results. However, imageFARMER’s main difference is that everything underneath the Web-UI plugin is configurable and easily modifiable, producing a custom fit web-based CBIR system depending on the researcher’s needs and the domain-specific data characteristics.
11.
CONCLUSIONS AND FUTURE
WORK
Since imageFARMER was conceived during the process of building a CBIR system for the SDO mission we currently have a working version of this system at [3]. As proof of concept for imageFARMER we have demos available for the PASCAL 2006 and the CLEFMed 05 datasets. These last two demos were automatically produced with imageFARMER and the Web-UI plugin. As a whole, imageFARMER can produce fully working CBIR demos in less than 1 hour (depending on the number of images in the dataset) with minor configuration changes. The time consuming part comes with the experimentation of different parameters, but they still can quickly be tested thanks to the framework’s capabilities.
There is ongoing development of a plugin that will enable all the image parameters implemented in WND-CHARM [21] to be usable with imageFARMER. In general, we hope that with the help of the data mining community, this framework grows in functionality and popularity for both academic research and teaching environments since it is open-source and fully expandable.
0 0.1 0.2 0.3 0.4 0.5 0.6 0.7 0.8 0.9 1
Original EXP1 EXP2 EXP3
[image:5.595.57.281.601.727.2]12.
ACKNOWLEDGMENTS
This work was supported by two National Aeronautics and Space Administration (NASA) grant awards, 1) No. NNX09AB03G and 2) No. NNX11AM13A.
13.
REFERENCES
[1] Datta, R., Joshi, D., Li, J. and Wang, J. 2008. Image Retrieval: Ideas, Influences, and Trends of the New Age, ACM Computing Surveys, vol. 40, no. 2, article 5, 1-60.
[2] Rui, Y., Huang, T.S., and Chang, S. 1999. Image Retrieval: Current Techniques, Promising Directions, and Open Issues. Journal of Visual Com. and Image Rep. 10, 39–62.
[3] imageFARMER [Onliune] Available: http://www.imagefarmer.org [Accessed: Oct 10, 2013]
[4] Kato, T. 2002. Database architecture for content-based image retrieval. In Img. Storage and Ret. Sys., 112-123.
[5] Banda, J.M., Angryk, R., and Martens, P.C.H 2012. Quantitative Comparison of Linear and Non-linear Dimensionality Reduction Techniques for Solar Image Archives, In FLAIRS-25, 376-381.
[6] Smeulders, A.W., Worring, M., and Santini, S. 2000. Content-based image retrieval at the end of the early years. IEEE Trans. Pattern Anal. Mach. Intel. 22, 12, 1349–1380.
[7] Snoek, C.G.M. and Worring, M. 2005. Multimodal video indexing: A review of the state-of-the-art. Multimed. Tools Appl. 25, 1, 5–35.
[8] Muller, H., Pun, T., and Squire, D. 2004. Learning from user behavior in image retrieval: Application of market basket analysis. Int. J. Comput. Vision 56, 1–2, 65–77.
[9] Banda, J. M., Angryk, R., Martens, P. 2012. Steps Towards a Large-Scale Solar Image Data Analysis to Differentiate Solar Phenomena, Solar Physics, Springer.
[10]Bohm, C., Berchtold, S. and Keim, D.A. 2001. Searching in high-dimensional space index structures for improving the performance of multimedia databases. ACM Comput. Surv. 33, 3, 322–373.
[11]FIRE -- Flexible Image Retrieval Engine [Online], Available: http://thomas.deselaers.de/fire/ [Accessed: Oct 10, 2013]
[12]Deselaers, T., Keysers, D. and Ney, H. 2008. Features for Image Retrieval: An Experimental Comparison, Inf. Ret., Vol. 11, issue 2, The Netherlands, Springer, 77-107.
[13]Banda, J.M. and Angryk, R. 2009. On the effectiveness of fuzzy clustering as a data discretization technique for large-scale classification of solar images. In FUZZ-IEEE09, Jeju Island, Korea, 2019-2024.
[14]Pronobis, A., Caputo, B., Jensfelt, P. and Christensen, H. I. 2006. A discriminative approach to robust visual place recognition. In IEEE/RSJ IROS06, China, 3829-3836.
[15]Hersh, W., Müller, H., Kalpathy-Cramer, J. The consolidated ImageCLEFmed Medical Image Retrieval Task Test Collection, J. of Digi. Img., Vol. 22(6), 648-655.
[16]Everingham, M., Van Gool, L., Williams, C.K. et.al. 2010. The PASCAL Visual Object Classes (VOC) Challenge Int. Journal. of Computer Vision, 88(2), 303-338.
[17]Hall, M., Frank, H., Holmes, G., Pfahringer, B., Reutemann, P., Witten, I.H, 2009. The WEKA Data Mining Software: An Update. SIGKDD Explorations, Volume 11, Issue 1, 10-18.
[18]Banda, J.M. and Angryk, R. 2010. Selection of image parameters as the first step towards creating a CBIR System for the solar dynamics observatory. DICTA 2010. Sydney, Australia, 528-534.
[19]Banda, J.M. 2011. Framework for creating large-scale content-based image retrieval system (CBIR) for solar data analysis. Ph.D thesis, Dept. Comp. Sci, M.S.U..
[20]Lamb, R. 2008. An Information Retrieval System For Images From The Trace Satellite, M.S. thesis, Dept. Comp. Sci., M.S.U.
[21]Orlov, N., Shamir, L., Macura, T., Johnston, J., Eckley, D.M., Goldberg, I.G. 2008. WND-CHARM: Multi-purpose image classification using compound image transforms. Pattern Recognition Letters. 29(11): 1684-93
[22]Vasconcelos, N. and Vasconcelos, M. 2004. Scalable Discriminant Feature Selection for Image Retrieval and Recognition. In CVPR 2004, 770–775.
[23]Kullback, S. and Leibler, R.A. 1951. On Information and Sufficiency. Annals of Mathematical Statistics 22 (1): pp. 79–86.
[24]Borg, I. and Groenen, P. 2005. Modern multidimensional scaling: theory and applications (2nd ed.), Springer, NY.
[25]Guo, G. D., Jain, A.K. and Ma, W.Y. 2002. Learning similarity measure for natural image retrieval with relevance feedback. IEEE Trans. on Neural Net.Vol 13(4):811—820.
[26]Aggarwal, C., Hinneburg, A., Keim, D.A. 2001. On the surprising behavior of distance metrics in high dimensional space. Database Theory—ICDT 2001: 420-434.
[27]Ye, J., Janardan, R. and Li, Q. 2004. GPCA: an efficient dimension reduction scheme for image compression and retrieval. In KDD '04. ACM, New York, NY, 354-363.
[28]Moravec, P. and Snasel, V. 2006. Dimension reduction methods for image retrieval. In. ISDA ‘06. IEEE Computer Society, Washington, DC, 1055-1060.
[29]Banda, J.M, Angryk, R., Martens, P.C.H. 2012. On dimensionality reduction for indexing and retrieval of large-scale solar image data. Solar Physics: Image processing in the petabyte era. Springer 2012. DOI: 10.1007/s11207-012-0027-4. Vol. 283, Issue 1, 113-141.
[30]Matlab Toolbox for Dim. Reduction [Online] Available: http://homepage.tudelft.nl/19j49/ [Accessed: Oct 10, 2013]
[31]Faloutsos, C. 1996. Searching Multimedia Databases by Content (1st ed.), Springer.
[32]Jagadish, H. V., Ooi, B. C., Tan, K., et.al. 2005. iDistance: An Adaptive B+-tree Based Indexing Method for Nearest Neighbor Search. ACM TODS, 30, 2, 364-397.