Development of a New Model of IPFC for Power Flow in
Multi-Transmission Lines
D.Suresh Babu
1, Nikhil Sahu
2Electrical & Electronics Engg GGITM, Bhopal, India
1
[email protected]
P.S.Venkataramu
Professor
Electrical & Electronics Engg GGITM, Bhopal, India
M.S.Nagaraj
Professor & HOD Electrical & Electronics Engg
BIET, Davangere, India
ABSTRACT
Interline Power Flow Controller (IPFC) is one of series - series controlled Flexible Alternating Current Transmission System (FACTS) devices, which has the capability of controlling the power flow in multi transmission lines. In this paper, Power Injection Model (PIM) is proposed by using voltage source converters (VSCs). The proposed model is incorporated in Newton-Raphson (NR) power flow solution method and analyzed with a MATLAB program. A study on variation of power flow, bus voltages in all transmission lines and buses for different values of IPFC parameters has been carried out on standard 2 machine 5 bus system.
General Terms
FACTS, Newton-Raphson power flow method, multi transmission lines.
Keywords
Voltage Source Converters, Interline Power Flow Controllers Power Injection Model.
1.
INTRODUCTION
Recent power systems are undergoing a profound transformation in the form of restructuring. Many private power companies have entered in to the power industry. This has resulted in complicated operation and control of large interconnected grid systems. In this changing scenario, the primary challenge for power engineers is to efficiently control the active and reactive power flows in a specific transmission line or the corridor due to dynamically changing inter grid transactions. Control of power flows should be achieved without generation rescheduling or topological changes in order to enhance the power system performance [1]. Flexible AC Transmission systems (FACTS) controllers are proved to be very useful in achieving the control of power flows without disturbing the generation scheduling or topological changes and in addition these devices will also enhance the secured operation of power systems [2-5]
.
Among the family of FACTS controllers, the IPFC is emerged as the most comprehensive device as it is capable of providing simultaneous control of active and reactive power flow in multi-transmission lines. For the past one decade the research in FACTS area is primarily focused on IPFC. The IPFC provides the facility for independently controllable reactive (series) compensation of each individual line and to directly transfer or exchange real power between the compensated lines [6]. The three basic attributes of the converter-based technology is superior operating and performance characteristics, functional convertibility, and system operational adaptability and expandability, which is to solve the transmission problems economically [7]. The modeling of IPFC has been proposed in [8] using voltage source
converters. The importance of modeling FACTS devices in the deregulated power system has been given in [9].
The rest of the paper is organized as follows: Section 2 introduces the proposed model of IPFC. Section 3 explains the algorithm incorporating IPFC in the given power system. Section 4 deals with the case study and results of the proposed algorithm. Finally, the conclusion is presented in section 5.
2.
MODELING OF INTERLINE POWER
FLOW CONTROLLER
This section explains about the basic power flow equations and the modeling of IPFC to incorporate in NR load flow solution.
2.1
Basic Power Flow Equations
The basic power flow equations [10] are as below
Where Apparent Power
Voltage of a particular bus Current in the transmission line
From equation (1) the active and reactive power flow equations can be written as below
Where
Voltage at bus i
Voltage at bus j
Admittance for the transmission line i-j
2.2
Modeling of Interline Power Flow
Controller
The basic modeling of FACTS devices can be done in two ways [1].
i) Current Source Converters(CSC) ii) Voltage Source Converters(VSC)
The new method of IPFC model has been developed with the help of VSC by using two SSSCs.
34
Fig 1: Conceptual hardware configuration of IPFC
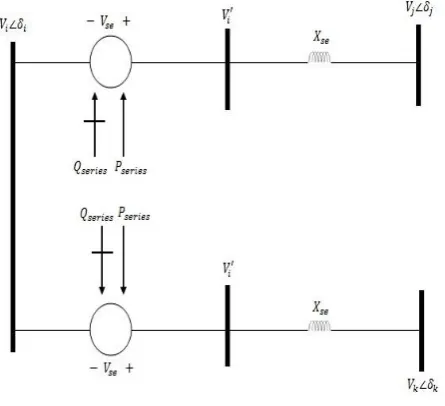
[image:2.595.318.539.125.255.2]The equivalent circuit diagram of figure-1 with a series connected VSC in the transmission lines i-j & i-k is shown in figure-2.
Fig 2: Equivalent circuit of IPFC
The transformer is represented as a series reactance with the reactance of transmission line and with a series voltage source.
represents an imaginary voltage behind the reactance
Where
S
eries voltage is controlled by both in magnitude and phase angle.
Where and
[image:2.595.316.532.328.544.2]The phasor diagram of the concerned parameters in equation (5) & (6) is shown in figure 3
Fig 3: Phasor diagram
Voltage of bus ‘’, is assumed to be reference vector i.e.
.
The power injected model can be obtained by replacing the voltage source by a current source in parallel with transmission line as shown in figure 4.
Fig 4: Replacement of series voltage sources by a current source
current flowing in the transmission lines can be given as
The effect of current source and susceptance can be modeled by injected powers at buses , , .
The injected apparent power at bus ‘ ’ is given as
Rewriting equation (7) we get equation (8)
From equation (8) separating injected active and reactive
power, we get
The injected apparent power at bus ‘’ is given as
Rewriting equation (11) we get equation (12)
[image:2.595.59.282.343.546.2]From equation (12) separating injected active and reactive power, we get
The injected apparent power at bus ‘ ’ is given as
Rewriting equation (15) we get equation (16)
From equation (16) separating injected active and reactive power, we get
The injected powers are used for rewriting the Jacobian matrix used in Newton-Raphson power flow method.
The modified Jacobian matrix is given below
3.
PROPOSED ALGORITHM
In this section the proposed algorithm is discussed The steps for power flow solution using NR method after injecting IPFC in the system is as given below:
Step-1: Collect the Load flow data and IPFC data Step-2: Compute matrix from line data. Step-3: Set iteration h=0
Step-4: Compute modified active and reactive powers using equations (9), (10), (13), (14), (17), (18).
Step-5: Use the modified Jacobian matrix from equation (19) to compute the active and reactive power mismatch.
Step-6: If the power mismatch is under the tolerable limit, it results in output. Else go to step 7.
Step-7: Compute the change in voltage magnitude and angles using N-R method.
Step-8: Update NR equations by fixing and varying ‘ ’ and ‘ ’ respectively and vice-versa.
Step-9: Set h=h+1, go to step 4.
4.
SIMULATION RESULTS
In order to study the effect of IPFC on bus voltages & Power flows, a case study is conducted on 5-bus system. This system has 2 generator buses and 3 load buses and 7 transmission lines. Bus 1 is considered as slack bus and bus-2 as generator bus and 3, 4, 5 are load buses [11]. IPFC was installed in the system and the effectiveness was analyzed by changing the parameters.
Installation of IPFC near node-4 with 3 & 5 as sub nodes, i.e 4-5 and 4-3 are the two transmission lines, where IPFC has been incorporated in the system. Bus voltage magnitudes and angles of 3, 4 & 5 buses and lines 3-4 and 4-5 were considered for the analysis as IPFC was incorporated. The detailed analysis has been carried out in two cases.
4.1
Case-I:
Keeping
fixed
and
varying
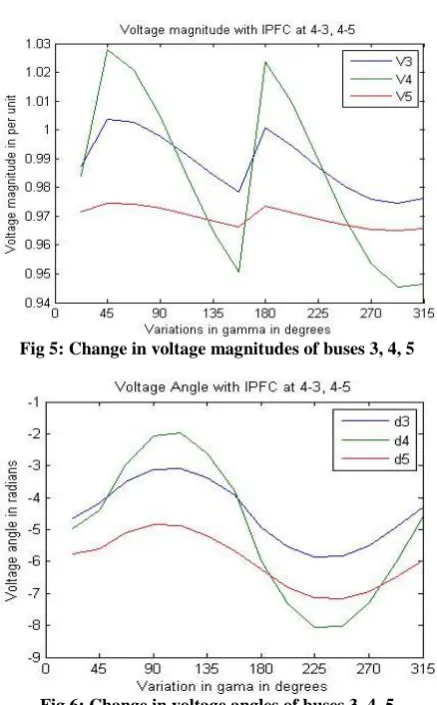
In this case, ‘ ’ is kept constant at 0.01 and ‘ ’ is varied from– . The variation of voltage magnitude and angle at buses 3, 4 and 5 are shown in figure-5 & 6. At =20.62o, voltage at buses 3, 4 and 5 is maximum i.e., 1.0036, 1.028 and0.9746 and at =-151.26o voltage at bus 3, 4 and 5 is maximum i.e., 0.9746, 0.9455 and 0.9651 respectively.
It is also observed that the variation in voltage magnitude of bus-5 is very less compared to buses 3&4. As bus-4 was the common bus for injecting IPFC in the system, the variation in voltage magnitude of this bus is very high.
36
[image:4.595.321.539.134.286.2]Fig 5: Change in voltage magnitudes of buses 3, 4, 5
Fig 6: Change in voltage angles of buses 3, 4, 5
The active power flow in the transmission lines 3-4, 4-5 are given in figure-7. As varies the variation in active power flow through the transmission line 3-4 is high and =3.14 to -0.11 radians the active power flow has been transmitted from 3-4 and from =-0.12 to 3.14 radians the active power transfer is in 4-3 direction. The active power variation in 4-5 line is very less compared to 3-4 line and the direction of the power flow remains same in all conditions because of the line impedance in 5 is 8-times greater than the line impedance 3-4.
Fig 7: Change in active power flow in lines 3-4 & 4-5
Figure-8 shows the reactive power flow in the transmission lines 3-4, 4-5. As varies the variation in power flow through the transmission line 3-4 is high and from =0 to 2.86, radians the power has transmitted from 3-4 and from = -3.14 to -1.39 and = 1.985 to 3.14 radians the power flow has been
[image:4.595.321.540.457.617.2]transmitted from 3-4 and = -1.39 to 1.984 radians, the reactive power flow is in 4-3 direction. The direction of reactive power flow is in 4-5 as varies from -1.39 to 3.14 radians and the reversal of the reactive power occurs for a small change in the value of i.e., =-3.14 to -1.38.
Fig 8: Change in reactive power flow in lines 3-4 & 4-5
4.2
Case-II:
Keeping
fixed
and
varying
In this case, ‘ ’ is kept constant at 20.62o
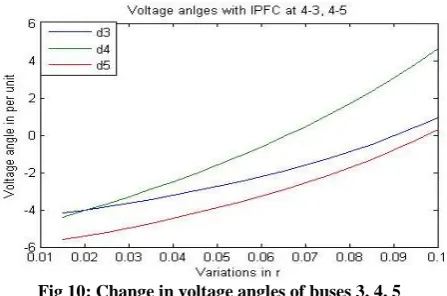
and ‘ ’ is varied from 0.01 to 0.1. The voltage and angle variation at buses 3, 4 and 5 are shown in figures-9&10. When the value of is increasing the injected power also increase. As the injected power increases, the common bus at where IPFC has incorporated i.e., bus-4 has the highest voltage magnitude & angle. The maximum value observed at all the three buses was 1.21, 1.6286, 1.0416 p.u, and 0.9476, 4.6274, 0.0.287 radians. When r=0.1. so, whenever there is a need in improving voltage at the required bus, variation of this parameter by fixing will be more effective.
[image:4.595.64.270.545.694.2]Fig 10: Change in voltage angles of buses 3, 4, 5
[image:5.595.58.282.71.219.2]The active power flow in the transmission lines 3-4, 4-5 are given in figures-11&12.As r varies the variation of active power flow in the line 3-4 is more compared to line 4-5. The active power magnitude variation in lines 4-5, 3-4 is almost 0.5 & 3.5 p.u respectively. The variation in line 3-4 is more because of the line impedance in 3-5 is 8-times greater than the line impedance 3-4. So, whenever the power injection increases at bus-4, line 3-4 gets affected more than line 4-5. The same follows for the reactive power flow also.
Fig 11: Change in active power flow in lines 3-4 & 4-5
Fig 12: Change in active power flow in lines 3-4 & 4-5
5.
CONCLUSION
The new power injection model of latest FACTS device i.e., Interline Power Flow Controller including the modified Jacobian has been presented. The proposed model has been incorporated in Newton-Raphson power flow solution method
to study the effects of IPFC parameters in power flow studies. Numerical results on the test system have demonstrated the proposed IPFC model would yield fairly accurate results with regards to bus voltages and power flows. The Available Transfer Capability (ATC) of the required transmission lines has been increased as the power transfer through the particular line has reduced
.
The total system loss can be controlled by choosing proper values of IPFC parameters.6.
ACKNOWLEDGMENTS
Authors are grateful to the management of Gyan Ganga Institute of Technology &Management, Bhopal and also to the management of Bapuji Institute of Engineering and Technology, Davangere. Authors also wish to thank Dr.Ravindranath.C.C, Director, Research Incubation Centre, GGITM for valuable suggestions during this work.
7.
REFERENCES
[1] E.Larsen, N.Miller ,S. Nilson and S.Lindgren “Benefits of GTO- Basedcompensation systems for electric utility applications” IEEE Transactions on Power Delivery, Vol. 7,No. 4, , October 1992 pp 2056 2064.
[2] N.G. Hingorani, “Flexible AC Transmission”, IEEE spectrum, April 1993, pp 40-45.
[3] L.Gyugi, C.D.Schauder, Kalyan K.Sen, “Static Synchronous Series Compensator: A Solid-State Approach to the Series Compenstion of Transmission Lines”, IEEE Transaction on Power Delivery, Vol.12, No.1, January 1997.
[4] L.Gyugi, C.D.Schauder, S.L.Williams, T.R.Rietman, D.R.Torgerson, A.Edris, “The Unified Power Flow Controller: A New Approach to Power Transmission Control”, IEEE Transaction on Power Delivery, Vol.10, No.2, April 1995, pp.1085-1097
[5] Laszlo Gyugyi, “Application Characteristics of Converter-Based FACTS Controllers”, Proceedings International Conference on Power Con 2000. Page(s):
391 - 396 vol.1. 2000.
[6] Laszlo Gyugyi, Kalyan K. Sen, Colin D. Schauder, “The Interline Power Flow Controller Concept: A new Approach to Power Flow Management in transmission System”, IEEE Transactions on Power Delivery, Vol.14, No.3, July1999
[7] Xia Jiang, Xinghao Fang, Joe H.Chow, Abdel-Aty Edris, Edvina Uzunovic, Michael Parisi, and Liana Hopkins, “A Novel Approach for Modeling Voltage-Sourced Converter-Based FACTS Controllers”, IEEE Transactions on power delivery vol.23, no.4, p.gno: 2591-2598, October2008.
[8] X.P.Zhang, “Modelling of the interline power flow controller and the generalized unified power flow controller in Newton power flow”, IEE Proc-Gener, Transm, Distrib, Vol.150, No.3, May 2003.
[9] K.S. Verma, S.N. Singh and H.O. Gupta, “FACTS Devices Location For Enhancement of Total Transfer Capability”, IEEE Power Engineering Society, Winter Meeting, Vol.02, pp.522-527, 28-Jan-01 Feb 2001, Columbus, OH.
[10]William D .Stevenson,Jr., Elements of Power System Analysis, 4th ed, McGraw-Hill, International edition 1982, ISBN 0-07-066584-2, pp.198-199.
[image:5.595.60.275.507.684.2]