: v i> v p. i >
:S!Of»
M F T 8 0 D SPERPUSTAKAAN KUi TTHO
KOLEJ UNIVERSITI T E K N O L Q G I T U N H U S S E I N O N N
JUDUL:
B O R A N G P E N G E S A H A N S T A T U S T E S I S *
l. <3
+-L-Saya
S E S I P E N G A J I A N :
yi \3_ VA^S.V-VS'SL-^^V •& •
( H U R U F B E S A R )
•mengaku m e m b e n a r k a n tesis ( P S M / S a r j a n a / D o k t o r Falsafah)* ini disimpan di Perpustakaan dengan syarat-syarat kegunaan seperti berikut:
1. Tesis adalah hakmilik Kolej Unive.-.-:-:-TeknoIogi T u n Hussein O n n .
2. Perpustakaan dibenarkan m e m b u a t salinan untuk tujuan pengajian sahaja.
3. Perpustakaan dibenarkan m e m b u a t salinan tesis ini sebagai b a h a n pertukaran antara institusi pengajian tinggi.
4. **Sila tandakan ( / )
S U L I T (Mengandungi m a k l u m a t yang berdarjah keselamatan atau kepentingan Malaysia seperti yang termaktub di dalam
A K T A R A H S I A RASMI 1972)
(Mengandungi maklumat T E R H A D yang telah ditentukan oleh organisasi/badan di m a n a penyelidikan dijalankan)
T E R H A D
V - T I D A I C T E R H A D
Disahkan oleh
( T A N D A T A N G A N PENULTS) ( T A N D A T A N G A N P E N Y E L I A )
Alamat Tetap:
Tarikh: - vV - O-o 0 4
N a m a Penyelia
Tarikh: a-00<K
C A T A T A N : * P o t o n g y a n g tidak b e r k e n a a n .
** Jika tesis ini SULIT atau TERHAD, sila lampirkan surat daripada pihak bcrkuasa/organisasi berkenaan dengan menyatakan sekali sebab dan tempoh tesis ini perlu d i k e l a s k a n sebagai S U L I T atau T E R H A D . .. . .
ENERGY FORECAST USING LINEAR REGRESSION METHODS
NOOR HASNIZAM BIN HANAFI
This thesis is submitted as partial fulfilment of the requirements for the award of the Master Degree of Electrical Engineering
Faculty of Electrical and Electronic Engineering
Kolej Universiti Teknologi Tun Hussein Onn
11
"We declare we have read this thesis and in our opinion the scope and quality of it is enough for the purpose of rewarding Master of Electrical Engineering".
Signature Supervisor 1 Date
Prof Dr Ramiah Jegatheesan 22 November 2004
Signature Supervisor 2 Date
Signature Supervisor 3 Date
Prof Dr Wolfgang Schellong
iii
"I declared that this report is the result of my own except for notes and writings which I have stated the source of them".
Signature Name Date
& ,
iv
A C K N O W L E D G M E N T S
Writing this thesis was like putting together a big jigsaw puzzle. Without the clues
along the way, the final picture might have appeared much later and perhaps fuzzier. I
would like to thank the kind individuals, who supplied these clues and some of the
missing pieces.
I would like to acknowledge Professor Dr Wolfgang Schellong as my advisor. I thank
Professor Dr Schellong for conceiving the ideas behind this work, and for affording me
the opportunity to conduct this research. I also thank him for showing much patience
with me, and for providing assistance and guidance without reservation while overseas
during the summer. I also thank m y other professors and committee members from
whom I've learned so much throughout m y course of study. I would also like to
recognize M r Felix Wedel of Fachhochschule Koln for providing some key pieces of
information from his previous work in this area. These items were vital to the
completion of this thesis. I thank m y parents, Mr Hanafi and Mrs Noorma, for never
questioning the path I wanted to take, and supporting me in whatever I choose to do.
Most of all, I would like to thank m y girl friend, Nor Asilah, for her endless support and
patience throughout m y graduate school experience.
On financial support, I acknowledge the Master Degree Programme's generous
contribution towards m y tuition in the early years. I am also grateful for the support of
the Overseas Research Scholarship (KUKUM).
I also acknowledge the advice and encouragement of other colleagues and friends who
V
ABSTRACT
Energy analysis and forecasting have always been the essential part of an efficient
energy system planning and operation. This thesis presents the mathematical methods
based on regression analysis and energy profiling for energy modelling and forecasting.
Two applications of energy were analyzed such as energy heating demands and
electricity demands. The methods are applied for the Energieversorgung Offenbach AG
(EVO) in Gravenbruch and Offenbach at Germany, using 1995 and 2003 dat^ The
models of energy heating demands were developed based on simple linear and multiple
regression methods. The Mean Absolute Percentage Errors (MAPE) are compared
between two models. Two approaches to determine the typical energy profile are
proposed. The two approaches use similar outdoor temperature for energy heating
demand profiles and for electricity demands using similar electricity profile. The
XI
CONTENT
CHAPTER DESCRIPTION PAGE
Declaration ii Acknowledgement iv
Abstract v Content vi List of Table x List of Figure xiii List of Symbol xvii List of Appendixes xviii
I INTRODUCTION
1.1 Overview 1 1.2 Objectives 2 1.3 Organisation of this thesis 3
II LITERATURE REVIEW
2.1 Review of methods or technique in published 5 literature
2.2 Literature review for energy profile 6
2.3 Discussion 7
III THEORY OF ENERGY MODELLING,
FORECASTING AND PROFILING
3.1 Liberalisation of energy market 8 3.1.1 Solution of liberalisation in energy 10
industry
3.2 Principles of energy analysis and forecasting 11
3.3 Factors affecting energy demand 12
vii
3.5 Electricity profiling 3.6 Regression Analysis
3.6.1 Simple linear regression model 3.6.2 Regression coefficient estimation 3.6.3 Test of hypothesis
3.6.4 Quality of fit
3.6.5 Multiple linear regressions
IV RESEARCH METHODOLOGY
4.0 Methodology 27 4.1 Energy heating Demand 27
4.1.1 Data Analysis 28 4.1.2 Group of data 29 4.1.3 Mathematical modelling methodology 31
4.1.4 Energy heating forecasting results 32
4.1.5 Validation of results 33 4.1.5.1 Mean absolute percentage error, 33
MAPE
4.1.5.2 Coefficient of determination, R2 34 4.2 Daily typical energy heating demand profile 34
methodology
4.3 Electricity demand profiles 35
V RESULTS
5.1 Introduction 38 5.2 Results for modelling of seasonally energy 39
heating demand based on simple linear regression (Offenbach City)
5.3 Results for modelling of seasonally energy 41 heating demand based simple linear regression
Vlll
5.4 Comparison the coefficient of determination, 42 R2 and Mean Absolute Percentage Error
5.5 Results for modelling of seasonally energy 44 heating demand based on multiple linear
regressions (Offenbach City)
5.6 Results for modelling of seasonally energy 45 heating demand based on multiple linear
regressions (Gravenbruch City)
5.7 Comparison the Mean Absolute Percentage 47 Error based on multiple linear regressions
5.8 Comparison the Mean Absolute Percentage 48 Error, MAPE between simple linear regression
and multiple linear regressions models
5.9 Modelling and forecasting of hourly energy 49 heating demand based on simple linear
regression
5.10 Modelling and forecasting of hourly energy 63 heating demand based on multi linear
regressions
5.11 Comparison of hourly energy heating demand 71 forecast between simple linear regression
model and multiple linear regressions model.
5.12 Result for typical energy heating profile 75 5.13 Result for typical profile for electricity demand 82
VI DISCUSSION
6.1 Discussion for energy heating analysis and 84 forecasting
CONCLUSSIONS
7.1 Conclusions for energy heating analysis and forecasting
7.2 Conclusions for daily typical energy heating demand profile
LIST OF T A B L E TABLE NO Table 4.1 Table 4.2 Table 5.1 Table 5.2 Table 5.3 Table 5.4 Table 5.5 Table 5.6 Table 5.7 Table 5.8 Table 5.9 Table 5.10 Table 5.11 TITLE
Number of data for Offenbach City (1995)
Number of data for Gravenbruch City
Analysis results for seasonally energy heating
demand during weekdays (Offenbach)
Analysis results for seasonally energy heating
demand during workdays (Offenbach)
Analysis results for seasonally energy heating
demand during holidays (Offenbach)
Analysis results for seasonally energy heating
demand during weekdays (Gravenbruch)
Analysis results for seasonally energy heating
demand during workdays (Gravenbruch)
Analysis results for seasonally energy heating
demand during holidays (Gravenbruch)
The Coefficient of determination, R for Offenbach
City
The Mean Absolute Percentage Error (MAPE) for
Offenbach City
Analysis results based on multiple linear
regressions for seasonally energy heating demand
during weekdays (Offenbach)
Analysis results based on multiple linear
regressions for seasonally energy heating demand
during workdays (Offenbach)
Analysis results based on multiple linear
regressions for seasonally energy heating demand
during holidays (Offenbach)
XI Table 5.12 Table 5.13 Table 5.14 Table 5.15 Table 5.16 Table 5.17 Table 5.18 Table 5.19 Table 5.20 Table 5.21 Table 5.22 Table 5.23 Table 5.24
Analysis results based on multiple linear
regressions for seasonally energy heating demand during weekdays (Gravenbruch)
Analysis results based on multiple linear
regressions for seasonally energy heating demand during workdays (Gravenbruch)
Analysis results based on multiple linear
regressions for seasonally energy heating demand during holidays (Gravenbruch)
Mean Absolute Percentage Error (MAPE) based on multiple linear regressions for Offenbach City Mean Absolute Percentage Error (MAPE) based on multiple linear regressions or Gravenbruch City Analysis results for the hourly energy heating demand in Offenbach (workday)
Analysis results for the hourly energy heating demand in Gravenbruch (workday)
Analysis results for the hourly energy heating demand in Offenbach (holiday)
Analysis results for the hourly energy heating demand in Gravenbruch (holiday)
Analysis results for the hourly energy heating demand in Offenbach (workday) based on simple linear regression model
Analysis results for the hourly energy heating demand in Gravenbruch (workday) based simple linear regression model
Analysis results for the hourly energy heating demand in Offenbach (holiday) based simple linear regression model Analysis results for the hourly energy heating demand in Gravenbruch (holiday) based simple linear regression
Xll
Table 5.25
Table 5.26
Table 5.27
Table 5.28
model
Analysis results for the hourly energy heating demand in 64
Offenbach (workday) based multiple linear regressions
model
Analysis results for the hourly energy heating demand in 66
Gravenbruch (workday) based multiple linear regressions
model
Analysis results for the hourly energy heating demand in 68
Offenbach (holiday) based multiple linear regressions
model
Analysis results for the hourly energy heating demand in 70
Gravenbruch (holiday) based multiple linear regressions
xiii
LIST OF FIGURE
FIGURE NO TITLE PAGE
Figure 1.1 The energy heating demand versus outdoor 2
temperature
Figure 3.1 The influenced factor affecting the energy demand 13
Figure 3.2 The heating power plant at Offenbach, Germany 14
Figure 3.3 A simple district heating network containing one heat 15
producer and two consumers
Figure 3.4 A substation consisting of heat exchangers (the shaded 16
boxes), control valves, pumps and a control unit. The
radiator system (household heating) is controlled by the
control unit, using information about actual outdoor
temperature
Figure 3.5 . The vertical deviations whose sum of squares is 20
minimised for the least squares procedure
Figure 3.6 A graph of the probability density function of t-distribution. 22
The p value for the t test is the shaded areas under the curve.
Figure 4.1 Structure of the energy heating modelling and forecasting 28
Figure 4.2 Two districts heating was analyses: 1) Offenbach 29
2) Gravenbruch
Figure 4.3 The relationship between the outdoor temperature and 30
energy heating demand for Offenbach City
Figure 4.4 The relationship between the outdoor temperature and 31
energy heating demand for Gravenbruch City
Figure 4.5 Flow chart of typical electricity demand profile 36
determination
Figure 5.1 The estimated temperature dependence, Pi for Offenbach 51
xiv
Figure 5.2.1 Energy heating demand versus hourly 52 Figure 5.2.2 Outdoor temperature versus hourly 52 Figure 5.2.3 Absolute percentage error versus hourly 53 Figure 5.3 The estimated temperature dependence, (31 for Gravenbruch 55
during workday
Figure 5.4.1 Energy heating demand versus hourly 55 Figure 5.4.2 Outdoor temperature versus hourly 56 Figure 5.4.3 Absolute percentage error versus hourly
Figure 5.5 The estimated temperature dependence, Pi for Offenbach 58 during holiday
Figure 5.6.1 Energy heating demand versus hourly 58 Figure 5.6.2 Outdoor temperature versus hourly 59 Figure 5.6.3 Absolute percentage error versus hourly 59 Figure 5.7 The estimated temperature dependence, pi for Gravenbruch 61
during holiday
Figure 5.8.1 Energy heating demand versus hourly 61 Figure 5.8.2 Outdoor temperature versus hourly 62 Figure 5.8.3 Absolute percentage error versus hourly 62 Figure 5.9 Typical energy heating profile for Offenbach and 65
Gravenbruch Cities during holiday on winter season when the average outdoor temperature is tA < 0°C
Figure 5.10 Typical energy heating profile for Offenbach and 67 Gravenbruch Cities during holiday on winter season
when the average outdoor temperature, tA is 0°C < tA < 5°C
Figure 5.11 Typical energy heating profile for Offenbach and 69 Gravenbruch Cities during holiday on winter season
when the average outdoor temperature, tA is 5°C < tA < 10°C.
Figure 5.12 Typical energy heating profile for Offenbach and 71 Gravenbruch Cities during workday on winter season
when the average outdoor temperature, tA is tA < 0°C
XV
Gravenbruch Cities during workdays on winter season when the average outdoor temperature, tA is 0°C < tA < 5°C.
Figure 5.14 Typical energy heating profile for Offenbach and 73 Gravenbruch Cities during workdays on winter season
when the average outdoor temperature, tA is 5°C < tA < 10°C. Figure 5.15 The comparison of hourly energy heating demand forecast 74
between simple linear regression models and multiple linear regressions model for Gravenbruch in winter (workday)
Figure 5.16 The comparison of hourly energy heating demand forecast 75 between simple linear regression models and multiple linear
regressions model for Gravenbruch in winter (holiday)
Figure 5.17 Typical energy heating profile for Offenbach and 76 Gravenbruch Cities during holiday on winter season when
the average outdoor temperature is tA < 0°C
Figure 5.18 Typical energy heating profile for Offenbach and 77 Gravenbruch Cities during holiday on winter season when
the average outdoor temperature, tA is 0°C < tA < 5°C.
Figure 5.19 Typical energy heating profile for Offenbach and 78 Gravenbruch Cities during holiday on winter season when
the average outdoor temperature, tA is 5°C < tA < 10°C.
Figure 5.20 Typical energy heating profile for Offenbach and 79 Gravenbruch Cities during workday on winter season when
the average outdoor temperature, tA is tA < 0°C
Figure 5.21 Typical energy heating profile for Offenbach and 80 Gravenbruch Cities during workdays on winter season when
the average outdoor temperature, tA is 0°C < tA < 5°C.
Figure 5.22 Typical energy heating profile for Offenbach and 81 Gravenbruch Cities during workdays on winter season when
the average outdoor temperature, tA is 5°C < tA < 10°C.
LIST OF SYMBOL
° C D e g r e e Cclcius
E H D E n e r g y H e a t i n g D e m a n d
T O u t d o o r T e m p e r a t u r e
A T T e m p e r a t u r e D i f f e r e n c e
|30 R e g r e s s i o n c o e f f i c i e n t
[3i R e g r e s s i o n coefficient
P2 Regression coefficient
1
CHAPTER I
INTRODUCTION
1.1 Overview
Over the last several decades, there has been an increase of activity in the field of energy management. Strategic energy management include modelling and
forecasting, benchmarking, energy use and cost analysis, and measurement and verification [1]. These applications allow organisations to gain a comprehensive understanding of current energy performance, plan and select cost effective energy conversation measures, track performance of measures that have been implemented, and verify the savings realised. Energy management is the judicious and effective use of energy to maximize profits (minimize costs) and enhance competitive position [2]. Energy management practice has traditionally focused exclusively on technologies that increase the energy efficiently of key energy consuming process and equipment.
Modelling, forecasting and profiling of energy are part of energy management strategic.
2
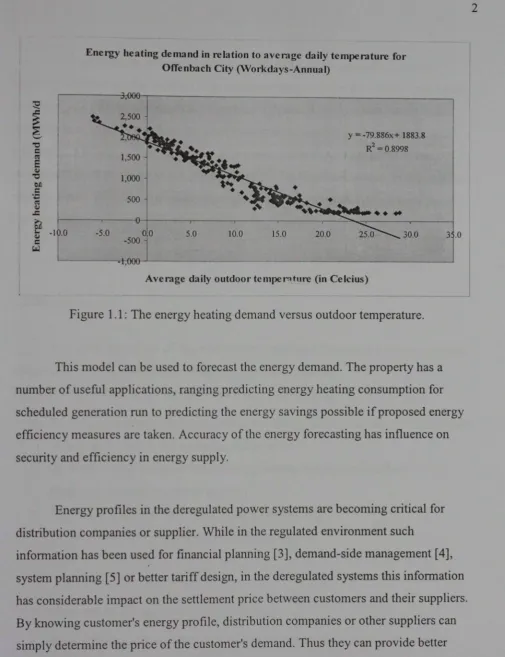
[image:21.600.48.554.12.670.2]Energy heating demand in relation to a v e r a g e daily temperature for Offenbach City (Workdays-Annual)
Figure 1.1: The energy heating demand versus outdoor temperature.
This model can be used to forecast the energy demand. The property has a number of useful applications, ranging predicting energy heating consumption for scheduled generation run to predicting the energy savings possible if proposed energy efficiency measures are taken. Accuracy of the energy forecasting has influence on security and efficiency in energy supply.
Energy profiles in the deregulated power systems are becoming critical for distribution companies or supplier. While in the regulated environment such
3
All customers in an open electricity market should, in principle, have such metering equipment what requires huge additional expenses for the meters' installation. However, most of the customers participating in the retail market don't posses such metering equipment. Therefore, for these customers it is important to establish "fair" and accurate billing system and access to the retail market. An alternative to the
settlement based on metered demand is energy profile based settlement. In this manner each customer, without appropriate meters, is assigned a representative energy profile. For that reason it is necessary to determine energy profiles.
1.2 Objectives
The main objectives of this study are to model and forecast the energy demand using mathematical method and energy profiles determination.
The following studies to achieve the objectives proposed are:
To develop a simple model to predict the energy heating demand of building and industrial enterprise by regression analysis.
• To study a relationship between energy heating demand and outdoor temperature using regression analysis.
• To present a method for energy heating forecasting. • To determine the typical energy heating profile
Two applications of energy forecast were analyzed:
4
1.3 Organisation of this thesis
This thesis is divided into 6 chapters.
Chapter 2 described the literature for model of energy and forecasting. Within the
literature review, the model of energy analysis and forecasting in previous work were
presented.
Chapter 3 consists of two parts discussing the economic of energy and mathematical
method for energy analysis and forecasting. Part 1 starts with the overview of
liberalization of energy, the impact of liberalization of energy market and solution for
liberalization of energy. The mathematical methods for energy analysis and forecasting
are described in Part 2.
In Chapter 4, the research methodologies were presented. The methodology describes
the steps taken to answer the research questions. Presentation of data collected compiles
pertinent tables and charts collected during the research.
Data analysis follows with a statistical and graphical review of the information
presented. All the results are presented in Chapter 5.
Chapter 6 discusses all the result for energy analysis and forecasting.
5
CHAPTER II
LITERATURE REVIEW
2.1 Review of methods or technique in published literature
A survey of the published literature dealing with the modelling, forecasting and profiling of energy demand was performed. The emphasis of the survey was on methods that would be useful to consider for modelling, forecasting and profiling. Methods used to analyze energy demand data were also examined for applicability to the buildings of interest for this study. From the sources reviewed, 11 reports of interest to this survey were identified in the literature. There were two principal sources for these reports: the thesis and IEEE Transactions for the years 1985 to 2004.
Five general approaches were developed to define the modelling, forecasting and profiling methods found in the literature. These approaches are using:
• Statistical approaches like the Box and lenkin's model, exponential smoothing, linear and multiple regressions, adaptive and weather models Expert system
Artificial neural network Fuzzy Logic