© 2016, IRJET | Impact Factor value: 4.45 | ISO 9001:2008 Certified Journal | Page 580
Land Mapping Based On Hyperspectral Image Feature Extraction Using
Guided Filter
Fazeela Hamza
1, Sreeram S
21M.Tech Student, Dept. of Computer Science & Engineering, MEA Engineering College, Perinthalmanna, Kerala,
India
2Associate professor & HOD,Dept. of Computer Science & Engineering, MEA Engineering College, Perinthalmanna,
Kerala, India
---***---Abstract -
In the area of Remote Sensing as well asGeosciences, whenever a particular scene is captured, it becomes very difficult to identify each and every object in the image. Here comes the advantage of using hyperspectral imaging and feature extraction method. Hyperspectral images are taken using satellites. To classify such images feature extraction is an effective method .The problem of the “curse of dimensionality” emerges when a statistic based classification method is applied to the hyperspectral data. A simpler and an effective way of processing with hyperspectral data is to reduce the dimensionality. This can be done by feature extraction that a small number of features are extracted from the hyperspectral image when confronted with a limited set of training samples. This paper mainly focuses on guided filtering. Guided filtering with SVM classifier will yield a better accuracy
.
Key Words:Remote sensing, Hyperspectral image,
Feature extraction, Guided filter, Curse of
dimensionality
.
1. INTRODUCTION
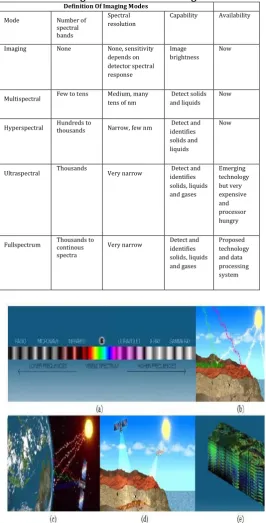
One of the first application of digital images was in the newspaper industry when pictures were send by submarine cable between London and New York. Introduction of Bartlane cable picture transmission system in 1920s reduced the time required to transport pictures. Then new technologies were introduced in the field of digital image processing. To review different modes of digital images refer table 1 shown below.
Hyperspectral Imaging is the foremost research area in Remote Sensing. It combines both digital imaging and spectroscopy. Hyperspectral imaging collects information from the Electromagnetic Spectrum. This technology is used largely in the industry of Minerals, Coal, Oil and Gas etc. Hyperspectral images provide researchers with a picture of the surface of a surveyed area so they can produce some conclusions. Human eyes only see visible
band of the light spectrum. Many more bands of non-visible light spectrum exist to the left and right of non-visible spectrum with higher and lower frequencies. This is called as Electromagnetic Spectrum. Ultra-violet, x-rays, radio waves, micro waves and infra-red radiations these are the various rays contained in electromagnetic spectrum as shown in figure 1(a). Hyperspectral Imaging is a technology which divides regions of spectra into many more bands that we can’t see and creates visible images from them. Earth’s surface contains variety of materials like soil, rocks, foliage and water and all are composed of diversifying minerals and chemical compounds. These materials can reflect only a group of the Electromagnetic Spectrum and therefore can be identified by their unique Electromagnetic Signatures, refer fig. 1(b). Hyperspectral sensors scan the sunlight bouncing off the Earth’s surface as shown in fig. 1(c). By analyzing large portion of the Electromagnetic Spectrum contained within that sunlight, the composition of the region can be determined by comparing against known spectral signature of different minerals and compounds. Hyperspectral sensors make use of passive sensors and hence, only scan the available light bouncing off the surface of the surveyed region. The sensors are usually placed on either airplanes or low orbit satellites that scan and record area of the Earth’s surface, refer fig. 1(d). Results from hyperspectral scans are compiled by computer software into data cubes. An example of Hypercube or hyperspectral data(3-D cube) which is further known as hyperspectral image data cube is shown in fig. 1(e) .
Every pixel in the hypercube consists of a contiguous reflectance spectrum, which means that each pixel contains contiguous bands of electromagnetic spectrum from visible to infrared regions that can be used to recognize the objects in the scene since it provides much more complete information about the scene than the normal color camera.
© 2016, IRJET | Impact Factor value: 4.45 | ISO 9001:2008 Certified Journal | Page 581 enhanced ability to classify the objects in the scene based
[image:2.595.32.299.203.727.2]on their spectral properties. However, the classification of hyperspectral image is a very difficult task in recent days due to the huge number of band values for each pixel. Hence, dimensionality reduction becomes an important step for successfully implementing hyperspectral image classification.
Table -1: Showing different modes of image
Definition Of Imaging Modes
Mode Number of
spectral bands
Spectral resolution
Capability Availability
Imaging None None, sensitivity depends on detector spectral response Image brightness Now
Multispectral Few to tens Medium, many tens of nm Detect solids and liquids Now
Hyperspectral Hundreds to thousands Narrow, few nm Detect and identifies solids and liquids
Now
Ultraspectral Thousands Very narrow Detect and identifies solids, liquids and gases Emerging technology but very expensive and processor hungry
Fullspectrum Thousands to continous spectra
Very narrow Detect and identifies solids, liquids and gases Proposed technology and data processing system
Fig -1: a) Electromagnetic spectrum b) reflectance of a chunk of the electromagnetic spectrum from the materials on the Earth’s surface, (c) hyperspectral sensors which
scan the sunlight bouncing off the Earth’s surface, (d) sensors mounted on airplanes or low orbit satellites and (e) hyperspectral image cube.
1.1Curse Of Dimensionality
The high dimensionality of hyperspectral data should increase the abilities and effectiveness in classifying land mapping/cover types. Though, the classification methods that have been successfully applied to multispectral data in the past are not as effective as hyperspectral data. The major reason is that the size of training data set that does not adjust to the rising dimensionality of hyperspectral data. If the training samples are inadequate for the needs, which is frequent for the hyperspectral case, the estimation of statistical parameters becomes inaccurate and unreliable. As the dimensionality increases with the number of bands, the number of training samples needed for training a specific classifier should be increased exponentially as well. The rapid increase in training samples size for density estimation is termed as “curse of dimensionality” by Bellman , which leads to the “peaking phenomenon” or “Hughes phenomenon” in classifier design (Hughes, 1968). The result is that the classification accuracy first grows and then declines as the number of spectral bands increases while training samples are kept the same. For a given classifier, the “curse of dimensionality” can only be avoid by providing a sufficiently large sample size. The more complex the classifier, the larger should the ratio of sample size to dimensionality be to avoid the curse of dimensionality. However, in practice, the number of training samples is limited in most of the hyperspectral applications. Furthermore, the high dimensionality of hyperspectral data makes it necessary to seek new analytic methods to avoid a vast increase in the computational time. A simpler, but sometimes very efficient way of dealing with high dimensional data is to decrease the number of dimensions. This can be done by feature selection or extraction that a small number of salient features are extracted from the hyperspectral data when confronted with a limited set of training samples.
Hyperspectral image has very strong spectral correlation that means there is frequently a significant amount of redundant and misleading information present in the image and such information needs to be removed before any further processing can be carried out .For this reason, it is often useful to reduce the data dimensionality.
2. LITERATURE SURVEY
© 2016, IRJET | Impact Factor value: 4.45 | ISO 9001:2008 Certified Journal | Page 582 [2], Minimum Noise fraction (MNF) [3],Linear
Discriminant Analysis (LDA) [4], Linear Spectral mixture analysis (LSMA) [5] , Wavelet Based methods [6], Independent Component Analysis (ICA) [7], weighted sum based image fusion method, feature extraction [8], feature selection [9] etc.
PCA is performed on subset and also transforms image in to a new coordinate system without considering noise. In case of LDA the maximum number offeatures that can be extracted remains the same which may not be sufficient for achieving better accuracy in practical application. Wavelet based method is lossy compression method.
As far as feature selection is concerned, it selects a better subset from whole of the available subsets and preserves the physical meaning of the data. But the disadvantage is that as the number of features increases, the dimensionality of data also increases and it will be difficult to select a better subset from the available subsets of data. Also, by using an assumption that if a subset is selected as the best subset, in reality it might not be the best.
A recent proposed method is feature extraction with image fusion and recursive filtering [1]. This method is more advantageous while comparing with other methods.
3. PROPOSED METHOD
Main objective is to reduce the computational dimensionality, computational time, and increase the accuracy and efficiency of data. The proposed method consist of following steps:
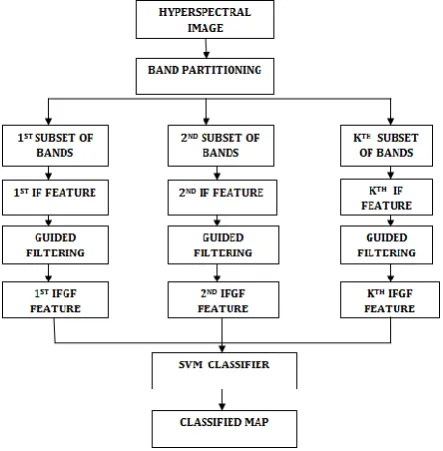
1) Hyperspectral image are partitioned in to multiple adjacent bands.
2) Adjacent bands are fused by simple averaging method.
3) Perform guided filter method. 4) Perform SVM classification.
It can be seen that the feature reduction step IF (Image Fusion) is carried out before guided filtering step otherwise each hyperspectral band should be filtered, which will be much more time-consuming.
3.1Band Partitioning
The hyperspectral images are partitioned in to K subsets of bands depending on the frequencies of electromagnetic spectrum [1]. Every subset consists of a large amount of bands. Based on value of K , subsets or number of features are obtained.
3.2Image Fusion
Image fusion is the process of combining relevant information from two or more images in to a single image.
The resulting image will be more informative than any input images . Simple averaging method is used here which calculates the average image of each and every subsets and aims at the removal of noisy pixels and redundant information from these subsets.
3.3Guided Filtering
In order to obtain Kth feature, guided filtering [10] is performed on each fused bands. Guided Filter (GF) performs edge preserving smoothing on an image, using the content of a second image, called guidance image, to influence the filtering. The guidance image can be the image itself, a different version of the image, or a completely.
Guided image filtering is a general linear translation- variant filtering process, which involves a guidance image I, an input image p, and an output image q. Both I and p are given beforehand according to the application, and they can be identical. The filtering output at a pixel i is expressed as a weighted average:
𝑞𝑖 = 𝑊𝑖𝑗 𝐼 𝑝𝑗
𝑗
Where i and j are pixel indexes. The filter kernel Wij is a function of the guidance image I and independent of p. This filter is linear with respect to p. The filtering output is locally a linear transform of the guidance image. The key assumption of the guided filter is a local linear model between the guidance I and the filter output q. Assume that q is a linear transform of I in a window ⍵k centered at pixel K.
𝑞𝑖 = 𝑎𝑘𝐼𝑖+ 𝑏𝑘
The values of linear coefficients a and b are:
𝑎𝑘 = ( 1 𝑁 {𝐼𝑖𝑃𝑖−𝜇𝑘𝑃′𝐾})÷(𝜎𝑘2+ ∈)
𝑏
𝑘= 𝑃
𝑘,− 𝑎
𝑘𝜇
𝑘Here μk and σ2kare the mean and variance of I in
⍵k, N is the number of pixels in⍵k, and P’k is the mean of p in⍵k. ∊ is the regularization parameter. After performing GF the output is IFGF (Image Fusion Guided Filter) features. Block diagram of proposed work is shown in fig2.
3.4SVM Classifier
M-© 2016, IRJET | Impact Factor value: 4.45 | ISO 9001:2008 Certified Journal | Page 583 class (Multi-class)classifiers, construct set of binary
classifiers f 1, f 2, . . . , f M, each trained to separate one class from rest.
Fig -2: Block diagram of proposed work
4. EXPERIMENTAL RESULT
4.1Experimental Setup
Indian Pines Image is considered as dataset in this experiment. It reveals the agriculture details regarding the Indian Pine test site of North Western Indiana. AVIRIS (AirborneVisible Infrared Imaging Spectrometer) sensor was used to capture it. This image consist of 145x145x220 size were only 200 bands are considered and theremaining 20 water absorption bands are removed. The Indian Pine image consists of 20m per pixel as its spatial resolution and its spectral coverage is from 0.4 to 2.5μm.Indian pines image is shown in fig3. Dataset is
taken from
http://www.ehu.eus/ccwintco/index.php?title=Hyperspe ctral_Remote_Sensing_Scenes.
4.1Evaluation
In order to find out the performance of proposed method, Overall accuracy, Average accuracy are used. Overall accuracy refers to the percentage of correct predictions made by the model with the actual classification in the test data. Average accuracy refers to the percentage of correct predictions made by the model when compared with the actual classification in test data.
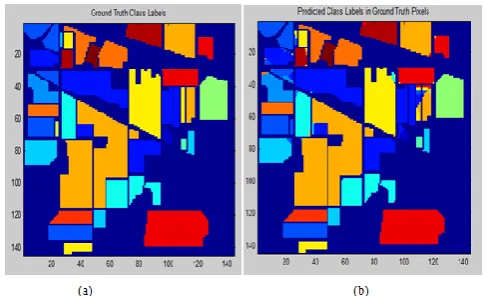
Fig -3: a) Three-band color composite of the
IndianPines image. (b) and (c) Reference data for the Indian Pines image.
5. RESULT ANALYSIS
Indian Pines Image which is considered as input in this paper consists of about 10249 elements in the dataset. The training set which accounts for 10% of the ground truth was chosen randomly are considered as the training set [1]. As the number of features increases, it will affect the accuracy of classification refer chart1. As the feature increases classification accuracy increase but computational time is more. So here number of features equal to 20 is taken to favour the extraction process [1]. While comparing the two smoothing images in fig4(a) and (b) we can easily summarise that guided filter smoothing images in fig4(b) is more clear, when these image is fed in to SVM classifier better classified output image will be produced. The results of this experiment is shown in fig5(b) that the proposed filter is having better performance as compared with other filtering methods . Ground truth image is shown in fig5(a).
While comparing SVM classifier output with ground truth image only minute difference can be detect.
6. CONCLUSION AND FUTURE WORK
[image:4.595.310.559.81.280.2] [image:4.595.54.276.139.365.2]© 2016, IRJET | Impact Factor value: 4.45 | ISO 9001:2008 Certified Journal | Page 584 influenced by parameters like spatial and range
parameter. Guided filter along with SVM classifier yield better result.
There is still scope for further development in classifier. Here 10% of ground truth image is used randomly to train classifier [1]. So it will be better to develop a method in which classifier does not depend on ground truth image.
Chart -1: Graph showing relationship between number of
features and classification accuracy.
Fig -4: (a)Smoothing image of Indian pines using
Recursive filter. (b) Smoothing image of Indian pines using Guided filter.
Fig -5: (a)Ground truth image of Indian pines image. (b) SVM classifier output.
ACKNOWLEDGEMENT
The authors would like to thank all the faculties in CSE department in MEA Engineering College for all their support during the work. Also authors like to thank all unknown referees whose papers helped during this work.
REFERENCES
[1] Xudong Kang, Shutao Li, and Jón Atli Benediktsson,“Feature Extraction of Hyperspectral Images With Image Fusion and Recursive Filtering,” IEEE Trans. Geosci. Remote Sens.,vol. 52, no. 6, 2014, pp. 3742 – 3752.
[2] Craig Rodarmel and Jieshan,"Principal Component Analysis for Hyperspectral Image Classification," Surveying and Land Information Systems, vol. 62, no. 2, 2002.
[3] Rhonda D. Phillips and Layne T. Watson, Christine e. Blinn and Randolph H. Wynne,"An Adaptive Noise Reduction Technique for Improving The Utility of Hyperspectral Data," Pecora17 – The future of land imaging. Going operational November , 2008,pp. 18 – 20.
[4] Tatyana V. Bandos, Lorenzo Bruzzone and Gustavo Camps-Valls,"Classification of Hyperspectral Images With Regularized Linear Discriminant Analysis," IEEE Trans. Geosci. Remote Sens., vol. 47, no. 3 ,March 2009.
[5] Chein-I Chang, Shao-Shan Chiang, James A. Smith and Irving W. Ginsberg,"Linear Spectral Random Mixture Analysis for Hyperspectral Imagery," IEEE Trans. Geosci. Remote sens., vol. 40, no. 2, February2002.
[6] B.Salehia and M.J.Valadanzoej,"Wavele-based Reduction of Hyperspectral Imagery”.
[image:5.595.315.559.111.259.2] [image:5.595.37.291.209.408.2]© 2016, IRJET | Impact Factor value: 4.45 | ISO 9001:2008 Certified Journal | Page 585 Geosci.Remote Sens., vol. 49, no. 12, pp. 4865–4876,
Dec. 2011.
[8] X.Jia, B C Kuo and M. M. Crawford. 2013. “Feature mining for hyperspectral image classification,” Proc. IEEE, Vol.101, No.3,pp.676-697.
[9] M. Pal and G. M. Foody. 2010. “Feature selection for classification of hyperspectral data by SVM,” IEEE Trans. Geosci. Remote Sens., Vol. 48, No. 5, pp. 2297– 2307.