R E S E A R C H
Open Access
Evaluation of a speaker identification
system with and without fusion using three
databases in the presence of noise and
handset effects
Musab T. S. Al-Kaltakchi
1,2*, Wai L. Woo
1, Satnam Dlay
1and Jonathon A. Chambers
1Abstract
In this study, a speaker identification system is considered consisting of a feature extraction stage which utilizes both power normalized cepstral coefficients (PNCCs) and Mel frequency cepstral coefficients (MFCC). Normalization is applied by employing cepstral mean and variance normalization (CMVN) and feature warping (FW), together with acoustic modeling using a Gaussian mixture model-universal background model (GMM-UBM). The main contributions are comprehensive evaluations of the effect of both additive white Gaussian noise (AWGN) and non-stationary noise (NSN) (with and without a G.712 type handset) upon identification performance. In particular, three NSN types with varying signal to noise ratios (SNRs) were tested corresponding to street traffic, a bus interior, and a crowded talking environment. The performance evaluation also considered the effect of late fusion techniques based on score fusion, namely, mean, maximum, and linear weighted sum fusion. The databases employed were TIMIT, SITW, and NIST 2008; and 120 speakers were selected from each database to yield 3600 speech utterances. As recommendations from the study, mean fusion is found to yield overall best performance in terms of speaker identification accuracy (SIA) with noisy speech, whereas linear weighted sum fusion is overall best for original database recordings.
Keywords: Speaker identification system, TIMIT, SITW 2016 and NIST2008 databases, Noise and handset effects
1 Introduction
Speaker identification is one important application of biometrics and forensics to identify speakers based on their unique voice pattern [1–3]. According to [4], fea-ture extraction within speaker identification should be less influenced by noise or the person’s health. How-ever, to improve the speaker identification accuracy (SIA), Mel frequency cepstral coefficients (MFCC) features were fused with inverse MFCC features (IMFCC) in [5], but the approach was limited by the number of GMM com-ponents. An overview of speaker identification was pre-sented in [6] and increasing the number of speakers and using different types of realistic non-stationary noise
*Correspondence: [email protected]
1Communications, Sensors, Signal and Information Processing (ComS2IP) Group, School of Electrical and Electronic Engineering, Newcastle University, NE1 7RU, UK
2Department of Electrical Engineering, College of Engineering, Al-Mustansiriya
University, Baghdad, Iraq
(NSN) in evaluation was suggested to develop the field along with exploiting fusion techniques. Nakagawa et al. [7] proposed combining phase information with MFCC features to improve speaker identification. Despite this research, recognition rate is still a subject of focus. Murty and Yegnanarayana [8] elucidate improvements in a speaker verification system by combining the resid-ual phase derived from linear prediction analysis of the speech signal with the spectral MFCC features. In addi-tion, the National Institute of Standards and Technology (NIST) 2003 database [8] was used; a 14% equal error rate (EER) performance was achieved for MFCC and a 22% rate for the residual phase. Although the combination was better than the individual features alone, the system was not subjected to realistic noise conditions and channel variabilities. Similar to this approach, Wang et al. [9] used a linear weighted sum for the score fusion but the work did not consider noise, and likewise in [10] channel distor-tion seems to have been ignored. In [11], different feature
combinations were presented using MFCC and linear prediction cepstrum coefficients (LPCC) to improve the recognition rate. However, a limited number of speakers was used, only digit speech was employed, and the system was only tested in ideal conditions.
Bhardwaj et al. [12] presented three scenarios for speaker identification, exploiting the generalized fuzzy model (GFM). However, the identification rate using the NIST 2003 database was poor. In [13], approximately 1000 speakers were selected and recordings were made, including in an acoustics room, with noise, and with varying microphone distance. However, the conditions were perhaps unfair and a non-standard database (derived from YouTube) was used. In addition, the tested sys-tem performed best with the Texas Instruments and Massachusetts Institute of Technology (TIMIT) database, with a reduction of 10% for the NIST 2002 database, and approximately 30% with the telephone bandwidth version of TIMIT, or Network TIMIT (NTIMIT). However, the system was not evaluated under different environmental noise conditions. In [14], a mean clustering approach was proposed for GMM speaker models, but the time com-plexity of the log-likelihood calculation was a bottleneck for the testing phase. The system achieved highest perfor-mance with TIMIT, with 10 and 30% reductions for the NIST 2002, and NTIMIT databases, respectively. Again, however, the system was not evaluated under different environmental noise conditions.
In another study, fuzzy clustering was presented in [15], which employed hierarchical tree decisions for speaker identification. The study involved 3805 speakers sub-jected to AWGN, and it was also noted that the system could be improved using fusion; however, no tests for realistic noise were conducted. In [16], both the NIST 2008 and TIMIT databases were employed to achieve robust speaker identification and mitigate room reverber-ation and additive noise, but again handset effects were ignored. Also, to accomplish robust speaker identifica-tion, Li and Huang [17] employed Cochlear filter cepstral coefficients (CFCCs) and used the NTIMIT and Speech Separation Challenge databases, although fusion can also be used to enhance the identification performance. Vari-ous neural network-based approaches were proposed in [18], without considering different noise and handset con-ditions. Furthermore, other researchers have employed deep neural network (DNN) analysis for speaker identification [19]. In [20], the authors selected 100 speakers from the TIMIT and self-collected databases using novel fuzzy vector quantization (NFVQ) tech-niques to enhance the speaker identification system (SIS). However, increasing the number of speak-ers reduced the recognition rate, and there was no testing under realistic noise and channel distor-tion condidistor-tions. Moreover, [21] produced a
multi-modal neural network by exploiting wavelet analysis, without testing for noise and channel effects and only using 34 speakers. Other researchers have focused on speaker identification and verification applications with background noise to improve and create robust speaker recognition [22]. Khanteymoori et al. [23] utilized a dynamic Bayesian network (DBN) to model speakers and improve identification compared with GMMs, but a limited number of speakers was used. Furthermore, a new discriminative likelihood score weighting technique was proposed for speaker identification, and a likelihood score weighting method was presented for the speaker identification task [24]. In [25], a state of the art speech recognition system was exploited for noisy environments and reverberation. In addition, an empirical study was presented by Reynolds [26], which included the handset variability effects for the speaker recognition purpose using the Switchboard corpus. On the other hand, Reynolds et al. [27] focused on two issues in the speaker identification task, the size of the population and the degradation produced from the noisy telephone channel; their study used the TIMIT and the NTIMIT databases. However, only a limited number of studies have involved a handset, AWGN, and NSN types in conjunction with fusion strategies. In this work we extend our previous work in [28, 29] with four combinations of features and their score fusion methods for the original recordings; and with AWGN, and three types of NSN: street traffic, bus interior and crowd talk, with and without the G.712 type handset at 16 kHz, to provide a wide range of envi-ronmental noise conditions. We emphasize that, although the GMM-UBM approach is well established, no previous study has comprehensively considered three databases, one of which only appeared in 2016, nor the effect of such a wide range of NSN and handset effects.
Section 2 contextualises robust biometric speaker iden-tification; Section 3 describes adding the noise and apply-ing the handset; Section 4 explains the databases and simulation setup; Section 5 presents the simulation Results and Discussions; Section 6 includes comparisons with related work; Section 7 presents Conclusions and future work.
2 An overview of a robust biometric speaker identification system
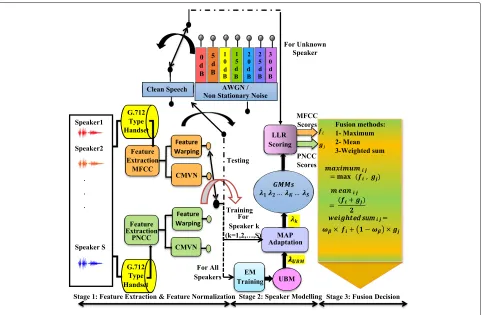
The main system used in this paper is represented in Fig. 1. The figure has three sections: feature extraction and normalization, speaker modeling and matching, and fusion strategies; it also shows test signals.
2.1 Feature extraction and compensation
Fig. 1Robust biometric speaker identification and evaluation framework
presented in speech recognition systems; these provide robustness [31], and are expected to improve SIA in the presence of background noise. A 16-feature dimension was used to mirror our work in [29, 32], which used both MFCC and PNCC. In addition, the MFCC features included the zero orderC0coefficient and the PNCC
fea-tures, including thePc0coefficent. A pre-emphasis finite
impulse response (FIR) filter realizing a first order high-pass filter was employed to filter the speech samples with emphasis coefficient 0.96 [5]. In addition, framing and Hamming windowing were employed with a frame length of 16 ms with an inter-frame overlap of 8 ms [33]. More-over, this work exploits a triangular/Mel filter bank (MFB) and the logarithmic non-linearity used in MFCC [34], as well as the Gammatone filter bank (GFB) and power law non-linearity for PNCC [31, 35, 36]. We focus on using the PNCC by exploiting the GFB to improve SIA in the presence of stationary AWGN and NSN background noise. In addition, temporal masking, asymmetric noise suppression (ANS), and power law non-linearity with a 1/15 exponent and GFB were the main elements in the PNCC construction. Further information about PNCC features is provided in [32, 37, 38]. Feature compensation (normalization) is widely and effectively used for speaker verification and identification tasks. The main aims of
using normalization are to reduce the effects of noise, channel, and handset transducers and to alleviate linear and non-linear channel effects. In this study, feature warp-ing (FW) and cepstral mean and variance normalization (CMVN) over a sliding window are used [39, 40] to reduce the noise and handset effects and mitigate linear chan-nel effects; this gives improvements and robustness to SIA [6]. The features and feature normalization are as employed in [29].
2.2 Speaker modeling and matching
2.2.1 Gaussian mixture model (GMM)
In GMMs, each speaker can be represented by the multi-variate parameters of the Gaussian components, namely, mean, covariance, and a finite weighted mixture. The weighted sum of the M components is called a Gaus-sian mixture density, as represented in Eqs. (1) and (2) in [29]:
p(x|λj)= M
i=1
ωipi(x) (1)
pi(x)=
wherexis a D-dimensional random feature vector, andM
is the number of Gaussian mixture components. A param-eter set for each speaker model is λj = {ωi,μi,i |i =
1,. . .,M},μi and i are, respectively, the mean and covariance parameters of thei-th component density and
(.)Tdenotes the transpose operator. In this paper, we used nodal, diagonal covariance matrices instead of full covari-ance as used in [6, 29]. In speaker modeling, the expecta-tion maximizaexpecta-tion (EM) method estimates parameters for each mixture.
2.2.2 Gaussian mixture model-universal background model (GMM-UBM)
A Gaussian mixture model-universal background model (GMM-UBM) was used as in [29] and was trained offline with a large amount of data through EM. Furthermore, maximum a posteriori (MAP) approach adaptation was employed to train the individual speaker models, and this adaptation was initialized by the UBM and then cou-pled with the training data for each speaker. The coupling between large training data (UBM) and a small amount of class-specific data (individual speaker models) makes the GMM-UBM able to estimate a larger number of parame-ters which increases the mixture size dimension, and thus the SIA. As in our previous work [28], adaptation coef-ficients are used in the learning of the means, weight, and variances of the GMM models which can be rep-resented byαmi ,αiw,αiv, wherei = 1,. . .,S, respectively. The parameters and adaptation coefficients used in the paper can be listed as follows: for the initial UBM train-ing finaliter = 20; whereas for the MAP adaptation, the
relevance factor rρ = 10, ρ ∈ {m,ω,}; and Nmix ∈ TF is the number of feature vectors; where: Nmix is the number of Gaussian components. Thedsfactor is the fea-ture sub-sampling factor everydsfactor frames. finaliteris
the number of expectation maximization (EM) iterations. More details of the parameters and how they are used in the adaptation of speaker models can be found in [28, 41].
2.2.3 Maximum log-likelihood scores
Matching between models built during training and eval-uating datasets was carried out by log-likelihood ratios (LLRs). In our evaluating studies, 120 speakers were selected from each database. Each speaker has 10 speech utterances, 6 were employed for training, while the remaining 4 speech recordings were used for testing. In total, 720 utterances were used for training purpose (6 training files for each of the 120 speakers = 6×120).
In addition, 480 speech utterances were exploited for test-ing (4 tests for each of the 120 speakers = 4×120). The model-test set with a length 57,600 represents the multi-plication between 120 models with 480 tests (120×480). The log-likelihood ratios were calculated as in [29].
LLR(X)=log p(X|λGMM)−log p(X|λUBM) (3)
whereXcontains the corresponding TF feature vectors,
X =[x1,. . .,xTF]. Four sets of LLRs were found based on feature and normalization types as described in the next section. A maximum likelihood approach was used to identify speakers as a final decision, as in [6, 42].
The SIA can be calculated as in Eq. (4) [5, 43]:
SIA= Number of True Speakers Identified
Total Number of Speakers ×100% (4)
2.3 Fusion strategies
Three methods to form a late fusion score were employed as in [29]: weighted sum, maximum, and mean fusion. Combined normalization methods were employed to pro-duce normalized MFCC features (FWMFCC and CMVN-MFCC). Likewise, normalized methods were used to form PNCC features (FWPNCC and CMVNPNCC). Four sets of score vectors could therefore be calculated and are denoted as [28, 29]: f1 = feature warping MFCC scores vector (FWMFCC), f = CMVN MFCC scores vector,
g1= feature warping PNCC scores vector (FWPNCC) and
g2= CMVN PNCC scores vector. The maximum fusion of these score vectors adopted row wise maximum as in Eq. (5).
fmaxij=max(fi, gj) , i,j=1, 2 (5)
wherefmaxij represents the score vectors for the fusion maximum.
Likewise, mean fusion is presented as:
fmeanij=(fi+gj)/2 , i,j=1, 2 (6)
where fmeanij denotes the score vectors for the fusion mean.
In addition, a linear weighted sum score fusion takes the form:
fweightij=ωβ×fi + (1−ωβ)×gj , i,j=1, 2 (7)
where, bothiandjtake values 1 and 2, thereforefweightij takes one of four valuesfweight11,fweight12,fweight13, andfweight22, andfweight11is the linear combination of
f1andg1, likewisefweight12is the linear combination of
coefficients are more important in the speaker identifi-cation task with clean speech. Further details for fusion strategies can be found in [44, 45].
3 Adding noise and applying the G.712 type handset
3.1 Adding stationary AWGN and non-stationary noise
Non-stationary noise (NSN) available online from the websites [46, 47] were used to test the system. Both AWGN and NSN were trimmed to the same fixed length 129,250 speech samples (8 s). Different background noise types as well as AWGN were added only in the testing phase with seven SNR levels based on the corresponding noise power (0 to 30 dB) with step size 5 dB for each level as in [29].
3.2 G.712 type handset
A G.712 type handset at 16 kHz with a fourth order linear IIR filter was derived from the Z transform multiplica-tion of two second order cascaded filters as previously exploited in [6]. We applied the G.712 handset to the normalized speech signal for both training and testing phases as employed in [29]. The main reason for applying and testing this channel distortion was to achieve robust SIA under clean, AWGN noisy speech, and realistic NSN conditions. The transfer function of the IIR filter in the z-domain is given as:
where the numerator parameters are [ 1,−0.0216047,
−1.92904276,−0.0216047, 1] and denominator parameters are [1,−0.2288945,−1.29745904, 0.06100624, 0.57315888].
4 Databases and simulation setups
4.1 Databases
4.1.1 TIMIT acoustic-phonetic continuous speech corpus-1993
The TIMIT database is one of the most familiar and widespread speech corpuses used for speech recognition [6] and is available online at the Linguistic Data Consor-tium website [48]. This corpus has 630 speakers recorded in 8 main dialects of American English. In this work, 120 speakers were selected from dialect regions one and 4 to mirror the work in [5] and our previous study in [29]. Each speaker has 10 speech utterances; 6 were used for training and 4 for testing. A fixed-speech length of 129,250 sam-ples (8 s) was adopted for all 1200 speech utterances of the 120 speakers, concatenation was used when necessary.
4.1.2 The Speakers in the Wild (SITW) speaker recognition challenge 2016
This challenging database was collected to encourage researchers to develop novel algorithms for benchmark-ing speaker recognition technology and is available at [49]. The SITW database was collected under different chal-lenging conditions for open source media: clean interview, outdoor conditions, stadium conditions, and red carpet interviews for single and multi-speakers. In the current study, we selected 120 speakers; most were single speak-ers, but some were unbalanced multi-speakers. In this case, the target speaker was selected so as to obtain a single speaker, using Goldwave and Audacity software. In addition, we divided each speech file into 10 equal lengths, with a fixed length (129,250 samples), to mirror our pre-vious work. However, speech files of less than 8 s were concatenated to achieve the same fixed length. Six files were used for training and four for testing.
4.1.3 2008 NIST speaker recognition evaluation training set part 2-2011
The database is available at [50], and its sources are mul-tilingual telephone and microphone speech of native and bilingual English interview speakers. We converted the sampling frequency from the original 8 to 16 kHz, and 120 English only microphone channel speakers were selected for comparison with the TIMIT and the SITW databases. Again, we selected only single speakers by deleting the interviewers and created six training files and four testing utterances with a fixed length of 8 s.
4.2 Simulation setups
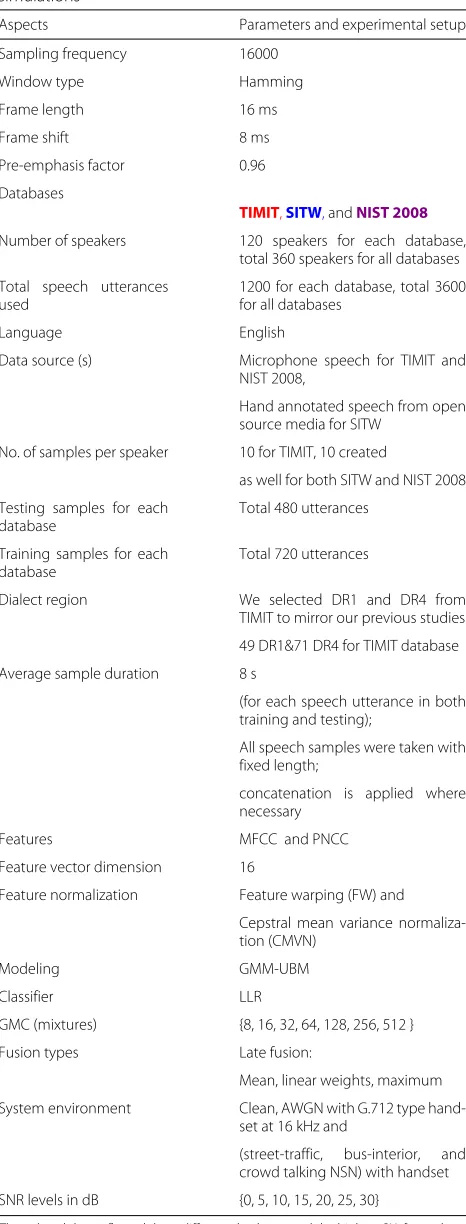
Six main simulations were performed utilizing the TIMIT, SITW, and NIST 2008 databases. Simulation one tested the system without additional noise and handset effects, while simulation two evaluated noisy speech with both AWGN and the G.712 type handset at 16 kHz. Simula-tions 3–5 employed street traffic, a bus interior, and crowd talk NSN, with handset at 16 kHz, respectively. In simula-tion 6, we created PRSIA to measure the reducsimula-tion caused by noise and handset effects. Table 1 explains the param-eters used in the simulations for the three databases, as well as system details, conditions, databases, and methods.
5 Simulation results and discussion
Table 1Parameters and setup used in all experiments and simulations
Aspects Parameters and experimental setup
Sampling frequency 16000
Number of speakers 120 speakers for each database, total 360 speakers for all databases
Total speech utterances used
1200 for each database, total 3600 for all databases
Language English
Data source (s) Microphone speech for TIMIT and NIST 2008,
Hand annotated speech from open source media for SITW
No. of samples per speaker 10 for TIMIT, 10 created
as well for both SITW and NIST 2008
Testing samples for each
Dialect region We selected DR1 and DR4 from TIMIT to mirror our previous studies
49 DR1&71 DR4 for TIMIT database
Average sample duration 8 s
(for each speech utterance in both training and testing);
All speech samples were taken with fixed length;
concatenation is applied where necessary
Features MFCC and PNCC
Feature vector dimension 16
Feature normalization Feature warping (FW) and
Cepstral mean variance
normaliza-System environment Clean, AWGN with G.712 type hand-set at 16 kHz and
(street-traffic, bus-interior, and crowd talking NSN) with handset
SNR levels in dB {0, 5, 10, 15, 20, 25, 30}
The colored data reflected three different databases and the highest SIA for each database: red for TIMIT, blue for SITW and Violet for NIST 2008 database
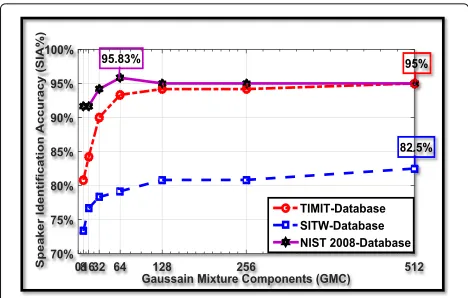
In part A, simulation 1 shows the effect of the num-ber of Gaussian mixture components (GMCs), namely {8, 16, 32, 64, 128, 256, 512}, upon SIA for speech utterances from the three databases, without noise or a handset. All other simulations in part A were on noisy speech, with seven SNR levels between 0 and 30 dB for the same databases at mixture size 256. This noisy speech included the G.712 type handset at 16 kHz under AWGN and three NSN types: street traffic, bus interior, and crowd talking.
In part B, PRSIA is used to give further quantita-tive perspecquantita-tive on each feature type (without fusion) and each fusion technique. In general, all simula-tions for parts A and B present the SIA for the four feature combinations based on MFCC and PNCC, these are FWMFCC, CMVNMFCC, FWPNCC, and CMVNPNCC. The scores for the best SIA between the MFCC features (FWMFCC (f1) and CMVNMFCC (f2) ) were fused to obtain the best SIA with the PNCC features (FWPNCC (g1) and CMVNPNCC (g2).
In Tables 2, 3, 4, 5, and 6, the row corresponding to fusion decision defines which f and g vectors yield the highest SIA and therefore only two score vectors were fused. For example, for fweightij i is equal 1 or 2, that means include either f1 or f2, and j is equal 1 or 2 implying using either g1 or g2, respectively. For exam-ple, when the fusion decision is given asf1−g1andωβ equals to 0.9, then fweight11 = 0.9× f1 + 0.1× g1. Their selection is based upon achieving the highest SIA. Furthermore, in this work, mixture sizes of 1024 and 2048 are not considered, because in this work there are insuf-ficient data size for training; utilizing these mixture sizes causes a decline in the SIA performance.
5.1 Simulations and experiments for part A
In all experiments of parts A and B, the training and the testing of the GMM-UBM are achieved in total by 120 speakers (1200 speech utterances are split into 720 for training and 480 for testing) from the TIMIT database in order to produce the SIA for TIMIT. Likewise, the same partitioning method of training and testing, and number of speakers, was applied to both additional databases SITW and NIST 2008.
5.1.1 Evaluation of speech data from TIMIT, SITW, and NIST 2008 without handset and noise (part A)
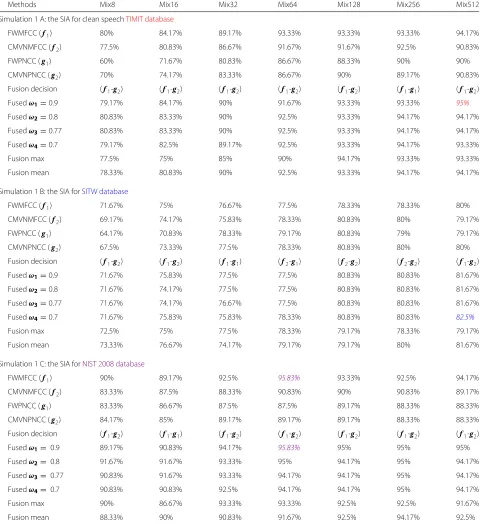
Table 2Simulation 1: 1 A, 1 B, and 1 C are the SIA for different Gaussian mixture components (GMC) for the TIMIT, SITW and NIST 2008, respectively
Methods Mix8 Mix16 Mix32 Mix64 Mix128 Mix256 Mix512
Simulation 1 A: the SIA for clean speechTIMIT database
FWMFCC (f1) 80% 84.17% 89.17% 93.33% 93.33% 93.33% 94.17%
CMVNMFCC (f2) 77.5% 80.83% 86.67% 91.67% 91.67% 92.5% 90.83%
FWPNCC (g1) 60% 71.67% 80.83% 86.67% 88.33% 90% 90%
CMVNPNCC (g2) 70% 74.17% 83.33% 86.67% 90% 89.17% 90.83%
Fusion decision (f1-g2) (f1-g2) (f1-g2) (f1-g2) (f1-g2) (f1-g1) (f1-g2)
Fusedω1=0.9 79.17% 84.17% 90% 91.67% 93.33% 93.33% 95%
Fusedω2=0.8 80.83% 83.33% 90% 92.5% 93.33% 94.17% 94.17%
Fusedω3=0.77 80.83% 83.33% 90% 92.5% 93.33% 94.17% 94.17%
Fusedω4=0.7 79.17% 82.5% 89.17% 92.5% 93.33% 94.17% 93.33%
Fusion max 77.5% 75% 85% 90% 94.17% 93.33% 93.33%
Fusion mean 78.33% 80.83% 90% 92.5% 93.33% 94.17% 94.17%
Simulation 1 B: the SIA forSITW database
FWMFCC (f1) 71.67% 75% 76.67% 77.5% 78.33% 78.33% 80%
CMVNMFCC (f2) 69.17% 74.17% 75.83% 78.33% 80.83% 80% 79.17%
FWPNCC (g1) 64.17% 70.83% 78.33% 79.17% 80.83% 79% 79.17%
CMVNPNCC (g2) 67.5% 73.33% 77.5% 78.33% 80.83% 80% 80%
Fusion decision (f1-g2) (f1-g2) (f1-g1) (f2-g1) (f2-g2) (f2-g2) (f1-g2)
Fusedω1=0.9 71.67% 75.83% 77.5% 77.5% 80.83% 80.83% 81.67%
Fusedω2=0.8 71.67% 74.17% 77.5% 77.5% 80.83% 80.83% 81.67%
Fusedω3=0.77 71.67% 74.17% 76.67% 77.5% 80.83% 80.83% 81.67%
Fusedω4=0.7 71.67% 75.83% 75.83% 78.33% 80.83% 80.83% 82.5%
Fusion max 72.5% 75% 77.5% 78.33% 79.17% 78.33% 79.17%
Fusion mean 73.33% 76.67% 74.17% 79.17% 79.17% 80% 81.67%
Simulation 1 C: the SIA forNIST 2008 database
FWMFCC (f1) 90% 89.17% 92.5% 95.83% 93.33% 92.5% 94.17%
CMVNMFCC (f2) 83.33% 87.5% 88.33% 90.83% 90% 90.83% 89.17%
FWPNCC (g1) 83.33% 86.67% 87.5% 87.5% 89.17% 88.33% 88.33%
CMVNPNCC (g2) 84.17% 85% 89.17% 89.17% 89.17% 88.33% 88.33%
Fusion decision (f1-g2) (f1-g1) (f1-g2) (f1-g2) (f1-g2) (f1-g2) (f1-g2)
Fusedω1= 0.9 89.17% 90.83% 94.17% 95.83% 95% 95% 95%
Fusedω2= 0.8 91.67% 91.67% 93.33% 95% 94.17% 95% 94.17%
Fusedω3= 0.77 90.83% 91.67% 93.33% 94.17% 94.17% 95% 94.17%
Fusedω4= 0.7 90.83% 90.83% 92.5% 94.17% 94.17% 95% 94.17%
Fusion max 90% 86.67% 93.33% 93.33% 92.5% 92.5% 91.67%
Fusion mean 88.33% 90% 90.83% 91.67% 92.5% 94.17% 92.5%
The colored data reflected three different databases and the highest SIA for each database: red for TIMIT, blue for SITW and Violet for NIST 2008 database. The colored italic entries represent the highest SIA
and they are at 95.83% for the mixture size 64, 95% for the mixture size 512, and 82.5% for the mixture size 512 for the NIST 2008, TIMIT, and SITW databases, respectively. These best SIAs for the TIMIT and NIST 2008 databases were obtained with weighted sum fusion and ωβ equal 0.9, while for SITW database,
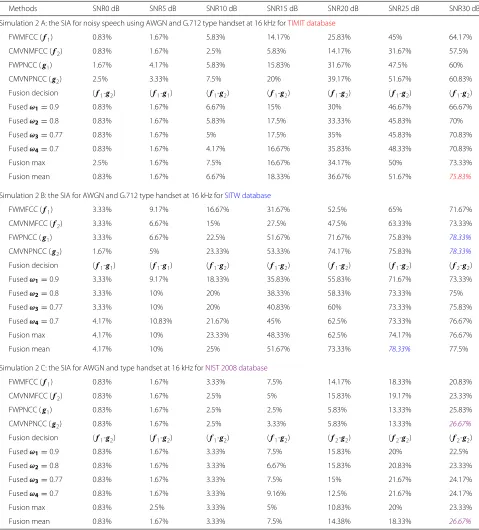
Table 3Simulation 2: 2 A, 2 B, and 2 C are the SIA under AWGN and G.712 type handset at 16 kHz for different signal to noise ratio levels for the TIMIT, SITW, and NIST 2008, respectively, at mixture size 256
Methods SNR0 dB SNR5 dB SNR10 dB SNR15 dB SNR20 dB SNR25 dB SNR30 dB
Simulation 2 A: the SIA for noisy speech using AWGN and G.712 type handset at 16 kHz forTIMIT database
FWMFCC (f1) 0.83% 1.67% 5.83% 14.17% 25.83% 45% 64.17%
CMVNMFCC (f2) 0.83% 1.67% 2.5% 5.83% 14.17% 31.67% 57.5%
FWPNCC (g1) 1.67% 4.17% 5.83% 15.83% 31.67% 47.5% 60%
CMVNPNCC (g2) 2.5% 3.33% 7.5% 20% 39.17% 51.67% 60.83%
Fusion decision (f1-g2) (f1-g1) (f1-g2) (f1-g2) (f1-g2) (f1-g2) (f1-g2)
Fusedω1=0.9 0.83% 1.67% 6.67% 15% 30% 46.67% 66.67%
Fusedω2=0.8 0.83% 1.67% 5.83% 17.5% 33.33% 45.83% 70%
Fusedω3=0.77 0.83% 1.67% 5% 17.5% 35% 45.83% 70.83%
Fusedω4=0.7 0.83% 1.67% 4.17% 16.67% 35.83% 48.33% 70.83%
Fusion max 2.5% 1.67% 7.5% 16.67% 34.17% 50% 73.33%
Fusion mean 0.83% 1.67% 6.67% 18.33% 36.67% 51.67% 75.83%
Simulation 2 B: the SIA for AWGN and G.712 type handset at 16 kHz forSITW database
FWMFCC (f1) 3.33% 9.17% 16.67% 31.67% 52.5% 65% 71.67%
CMVNMFCC (f2) 3.33% 6.67% 15% 27.5% 47.5% 63.33% 73.33%
FWPNCC (g1) 3.33% 6.67% 22.5% 51.67% 71.67% 75.83% 78.33%
CMVNPNCC (g2) 1.67% 5% 23.33% 53.33% 74.17% 75.83% 78.33%
Fusion decision (f1-g1) (f1-g1) (f1-g2) (f1-g2) (f1-g2) (f1-g2) (f2-g2)
Fusedω1=0.9 3.33% 9.17% 18.33% 35.83% 55.83% 71.67% 73.33%
Fusedω2=0.8 3.33% 10% 20% 38.33% 58.33% 73.33% 75%
Fusedω3=0.77 3.33% 10% 20% 40.83% 60% 73.33% 75.83%
Fusedω4=0.7 4.17% 10.83% 21.67% 45% 62.5% 73.33% 76.67%
Fusion max 4.17% 10% 23.33% 48.33% 62.5% 74.17% 76.67%
Fusion mean 4.17% 10% 25% 51.67% 73.33% 78.33% 77.5%
Simulation 2 C: the SIA for AWGN and type handset at 16 kHz forNIST 2008 database
FWMFCC (f1) 0.83% 1.67% 3.33% 7.5% 14.17% 18.33% 20.83%
CMVNMFCC (f2) 0.83% 1.67% 2.5% 5% 15.83% 19.17% 23.33%
FWPNCC (g1) 0.83% 1.67% 2.5% 2.5% 5.83% 13.33% 25.83%
CMVNPNCC (g2) 0.83% 1.67% 2.5% 3.33% 5.83% 13.33% 26.67%
Fusion decision (f1-g2) (f1-g2) (f1-g2) (f1-g2) (f2-g2) (f2-g2) (f2-g2)
Fusedω1=0.9 0.83% 1.67% 3.33% 7.5% 15.83% 20% 22.5%
Fusedω2=0.8 0.83% 1.67% 3.33% 6.67% 15.83% 20.83% 23.33%
Fusedω3=0.77 0.83% 1.67% 3.33% 7.5% 15% 21.67% 24.17%
Fusedω4=0.7 0.83% 1.67% 3.33% 9.16% 12.5% 21.67% 24.17%
Fusion max 0.83% 2.5% 3.33% 5% 10.83% 20% 23.33%
Fusion mean 0.83% 1.67% 3.33% 7.5% 14.38% 18.33% 26.67%
The colored data reflected three different databases and the highest SIA for each database: red for TIMIT, blue for SITW and Violet for NIST 2008 database. The colored italic entries represent the highest SIA
for each mixture size for TIMIT, SITW, and NIST 2008 databases. On this basis, we made the following observations.
Firstly, increasing the GMCs always increases the SIA for all databases as in the simulations (1 A, 1 B, 1 C), except in mixture size 64 for the NIST 2008 database which
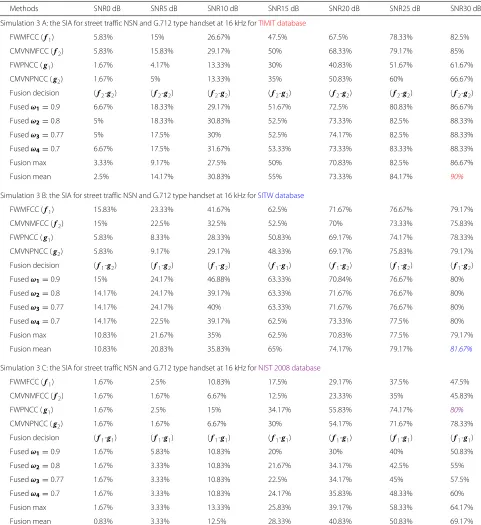
Table 4Simulation 3: 3 A, 3 B, and 3 C are the SIA for street traffic NSN and G.712 type handset at 16 kHz for different signal to noise ratio levels for TIMIT, SITW, and NIST 2008, respectively, at mixture size 256
Methods SNR0 dB SNR5 dB SNR10 dB SNR15 dB SNR20 dB SNR25 dB SNR30 dB
Simulation 3 A: the SIA for street traffic NSN and G.712 type handset at 16 kHz forTIMIT database
FWMFCC (f1) 5.83% 15% 26.67% 47.5% 67.5% 78.33% 82.5%
CMVNMFCC (f2) 5.83% 15.83% 29.17% 50% 68.33% 79.17% 85%
FWPNCC (g1) 1.67% 4.17% 13.33% 30% 40.83% 51.67% 61.67%
CMVNPNCC (g2) 1.67% 5% 13.33% 35% 50.83% 60% 66.67%
Fusion decision (f2-g2) (f2-g2) (f2-g2) (f2-g2) (f2-g2) (f2-g2) (f2-g2)
Fusedω1=0.9 6.67% 18.33% 29.17% 51.67% 72.5% 80.83% 86.67%
Fusedω2=0.8 5% 18.33% 30.83% 52.5% 73.33% 82.5% 88.33%
Fusedω3=0.77 5% 17.5% 30% 52.5% 74.17% 82.5% 88.33%
Fusedω4=0.7 6.67% 17.5% 31.67% 53.33% 73.33% 83.33% 88.33%
Fusion max 3.33% 9.17% 27.5% 50% 70.83% 82.5% 86.67%
Fusion mean 2.5% 14.17% 30.83% 55% 73.33% 84.17% 90%
Simulation 3 B: the SIA for street traffic NSN and G.712 type handset at 16 kHz forSITW database
FWMFCC (f1) 15.83% 23.33% 41.67% 62.5% 71.67% 76.67% 79.17%
CMVNMFCC (f2) 15% 22.5% 32.5% 52.5% 70% 73.33% 75.83%
FWPNCC (g1) 5.83% 8.33% 28.33% 50.83% 69.17% 74.17% 78.33%
CMVNPNCC (g2) 5.83% 9.17% 29.17% 48.33% 69.17% 75.83% 79.17%
Fusion decision (f1-g2) (f1-g2) (f1-g2) (f1-g1) (f1-g2) (f1-g2) (f1-g2)
Fusedω1=0.9 15% 24.17% 46.88% 63.33% 70.84% 76.67% 80%
Fusedω2=0.8 14.17% 24.17% 39.17% 63.33% 71.67% 76.67% 80%
Fusedω3=0.77 14.17% 24.17% 40% 63.33% 71.67% 76.67% 80%
Fusedω4=0.7 14.17% 22.5% 39.17% 62.5% 73.33% 77.5% 80%
Fusion max 10.83% 21.67% 35% 62.5% 70.83% 77.5% 79.17%
Fusion mean 10.83% 20.83% 35.83% 65% 74.17% 79.17% 81.67%
Simulation 3 C: the SIA for street traffic NSN and G.712 type handset at 16 kHz forNIST 2008 database
FWMFCC (f1) 1.67% 2.5% 10.83% 17.5% 29.17% 37.5% 47.5%
CMVNMFCC (f2) 1.67% 1.67% 6.67% 12.5% 23.33% 35% 45.83%
FWPNCC (g1) 1.67% 2.5% 15% 34.17% 55.83% 74.17% 80%
CMVNPNCC (g2) 1.67% 1.67% 6.67% 30% 54.17% 71.67% 78.33%
Fusion decision (f1-g1) (f1-g1) (f1-g1) (f1-g1) (f1-g1) (f1-g1) (f1-g1)
Fusedω1=0.9 1.67% 5.83% 10.83% 20% 30% 40% 50.83%
Fusedω2=0.8 1.67% 3.33% 10.83% 21.67% 34.17% 42.5% 55%
Fusedω3=0.77 1.67% 3.33% 10.83% 22.5% 34.17% 45% 57.5%
Fusedω4=0.7 1.67% 3.33% 10.83% 24.17% 35.83% 48.33% 60%
Fusion max 1.67% 3.33% 13.33% 25.83% 39.17% 58.33% 64.17%
Fusion mean 0.83% 3.33% 12.5% 28.33% 40.83% 50.83% 69.17%
The colored data reflected three different databases and the highest SIA for each database: red for TIMIT, blue for SITW and Violet for NIST 2008 database. The colored italic entries represent the highest SIA
Secondly, the NIST 2008 evaluation, which is rep-resented by the violet curve in Fig. 2 attained the best SIA performance followed by the red curve for the TIMIT database. In contrast, the evaluation of the SITW database (blue curve) has the lowest SIA per-formance, as expected, most probably due to the wild
and challenging environments compared to the semi-ideal TIMIT database and the less challenging conditions of NIST 2008.
Table 5Simulation 4: 4 A, 4 B, and 4 C are the SIA for bus interior NSN and G.712 type handset at 16 kHz for different signal to noise ratio levels for the TIMIT, SITW, and NIST 2008, respectively, at mixture size 256
Methods SNR0 dB SNR5 dB SNR10 dB SNR15 dB SNR20 dB SNR25 dB SNR30 dB
Simulation 4 A: the SIA for bus interior NSN and G.712 type handset at 16 kHz forTIMIT database
FWMFCC (f1) 50.83% 65% 75.83% 79.17% 85% 87.5% 89.17%
CMVNMFCC (f2) 53.33% 68.33% 77.5% 82.5% 87.5% 90.83% 91.67%
FWPNCC (g1) 10% 23.33% 35.83% 50.83% 65% 70% 72.5%
CMVNPNCC (g2) 13.33% 27.5% 45% 55.83% 63.33% 69.17% 73.33%
Fusion decision (f2-g2) (f2-g2) (f2-g2) (f2-g2) (f2-g1) (f2-g1) (f2-g2)
Fusedω1=0.9 55% 69.17% 80.83% 84.17% 88.33% 91.67% 91.67%
Fusedω2=0.8 56.67% 71.67% 83.33% 85.83% 89.17% 91.67% 90%
Fusedω3=0.77 56.67% 72.5% 82.5% 85.83% 90% 91.67% 90%
Fusedω4=0.7 56.67% 70% 83.33% 85.83% 90.83% 90% 89.17%
Fusion max 40.83% 65% 76.67% 83.33% 84.17% 87.5% 89.17%
Fusion mean 51.67% 68.33% 78.33% 84.17% 86.67% 88.33% 90.83%
Simulation 4 B: the SIA for bus interior NSN and G.712 type handset at 16 kHz forSITW database
FWMFCC (f1) 65.83% 70.83% 73.33% 75.83% 77.5% 79.17% 79.17%
CMVNMFCC (f2) 66.67% 70.83% 72.5% 73.33% 76.67% 77.5% 79.17%
FWPNCC (g1) 27.5% 49.17% 64.17% 71.67% 75.83% 77.5% 79.17%
CMVNPNCC (g2) 28.33% 48.33% 65% 72.5% 75% 79.17% 80%
Fusion decision (f2-g2) (f2-g1) (f1-g2) (f1-g2) (f1-g1) (f1-g2) (f1-g2)
Fusedω1=0.9 66.67% 71.67% 73.33% 75.83% 77.5% 80% 80%
Fusedω2=0.8 65% 72.5% 74.17% 75.83% 77.5% 80.83% 80%
Fusedω3=0.77 66.67% 72.5% 75% 76.67% 77.5% 81.67% 80%
Fusedω4=0.7 65.83% 72.5% 75% 76.67% 78.33% 80.83% 80.83%
Fusion max 63.33% 72.5% 73.33% 79.17% 80% 80.83% 80.83%
Fusion mean 59.17% 70.83% 73.33% 76.67% 79.17% 81.67% 80.83%
Simulation 4 C: the SIA for bus interior NSN and G.712 type handset at 16 kHz for theNIST 2008 database
FWMFCC (f1) 22.5% 32.5% 36.67% 42.5% 59.17% 72.5% 85.83%
CMVNMFCC (f2) 19.17% 28.33% 36.67% 45% 60% 74.17% 85.83%
FWPNCC (g1) 7.5% 15% 37.5% 57.5% 71.67% 80% 80%
CMVNPNCC (g2) 6.67% 14.17% 35.83% 57.5% 73.33% 82.5% 84.17%
Fusion decision (f1-g1) (f1-g1) (f2-g1) (f2-g2) (f2-g2) (f2-g2) (f2-g2)
Fusedω1=0.9 20.83% 32.5% 39.17% 49.17% 60.83% 78.33% 88.33%
Fusedω2=0.8 17.5% 30% 40.83% 53.33% 63.33% 84.17% 90%
Fusedω3=0.77 17.5% 27.5% 40.83% 53.33% 64.17% 84.17% 90.83%
Fusedω4=0.7 17.5% 26.67% 42.5% 54.17% 68.33% 83.33% 90.83%
Fusion max 15% 28.33% 41.67% 53.33% 69.17% 85% 89.17%
Fusion mean 15.83% 25.83% 45.83% 58.33% 75% 86.67% 92.5%
The colored data reflected three different databases and the highest SIA for each database: red for TIMIT, blue for SITW and Violet for NIST 2008 database. The colored italic entries represent the highest SIA
size 8. The second smallest variation is for the SITW database. However, the largest variation was attained with the TIMIT database. The main reason for this is that TIMIT is pure clean speech (ideal database as described by [6]), so the highest SIA was achieved with the highest mixture component size (512) which gives very accurate
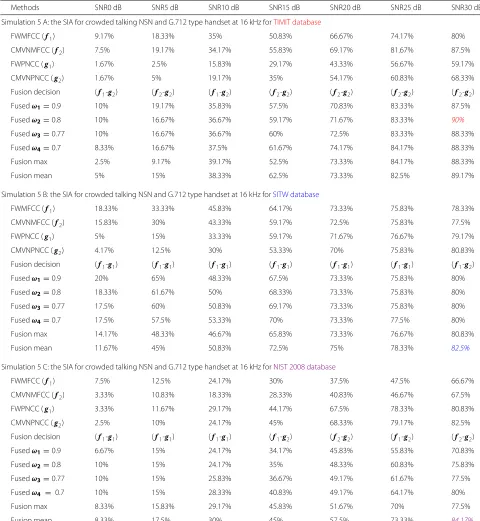
Table 6Simulation 5: 5 A, 5 B, and 5 C are the SIA for crowded talking NSN and G.712 type handset at 16 kHz for different signal to noise ratio levels for the TIMIT, SITW, and NIST 2008, respectively, at mixture size 256
Methods SNR0 dB SNR5 dB SNR10 dB SNR15 dB SNR20 dB SNR25 dB SNR30 dB
Simulation 5 A: the SIA for crowded talking NSN and G.712 type handset at 16 kHz forTIMIT database
FWMFCC (f1) 9.17% 18.33% 35% 50.83% 66.67% 74.17% 80%
CMVNMFCC (f2) 7.5% 19.17% 34.17% 55.83% 69.17% 81.67% 87.5%
FWPNCC (g1) 1.67% 2.5% 15.83% 29.17% 43.33% 56.67% 59.17%
CMVNPNCC (g2) 1.67% 5% 19.17% 35% 54.17% 60.83% 68.33%
Fusion decision (f1-g2) (f2-g2) (f1-g2) (f2-g2) (f2-g2) (f2-g2) (f2-g2)
Fusedω1=0.9 10% 19.17% 35.83% 57.5% 70.83% 83.33% 87.5%
Fusedω2=0.8 10% 16.67% 36.67% 59.17% 71.67% 83.33% 90%
Fusedω3=0.77 10% 16.67% 36.67% 60% 72.5% 83.33% 88.33%
Fusedω4=0.7 8.33% 16.67% 37.5% 61.67% 74.17% 84.17% 88.33%
Fusion max 2.5% 9.17% 39.17% 52.5% 73.33% 84.17% 88.33%
Fusion mean 5% 15% 38.33% 62.5% 73.33% 82.5% 89.17%
Simulation 5 B: the SIA for crowded talking NSN and G.712 type handset at 16 kHz forSITW database
FWMFCC (f1) 18.33% 33.33% 45.83% 64.17% 73.33% 75.83% 78.33%
CMVNMFCC (f2) 15.83% 30% 43.33% 59.17% 72.5% 75.83% 77.5%
FWPNCC (g1) 5% 15% 33.33% 59.17% 71.67% 76.67% 79.17%
CMVNPNCC (g2) 4.17% 12.5% 30% 53.33% 70% 75.83% 80.83%
Fusion decision (f1-g1) (f1-g1) (f1-g1) (f1-g1) (f1-g1) (f1-g1) (f1-g2)
Fusedω1=0.9 20% 65% 48.33% 67.5% 73.33% 75.83% 80%
Fusedω2=0.8 18.33% 61.67% 50% 68.33% 73.33% 75.83% 80%
Fusedω3=0.77 17.5% 60% 50.83% 69.17% 73.33% 75.83% 80%
Fusedω4=0.7 17.5% 57.5% 53.33% 70% 73.33% 77.5% 80%
Fusion max 14.17% 48.33% 46.67% 65.83% 73.33% 76.67% 80.83%
Fusion mean 11.67% 45% 50.83% 72.5% 75% 78.33% 82.5%
Simulation 5 C: the SIA for crowded talking NSN and G.712 type handset at 16 kHz forNIST 2008 database
FWMFCC (f1) 7.5% 12.5% 24.17% 30% 37.5% 47.5% 66.67%
CMVNMFCC (f2) 3.33% 10.83% 18.33% 28.33% 40.83% 46.67% 67.5%
FWPNCC (g1) 3.33% 11.67% 29.17% 44.17% 67.5% 78.33% 80.83%
CMVNPNCC (g2) 2.5% 10% 24.17% 45% 68.33% 79.17% 82.5%
Fusion decision (f1-g1) (f1-g1) (f1-g1) (f1-g2) (f2-g2) (f1-g2) (f2-g2)
Fusedω1=0.9 6.67% 15% 24.17% 34.17% 45.83% 55.83% 70.83%
Fusedω2=0.8 10% 15% 24.17% 35% 48.33% 60.83% 75.83%
Fusedω3=0.77 10% 15% 25.83% 36.67% 49.17% 61.67% 77.5%
Fusedω4 = 0.7 10% 15% 28.33% 40.83% 49.17% 64.17% 80%
Fusion max 8.33% 15.83% 29.17% 45.83% 51.67% 70% 77.5%
Fusion mean 8.33% 17.5% 30% 45% 57.5% 73.33% 84.17%
The colored data reflected three different databases and the highest SIA for each database: red for TIMIT, blue for SITW and Violet for NIST 2008 database. The colored italic entries represent the highest SIA
5.1.2 Evaluation of noisy speech data from TIMIT, SITW, and NIST 2008 with handset and noise (part A)
This subsection is represented by Tables 3, 4, 5, and 6, which show the evaluation of TIMIT, SITW, and NIST 2008 for noisy speech with handset using different
background noises: AWGN, street traffic NSN, bus interior NSN, and crowd talking NSN, respectively.
Fig. 2Evaluations in terms of SIA for the TIMIT, SITW, and NIST 2008 databases for widespread Gaussian mixture components {8, 16, 32, 64, 128, 256, 512} without handset and noise using the GMM-UBM algorithm
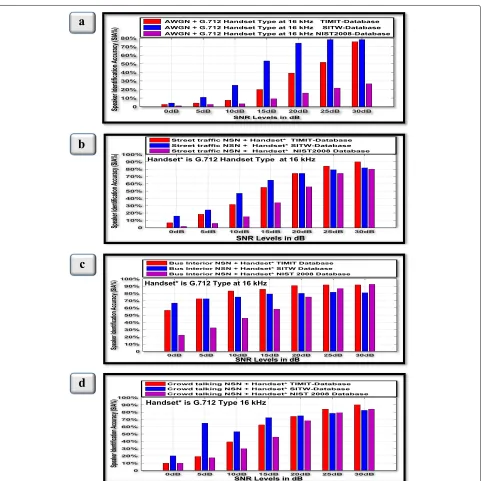
observed the street traffic and crowd talking have broad spectra and therefore have similar effect as AWGN. On the other hand, the dominant energy of the bus-interior noise is low frequency and therefore has least effect on the speech when it is added. Therefore, for the AWGN, street and crowd talking, we only consider reduction in SIA performance between 30 and 10 dB; whereas, for bus-interior, we consider between 30 and 0 dB. According to the tables from Tables 3, 4, 5, and 6, the highest SIA results are selected regardless of feature type (without fusion) or fusion method for each SNR level. Then, these results are shown in Fig. 3.
Firstly, for AWGN and G.712 type handset, represented in Table 3, the bar charts in Fig. 3a can be used to ana-lyze and discuss the results given in Table 3. The figure shows the reduction in SIA was 75.83% at 30 dB to 7.5% at 10 dB for the TIMIT database, while in SITW the reduc-tion in the SIA was 78.33% at 30 dB to 25% at 10 dB . In contrast, the NIST 2008 had the lowest SIA among all other databases at 30 dB with 26.67% then this was reduced to the 3.33% at 10 dB, as such all databases were affected by stationary noise, with a constant spec-trum profile. The particular sensitivity to such noise when applied to the NIST 2008 database may be due to the natural characteristics of the interview speech.
Secondly, for street traffic NSN with handset, seen in Table 4, Fig. 3b shows that the reduction in SIA was from 90% at 30 dB to 31.67% at 10 dB for the TIMIT database. similarly, the reduction in SIA obtained by the NIST 2008 database was from 80 to 15%. In contrast, the lowest reduction in the performance accuracy was attained using the SITW database with SIA 81.67% at 30 dB dropping down to 46.88% at 10 dB. As a consequence, the SITW database has the lowest reduction in SIA compared with the other three databases used for the evaluation.
Thirdly, for the bus interior NSN, seen in Table 5, Fig. 3c illustrates that the reduction in SIA was from 91.67% at 30 dB to 56.67% at 0 dB for the TIMIT database. Likewise, for the SITW database the SIA reduc-tion was from 80.83 to 66.67% for 30and 0 dB, respec-tively. However, the highest reduction in SIA was for the NIST 2008 database with SIA 92.5% at 30 dB to 22.5% at 0 dB.
Finally, the results in Table 6, Fig. 3d show that the evaluation of the crowd talking NSN with the handset evaluation was similar to the street NSN. For the TIMIT database, the reduction in SIA was from 90% at 30 dB to 39.17% at 10 dB. Similar to this reduction, the figure for the NIST 2008 database were 84.17% at 30 dB to 30% at 10 dB. In contrast, for the SITW database, the reduction in SIA was from 82.5 to 53.33%. Considering the reduc-tion in SIA for all simulareduc-tions as a result of noise and handset effects, the most important issue is the relative sensitivities of the various methods to the environments. To address this point, we consider further comparative analysis.
5.2 Simulations and experiments for part B
In this study, based on the feature types (using four feature combinations without fusion) and fusion methods, the quantitative perspectives were measured by calculating the PRSIA.
5.2.1 Quantitative perspective for noise and handset effects in part B
The PRSIA was calculated for different conditions as in Eq. (9):
PRSIAcond=
SIAclean−SIAcond
SIAclean
(9)
where cond ∈ {1, 2, 3, 4 }, 1 refers to the AWGN and handset, 2 to street traffic NSN and handset, 3 to the bus interior NSN and handset, and 4 to the crowded talk-ing NSN and handset. The handset used was G.712 type at 16 kHz. This equation measured the SIAclean at
mix-ture size 256 for the original recordings in TIMIT, SITW, and NIST 2008, without noise and handset conditions. Then, we measured the SIAcond under the four
Fig. 3Performance measurement for noisy speech for the TIMIT, SITW, and NIST 2008 database at mixture size 256 under G.712 type handset at 16 kHz with background noiseaAWGN ,bstreet traffic NSN,cbus-interior, anddcrowd talking NSN for wide range of SNR levels 0–30 dB and using GMM-UBM algorithm
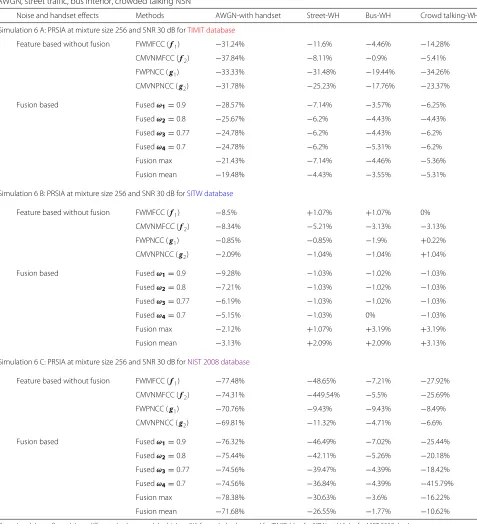
identification system. Moreover, all positive sign values in Table 7 are for the challenging new database (SITW). Generally, however, we can notice from Table 7 that all the results for TIMIT and NIST 2008 at SNR 30 dB have negative sign values, meaning a reduction in the SIA as a result of the noise and handset effects. Secondly, most of the fusion methods reduced the PRSIA for all databases used.
Table 7Percentage reduction in SIA (PRSIA) for the TIMIT, SITW, and NIST 2008, respectively, under G.712 type handset at 16 kHz, AWGN, street traffic, bus interior, crowded talking NSN
Noise and handset effects Methods AWGN-with handset Street-WH Bus-WH Crowd talking-WH
Simulation 6 A: PRSIA at mixture size 256 and SNR 30 dB forTIMIT database
Feature based without fusion FWMFCC (f1) −31.24% −11.6% −4.46% −14.28%
CMVNMFCC (f2) −37.84% −8.11% −0.9% −5.41%
FWPNCC (g1) −33.33% −31.48% −19.44% −34.26%
CMVNPNCC (g2) −31.78% −25.23% −17.76% −23.37%
Fusion based Fusedω1=0.9 −28.57% −7.14% −3.57% −6.25%
Fusedω2=0.8 −25.67% −6.2% −4.43% −4.43%
Fusedω3=0.77 −24.78% −6.2% −4.43% −6.2%
Fusedω4=0.7 −24.78% −6.2% −5.31% −6.2%
Fusion max −21.43% −7.14% −4.46% −5.36%
Fusion mean −19.48% −4.43% −3.55% −5.31%
Simulation 6 B: PRSIA at mixture size 256 and SNR 30 dB forSITW database
Feature based without fusion FWMFCC (f1) −8.5% +1.07% +1.07% 0%
CMVNMFCC (f2) −8.34% −5.21% −3.13% −3.13%
FWPNCC (g1) −0.85% −0.85% −1.9% +0.22%
CMVNPNCC (g2) −2.09% −1.04% −1.04% +1.04%
Fusion based Fusedω1=0.9 −9.28% −1.03% −1.02% −1.03%
Fusedω2=0.8 −7.21% −1.03% −1.02% −1.03%
Fusedω3=0.77 −6.19% −1.03% −1.02% −1.03%
Fusedω4=0.7 −5.15% −1.03% 0% −1.03%
Fusion max −2.12% +1.07% +3.19% +3.19%
Fusion mean −3.13% +2.09% +2.09% +3.13%
Simulation 6 C: PRSIA at mixture size 256 and SNR 30 dB forNIST 2008 database
Feature based without fusion FWMFCC (f1) −77.48% −48.65% −7.21% −27.92%
CMVNMFCC (f2) −74.31% −449.54% −5.5% −25.69%
FWPNCC (g1) −70.76% −9.43% −9.43% −8.49%
CMVNPNCC (g2) −69.81% −11.32% −4.71% −6.6%
Fusion based Fusedω1=0.9 −76.32% −46.49% −7.02% −25.44%
Fusedω2=0.8 −75.44% −42.11% −5.26% −20.18%
Fusedω3=0.77 −74.56% −39.47% −4.39% −18.42%
Fusedω4=0.7 −74.56% −36.84% −4.39% −415.79%
Fusion max −78.38% −30.63% −3.6% −16.22%
Fusion mean −71.68% −26.55% −1.77% −10.62%
The colored data reflected three different databases and the highest SIA for each database: red for TIMIT, blue for SITW and Violet for NIST 2008 database
NIST 2008. For PNCC, the features have less reduction than MFCC in terms of the SIA. Finally, the highest reduc-tion in all databases occurred under the AWGN with handset condition, which is due to the uniformity of the spectrum effect of the noise. The bus interior NSN and handset has the lowest reduction which as stated earlier is due to its low frequency nature. The results for other
noise conditions (street and crowded talking) are between the AWGN and bus NSN effects.
6 Related works based on the proposed speaker
identification system
2008 without handset and noise, termed clean speech; cond.2 is noisy speech by AWGN and handset; cond.3 is street NSN and handset; cond.4 is bus NSN and hand-set; cond.5 is crowded talking NSN and handset. The handset used in all noise conditions is G.712 type at 16 kHz. Comparisons show improvement in SIA with the TIMIT database in cond.1 over the state of the art methods due to Kumar et al. [5] and Togneri and Pul-lella [6]. However, Ming et al. in their earlier work in [29] attain higher SIA in cond.1 with TIMIT but only with a GMM model and 630 speakers, but they do not consider a handset in cond. 3. New benchmark figures contributed from this study for a range of environmental noise condi-tions with the three databases are provided by cond.2 – cond.5.
7 Conclusions
In this study, we provided a comprehensive evaluation of text independent closed set speaker identification in the presence of AWGN and NSN types with a G.712 type handset at 16 kHz to provide benchmark evaluations of three different databases. We presented different feature combinations based on MFCC and PNCC, modeled by the GMM-UBM approach with and without fusion tech-niques (maximum, mean and weighted sum fusion). The evaluations were conducted under challenging environ-ments including in the presence of the G.712 handset,
AWGN, and various NSN types. Three databases (TIMIT, NIST 2008, and SITW) with a wide range of seven SNR levels (0–30) dB with step size 5 dB were employed. In addition, a wide range of Gaussian mixture components {8, 16, 32, 64, 128, 256, 512 } for clean speech was also con-sidered. Thorough evaluation and results were provided by this research in order to give benchmark evaluations and results for the three databases for other researchers working in the speaker identification area. The major findings from this study are
• On the basis of the evaluations of three databases without the noise and handset conditions, the best speaker identification method for all three databases used was weighted sum fusion. • Based on the three databases without the noise
and handset conditions, the order for best SIA was NIST2008, TIMIT, SITW with 95.83, 95, and 82.5%, respectively, at mixture sizes 64, 512, and also 512, respectively. These SIAs were achieved by using weighted sum fusion with 90% from FWMFCC features and 10% from the
corresponding CMVNPNCC features for both the TIMIT and NIST 2008 database. On the other hand, in the SITW database, 70% from FWMFCC features was fused with 30% from the
corresponding CMVNPNCC features. The
Table 8Comparisons with the state of the art in terms of SIA
Authors Database System approach Cond.1 Cond.2 Cond.3 Cond.4 Cond.5
Proposed work by TIMIT Fusion based 95% 75.83% 90% 91.67% 90%
Al-Kaltakchi et al. 120 speakers GMM-UBM SNR 30 dB SNR 30 dB SNR 30 dB SNR 30 dB
Microphone channel
Proposed work by SITW Fusion based 82.5% 78.33% 81.67% 81.67% 82.5%
Al-Kaltakchi et al. 120 speakers GMM-UBM SNR 30 dB SNR 30 dB SNR 30 dB SNR 30 dB
Proposed work by NIST 2008 Fusion based 95.83% 26.67% 80% 92.5% 84.17%
Al-Kaltakchi et al. 120 speakers GMM-UBM SNR 30 dB SNR 30 dB SNR 30 dB SNR 30 dB
Microphone channel
Kumar et al. TIMIT GMM 93.88%
[5] [2012] 120 speakers
Togneri and Pullella TIMIT GMM-UBM 94.5% 74.2%
[6] [2011] 64 speakers at SNR 30 dB
Ming et al. TIMIT GMM 96.51% 92.86%
[51] [2007] 630 speakers Mix 128 at 20 dB
without handset
weighting should therefore be chosen as a function of the fidelity of the speech recordings.
• On the basis of the results in this paper, the evaluations in noisy conditions suggest that mean fusion of four combinations of two types of features from (FWMFCC, CMVNMFCC, FWPNCC, and CMVNPNCC) is the most robust method for a practical speaker identification system, but there is not a consistent best pairing.
Future work will consider a similar extensive evaluation for a speaker identification system built from an I-vector approach [4].
Acknowledgements
The first author Musab Tahseen Salahaldeen Al-Kaltakchi would like to thank the Ministry of Higher Education and Scientific Research (MoHESR) in Iraq for funding his PhD scholarship.
Authors’ contributions
The main author is MTSA-K and the other authors are his supervisors. JAC, WLW, SD are the first, second and third supervisors, respectively.
Competing interests
The authors declare that they have no competing interests.
Publisher’s Note
Springer Nature remains neutral with regard to jurisdictional claims in published maps and institutional affiliations.
Received: 12 April 2017 Accepted: 13 November 2017
References
1. E Gopi,Digital speech processing using Matlab. (Springer, India, 2014) 2. T Herbig, F Gerl, W Minker, Self-learning speaker identification: a system
for enhanced speech recognition (2011)
3. FEA El-Samie,Information security for automatic speaker identification. (Springer-Verlag, New York, 2011), pp. 1–122
4. P Verma, PK DasM, I-Vectors in speech processing applications: a survey. Intl. J. Speech Technol.18(4), 529–546 (2015)
5. RSS Kumari, SS Nidhyananthan, et al. Fused MEL feature sets based text-independent speaker identification using Gaussian mixture model. Procedia Eng.30, 319–326 (2012)
6. R Togneri, D Pullella, An overview of speaker identification: Accuracy and robustness issues. Circ. Syst. Mag. IEEE.11(2), 23–61 (2011)
7. S Nakagawa, L Wang, S Ohtsuka, Speaker identification and verification by combining MFCC and phase information. IEEE Trans. Audio Speech Lang. Process.20(4), 1085–1095 (2012)
8. KSR Murty, B Yegnanarayana, Combining evidence from residual phase and MFCC features for speaker recognition. IEEE Signal Process. Lett.
13(1), 52–55 (2006)
9. L Wang, N Kitaoka, S Nakagawa, Robust distant speaker recognition based on position-dependent CMN by combining speaker-specific GMM with speaker-adapted HMM. Speech Commun.49(6), 501–513 (2007) 10. L Wang, K Minami, K Yamamoto, S Nakagawa, Speaker recognition by
combining MFCC and phase information in noisy conditions. IEICE Trans. Inf. Syst.93(9), 2397–2406 (2010)
11. Y Yujin, Z Peihua, Z Qun, in2010 IEEE International Conference on Intelligent computing and intelligent systems (ICIS). Research of speaker recognition based on combination of LPCC and MFCC. vol 3 (IEEE, Xiamen, 2010), pp. 765–767
12. S Bhardwaj, S Srivastava, M Hanmandlu, J Gupta, GFM-based methods for speaker identification. IEEE Trans. Cybernet.43(3), 1047–1058 (2013) 13. L Schmidt, M Sharifi, I Lopez Moreno, inAcoustics, speech and signal
processing (ICASSP), 2014 IEEE International Conference on. Large-scale speaker identification (IEEE, Florence, 2014), pp. 1650–1654
14. VR Apsingekar, PL De Leon, Speaker model clustering for efficient speaker identification in large population applications. IEEE Trans. Audio Speech Lang. Process.17(4), 848–853 (2009)
15. Y Hu, D Wu, A Nucci, Fuzzy-clustering-based decision tree approach for large population speaker identification. IEEE Trans. Audio Speech Lang. Process.21(4), 762–774 (2013)
16. X Zhao, Y Wang, D Wang, Robust speaker identification in noisy and reverberant conditions. IEEE/ACM Trans. Audio Speech Lang. Process.
22(4), 836–845 (2014)
17. Q Li, Y Huang, An auditory-based feature extraction algorithm for robust speaker identification under mismatched conditions. IEEE Trans. Audio Speech Lang. Process.19(6), 1791–1801 (2011)
18. Z Zhang, L Wang, A Kai, T Yamada, W Li, M Iwahashi, Deep neural network-based bottleneck feature and denoising autoencoder-based dereverberation for distant-talking speaker identification. EURASIP J. Audio Speech Music Process.2015(1), 1–13 (2015)
19. P Matˇejka, O Glembek, O Novotn`y, O Plchot, F Grézl, L Burget, JH Cernock`y, in2016 IEEE International Conference on Acoustics, speech and signal processing (ICASSP). Analysis of DNN approaches to speaker identification (IEEE, Shanghai, 2016), pp. 5100–5104
20. S Singh, MH Assaf, SR Das, SN Biswas, EM Petriu, V Groza, in2016 IEEE International Instrumentation and Measurement Technology Conference Proceedings. Short duration voice data speaker recognition system using novel fuzzy vector quantization algorithm (IEEE, Taipei, 2016), pp. 1–6 21. N Almaadeed, A Aggoun, A Amira, Speaker identification using
multimodal neural networks and wavelet analysis. IET Biometrics.4(1), 18–28 (2015)
22. N Wang, P Ching, N Zheng, T Lee, Robust speaker recognition using denoised vocal source and vocal tract features. IEEE Trans. Audio Speech Lang. Process.19(1), 196–205 (2011)
23. A Khanteymoori, M Homayounpour, M Menhaj, inComputer Conference, 2009. CSICC 2009. 14th International CSI. Speaker identification in noisy environments using dynamic Bayesian networks, (2009), pp. 601–606 24. Y Suh, H Kim, Discriminative likelihood score weighting based on
acoustic-phonetic classification for speaker identification. EURASIP J. Adv. Signal Process.2014(1), 126 (2014)
25. MJ Alam, V Gupta, P Kenny, P Dumouchel, Speech recognition in reverberant and noisy environments employing multiple feature extractors and I-vector speaker adaptation. EURASIP J. Adv. Signal Process.
2015(1), 50 (2015)
26. DA Reynolds, in1996 IEEE International Conference on Acoustics, speech, and signal processing (ICASSP). The effects of handset variability on speaker recognition performance: experiments on the switchboard corpus, vol 1 (IEEE, 1996), pp. 113–116
27. DA Reynolds, MA Zissman, TF Quatieri, GC O’Leary, BA Carlson, in1995 IEEE International Conference on Acoustics, speech, and signal processing (ICASSP). The effects of telephone transmission degradations on speaker recognition performance, vol 1 (IEEE, 1995), pp. 329–332
28. MTS Al-Kaltakchi, WL Woo, SS Dlay, JA Chambers, in2016 4th International Conference on Biometrics and Forensics (IWBF). Study of fusion strategies and exploiting the combination of MFCC and PNCC features for robust biometric speaker identification, (Limassol, 2016), pp. 1–6
29. MTS Al-Kaltakchi, WL Woo, SS Dlay, JA Chambers, in2016 IEEE Statistical signal processing workshop (SSP). Study of statistical robust closed set speaker identification with feature and score-based fusion (IEEE, Palma de Mallorca, 2016), pp. 1–5
30. CS Kumar, PM Rao, Design of an automatic speaker recognition system using MFCC, vector quantization and LBG algorithm. Int. J. Comput. Sci. Eng.3(8), 2942 (2011)
31. C Kim, RM Stern, in2012 IEEE International Conference on Acoustics, speech and signal processing (ICASSP). Power-normalized cepstral coefficients (PNCC) for robust speech recognition (IEEE, Kyoto, 2012), pp. 4101–4104 32. E Ambikairajah, JMK Kua, V Sethu, H Li, inSignal & Information Processing Association Annual Summit and Conference (APSIPA ASC), 2012 Asia-Pacific. PNCC-Ivector-SRC based speaker verification (IEEE, Hollywood, 2012), pp. 1–7
33. G Nijhawan, M Soni, A new design approach for speaker recognition using MFCC and VAD. Int. J. Image Graphics Signal Process. (IJIGSP).5(9), 43–49 (2013)
35. M Sumithra, A Devika, in2012 International Conference on Computer communication and informatics (ICCCI). A study on feature extraction techniques for text independent speaker identification (IEEE, Coimbatore, 2012), pp. 1–5
36. I Trabelsi, D Ben Ayed, in2012 6th International Conference on Sciences of Electronics, Technologies of Information and Telecommunications (SETIT). On the use of different feature extraction methods for linear and non linear kernels (IEEE, Sousse, 2012), pp. 797–802
37. K Kumar, C Kim, RM Stern, in2011 IEEE International Conference on Acoustics, speech and signal processing (ICASSP). Delta-spectral cepstral coefficients for robust speech recognition (IEEE, Prague, 2011), pp. 4784–4787 38. C Kim, R Stern, in2010 IEEE International Conference on. Acoustics, speech
and signal processing (ICASSP). Feature extraction for robust speech recognition based on maximizing the sharpness of the power distribution and on power flooring (IEEE, Dallas, 2010), pp. 4574–4577 39. NV Prasad, S Umesh, in2013 IEEE Workshop on Automatic speech
recognition and understanding (ASRU). Improved cepstral mean and variance normalization using Bayesian framework (IEEE, Olomouc, 2013), pp. 156–161
40. H Beigi,Fundamentals of speaker recognition. (Springer, USA, 2011) 41. DA Reynolds, TF Quatieri, RB Dunn, Speaker verification using adapted
Gaussian mixture models. Digital Signal Process.10(1-3), 19–41 (2000) 42. VR Apsingekar, PL De Leon, in2009 Conference Record of the Forty-Third Asilomar Conference on Signals, systems and computers. Support vector machine based speaker identification systems using GMM parameters (IEEE, Pacific Grove, 2009), pp. 1766–1769
43. SS Nidhyananthan, R Kumari, G Jaffino, in2012 International Conference on Devices, circuits and systems (ICDCS). Robust speaker identification using vocal source information (IEEE, Coimbatore, 2012), pp. 182–186 44. AA Ross, K Nandakumar, A Jain,Handbook of multibiometrics, vol. 6.
(Springer, USA, 2006)
45. A Ross, A Jain, Information fusion in biometrics. Pattern Recognit. Lett.
24(13), 2115–2125 (2003)
46. Findsounds . [Online]. Available http://www.findsounds.com/ 47. Freesfx . [Online]. Available http://www.freesfx.co.uk/
48. J Garofolo, L Lamel, W Fisher, J Fiscus, D Pallett, N Dahlgren, V Zue, TIMIT Acoustic-phonetic continuous speech corpus. Linguistic Data Consortium (1993). [Online]. Available https://catalog.ldc.upenn.edu/ldc93s1/ 49. Sitw database. [Online]. Available http://www.speech.sri.com/projects/
sitw/
50. Nist 2008 database. [Online]. Available https://catalog.ldc.upenn.edu/ LDC2011S07