Cross-validating Image Description Datasets and Evaluation Metrics
Josiah Wang and Robert Gaizauskas
Department of Computer ScienceUniversity of Sheffield, UK {j.k.wang, r.gaizauskas}@sheffield.ac.uk
Abstract
The task of automatically generating sentential descriptions of image content has become increasingly popular in recent years, resulting in the development of large-scale image description datasets and the proposal of various metrics for evaluating image description generation systems. However, not much work has been done to analyse and understand both datasets and the metrics. In this paper, we propose using a leave-one-out cross validation (LOOCV) process as a means to analyse multiply annotated, human-authored image description datasets and the various evaluation metrics, i.e. evaluating one image description against other human-authored descriptions of the same image. Such an evaluation process affords various insights into the image description datasets and evaluation metrics, such as the variations of image descriptions within and across datasets and also what the metrics capture. We compute and analyse (i) human upper-bound performance; (ii) ranked correlation between metric pairs across datasets; (iii) lower-bound performance by comparing a set of descriptions describing one image to another sentencenotdescribing that image. Interesting observations are made about the evaluation metrics and image description datasets, and we conclude that such cross-validation methods are extremely useful for assessing and gaining insights into image description datasets and evaluation metrics for image descriptions.
Keywords:Image Description, Evaluation Metrics, Vision and Language
1.
Introduction
The ability to describe the content of an image is essen-tial for various tasks such as image indexing and retrieval, and organising or browsing large image collections. With advances in visual object category recognition (e.g. being able to recognise and localise a car in an image), recent years have seen an upsurge of interest in moving beyond annotating images with isolated keywords to automatically generating sentence-level, natural language descriptions of image content (Three boys playing with a ball in the park). To facilitate progress and benchmarking on such automatic image description generation tasks, various image datasets with textual descriptions have been developed and various metrics proposed to evaluate such systems. The textual de-scriptions in such datasets are distinct from generic image captions (e.g. on Flickr or the Web, or in news articles) in that they aim to describe the literal visual content (actors, attributes, activities, scenes, etc.) of the corresponding im-age (A black dog jumping to catch a green ball in the field), and exclude non-literal, subjective opinions or semantic in-formation that requires external knowledge that cannot be determined from viewing the image alone (My adorable two-year-old poodle named Bobby loves playing with his favourite toy in the sun, pictured here in Hyde Park in Lon-donorHappiness is a day out with your pet).
The image datasets provide textual descriptions written by multiple human annotators per image, and are often used during evaluation as gold-standard reference descriptions against a system generated candidatedescription. How-ever, little work has been done to analyse or evaluate the gold-standard descriptions against themselves, i.e. evalu-ating a authored description against other human-authored descriptions of the same image. Besides answer-ing the obvious question of what the human upper-bound in the image description generation task is, performing such an evaluation can also provide further insights into (i) the
evaluation metricsused for evaluation; (ii) the similarities and differences within and across a variety ofdatasets. In this paper, we carry out this analysis. Throughout the paper, we use the termleave-one-out cross-validation (LOOCV)to refer to this method of evaluation1.
Evalua-tion is performed on a variety of image descripEvalua-tion datasets that are currently available, using several commonly-used metrics for image description generation tasks. More specifically, we compute and analyse (i) human upper-boundsfor major evaluation metrics on a range of image de-scription datasets; (ii)lower-boundsby examining the per-formance when comparing a set of descriptions describing one image to another sentencenotdescribing the particular image; these might describe a different image or could sim-ply be random sentences. The lower-bounds will be useful for investigating how textual descriptions vary within and across datasets (and how well the metrics capture this). We hypothesise that by comparing multiply-annotated, human-authored descriptions in the proposed manner, we can dis-cover subtle differences and biases within and across evalu-ation metrics and image description datasets. To our knowl-edge, this is the most extensive evaluation of image descrip-tion datasets and evaluadescrip-tion metrics carried out to date us-ing LOOCV over gold standard image descriptions.
Overview. The paper is structured as follows. We first present a review and discussion of existing image descrip-tion datasets (secdescrip-tion 2.) and automatic evaluadescrip-tion metrics that have been adopted for the image description genera-tion task (secgenera-tion 3.). In secgenera-tion 4., we present an upper-bound evaluation of how well humans perform in the im-age description generation task when judged against other
1We use the termcross-validationloosely: later in the paper
humans, on the different datasets using the various evalu-ation metrics described. This gives insight into the sim-ilarities and differences between the various datasets and metrics. We also compute the ranked correlations between pairs of metrics. Section 5. presents a lower-bound eval-uation, i.e. the scores obtained if one evaluates a set of descriptions for one image against an unrelated sentence (descriptions of another image, random words, etc.). This allows us to investigate the variation in human-authored de-scriptions within and across datasets. Finally, section 6. of-fers conclusions.
2.
Image description datasets
In this section, we provide a review of existing image datasets that are coupled with multiple human-authored de-scriptions of image content. As mentioned, noisy, large-scale datasets with user-generated captions exist for news images (Berg et al., 2004; Feng and Lapata, 2008) and Flickr (Ordonez et al., 2011; Chen et al., 2015; Thomee et al., 2015). However, in this paper, we are mainly in-terested in literal descriptions of what is depicted in the image, rather than non-literal or non-visual descriptions that require significant inference from additional knowl-edge about the image context. As such, we only explore image datasets that are annotated with multiple, sentential descriptions of the visually observable content of the corre-sponding image. The requirement for multiple descriptions per image also rules out the IAPR TC-12 dataset (Grub-inger et al., 2006) which contains only one English descrip-tion per image.2 Eight datasets meet the above criteria:
1. UIUC PASCAL Sentence Dataset
(PAS-CAL1K) (Farhadi et al., 2010) contains 1,000
real-world images and five crowd-sourced descrip-tions per image. The images are taken from the PASCAL Visual Object Classes (VOC) 2008 Chal-lenge (Everingham et al., 2015) (which in turn are sourced from Flickr), and are thus biased towards 20 selected object categories (aeroplane, bird, chair, etc.). The descriptions are authored by Amazon’s Mechanical Turk (AMT) workers based in the US.
2. The Visual and Linguistic Treebank Dataset
(VLT2K) (Elliott and Keller, 2013) comprises
2,424 images of various human actions (e.g. person using computer, riding a horse or a bicycle), along with three crowd-sourced descriptions per image. The images are again taken from the PASCAL VOC challenge, specifically the 2011 Action Classification Taster Competition to recognise 10 action classes (jumping, playing instrument, etc.). The descriptions are produced by AMT workers, and are generally made up of two sentences: the first sentence describes the main action in the image (“A band is playing on stage.”), and the second covers other background objects (“They are in a white tent.”). For this paper, we retain only thefirstsentence of each description.3
2While some images have multiple descriptions, they each
de-scribe different aspects of the image.
3
We have experimented using both sentences as the
descrip-3. Abstract Scenes Dataset(Zitnick and Parikh, 2013) consists of scenes illustrated from clip art and crowd-sourced descriptions for scenes. It is aimed at explor-ing image description generation without the complex-ities of visual recognition, as clip art instances can act as gold standard visual annotations. The dataset con-tains 10,020 images with six AMT crowd-sourced de-scriptions each (2 sets of 3 dede-scriptions, each descrip-tion per set describes different aspects of the image). Some of the images are alsosemanticallysimilar since they originate from the same seed description (1,002 seed descriptions used to generate 10 images each), and as such we expect this dataset to contain many se-mantically similar descriptions.
4. Flickr30k (Young et al., 2014), an extension of the Flickr8k (Rashtchian et al., 2010) dataset, contains over 30,000 Flickr images with five AMT crowd-sourced descriptions each. The original Flickr8k dataset is the successor of PASCAL1K ((1) above), and later extended as the Flickr30k dataset. Images are collected directly from Flickr, and depict various actions, events and human activities.
5. MS COCO (Microsoft Common Objects in
Con-text) (Lin et al., 2014) contains approximately 80,000 training images and 40,000 validation images with at least five AMT crowd-sourced descriptions per image. Like previous datasets, the images are sourced from Flickr. The emphasis on this dataset is to gather large numbers of images for a small set of 80 categories. As such, images and the descriptions may be biased towards these categories.
6. TheImageCLEF2015development set from the Scal-able Image Annotation, Localization and Sentence Generation task (Gilbert et al., 2015) of the Image-CLEF2015 (Villegas et al., 2015) challenge consists of 2,000webimages with 5 to 51 descriptions per image (with a mean of 9.5 descriptions). The descriptions are crowd-sourced using CrowdFlower. Unlike pre-vious image description datasets, the images are ob-tained from a large set of generic web pages gathered by the challenge organisers, making it a highly varied dataset, albeit still constrained by the 251 object cate-gories defined for the challenge.
7. Pascal50S(Vedantam et al., 2015) is an extension of Pascal1K ((1) above) with 50 descriptions per image. This dataset is used primarily for improving the relia-bility of evaluation given the significantly larger num-ber of reference image descriptions per image.
8. Abstract50S(Vedantam et al., 2015) is an extension of the Abstract Scenes Dataset ((3) above), also with 50 descriptions per image.
Parallel to our work, Bernardi et al. (2016) summarised most of these datasets, among others, and reviewed differ-ent approaches to image description generation. Ferraro et
al. (2015) also summarised a subset of these datasets, along with other vision and language related datasets. They also analysed the datasets based on different criteria, such as ab-stract:concrete word ratios, syntactic complexity and per-plexity. Most related to our work is their proposed measure of pairwise perplexity across different datasets to predict the words in a test set given a language model trained on another dataset. Our proposed LOOCV method can also achieve this, albeit in a different manner, and additionally allows us to evaluate the metrics as well as the datasets.
3.
Evaluation metrics
Several automatic metrics have been proposed for evaluat-ing image description generation systems. We review and compare an array of evaluation measures (and their vari-ants) that have been proposed or adopted for the task:
1. BLEU (Papineni et al., 2002) is a precision-based metric adopted from the machine translation commu-nity. It measures the number ofn-grams in a candidate sentence also appearing in at least one reference sen-tence, with the count clipped to avoid positive terms being over-repeated in the candidate sentence.
BLEU-nis the geometric mean between the modified preci-sion (pn) for eachn, multiplied by the brevity penalty (BP) to penalise short sentences:
BLEUN =BP×exp N X
n=1
wn logpn (1)
wherewnis usually set to N1, andN being the maxi-mumn-gram order ofBLEUN.
While BLEU was originally devised as a corpus-level metric, it has also been used to measure sentence-level performance, with various smoothing techniques pro-posed to address the issue ofn-gram sparseness at sen-tence level, especially for higher ordern-grams (Lin and Och, 2004; Gao and He, 2013; Chen and Cherry, 2014). For this paper, we evaluate sentence-levelBLEU-1,BLEU-2,BLEU-3andBLEU-4with smoothing.4 Our implementation is different from the
BLEU evaluation used in previous image description generation work; in their case, no smoothing is per-formed and the brevity penalty is always set to 1. Al-though the latter may have been useful in earlier, more constrained work (“a cow” is considered a good sen-tence), recent progress in techniques and the availabil-ity of larger datasets have shifted the focus of the task
4
Our implementation of smoothing is based on the official
mteval-v13a.plscript, which assigns a geometric sequence
1/2k
to n-grams with zero matches – please refer to Chen and Cherry (2014) for the algorithm (Smoothing Technique 3). We found an oddity in the script’s handling of short hypothe-ses (length l < n), where division-by-zero cases are assigned
logp>l = 0(e.g. a hypothesis of length 2 will result inp3 = 00
for trigram matches, andlogp3is set to0in this case). Eq (1) will
inflate the scores of such cases (becauseexp(0)=1), making the BLEU-3 score undesirably higher than the BLEU-2 in this exam-ple. Our implementation modifies this by setting the denominator of such candidates to 1 and performing smoothing as described.
to “describing the image as a human would”. As such we argue that precision alone is insufficient, and that recall should now be factored in as part of the evalua-tion process.
2. ROUGE(Lin, 2004) is arecall-based metric used to evaluate automatic summarisation systems. In its orig-inal formulation,ROUGE-Ncomputes then-gram re-call between a candidate summary and a set of refer-ence summaries. Its variants, such asROUGE-Land
ROUGE-S, aref-measure-based metrics. ROUGE-L
considers the longest common subsequence between two summaries, while ROUGE-S uses skip-bigram co-occurrences as statistics for measuring the similarity between two summaries, allowing for gaps between the two terms of a bigram. ROUGE-Wis a variant of ROUGE-L, and awards higher scores to contiguous
n-grams over skip-grams. ROUGE-SU is an exten-sion of ROUGE-S which also captures unigram co-occurrences in addition to skip bigrams. In this paper, we evaluate – using the officialrouge-1.5.5.pl
script – the following variants: ROUGE-15,
ROUGE-L, ROUGE-W1.2, and ROUGE-SU4.
3. Meteor(Denkowski and Lavie, 2014), again adopted from machine translation, is anf-measure-based mea-sure that finds the optimal alignment of chunks of matched text, incorporating semantic knowledge by allowing terms to be matched to stemmed words, syn-onyms and paraphrases. Content and function word matches can be assigned different weights, and each type of matcher (exact, stemmed, synonym, para-phrase) is also weighted individually. Word ordering is accounted for by encouraging fewer matched chunks, indicating less fragmentation. Meteor matches a can-didate text to each reference one-to-one, and takes the maximumscore out of all references as the final score. We use the official version 1.5 of Meteor for this paper, with the default recommended parameters for English.
4. CIDEr (Vedantam et al., 2015) is a measure devel-oped specifically for evaluating image descriptions by consensus. The measure computes the cosine sim-ilarity (per n-gram length, n) between a candidate and reference description, each represented as TF-IDF weighted bag of n-grams. The scores are averaged over all reference descriptions belonging to the same image, and further averaged across n. A variant of the measure,CIDEr-Dhas also been proposed to pre-vent gaming issues with the metric. Note that in the official version of CIDEr/CIDEr-D, the score is arbi-trarily multiplied by a factor of 10 so that the scores do not appear too discouragingly low. The theoreti-cal possible range is thus between 0.0 and 10.0,where the scores of state-of-the-art image description genera-tion systems are often between 0.8-1.06. In this paper,
5
For ROUGE-1, we consider the f-measure variant with equally weighted precision and recall. We have tested the re-call version of ROUGE-1 and found the scores to be just slightly higher than thef-measure. The general trend however is similar.
6
we report therawCIDEr/CIDEr-D scores before this multiplication process. We also compute IDF scores independently per dataset.7
Elliott and Keller (2014) evaluated how well the first three metrics correspond to human judgements. This is done by asking human annotators to score the output sentences from one of the systems of Hodosh et al. (2013) on a scale of 1-4, and computing the correlation between the human scores and the scores from the same system for each metric. They found that Meteor correlates best with human judgements, followed by ROUGE-SU4 and BLEU-4 (with smoothing). Vedantam et al. (2015) also compared the four metrics in terms of how well they correlate with human judgement on aconsensustask, i.e. which is more similar to sentence A? Sentence B or sentence C? They found CIDEr captured human consensus best.
Other metrics have also been proposed to evaluate the con-tent of image descriptions, for example using semantic tu-ples (Ellebracht et al., 2015) and concentrating only on the content selection phase (Wang and Gaizauskas, 2015). These however require additional annotations.
4.
Human upper-bound evaluation
Given the multiply annotated datasets, we first evaluate hu-man perforhu-mance on each using LOOCV, i.e. by withhold-ing one human-authored image description as a candidate description, and evaluating it against all remaining descrip-tions for the same image, repeating the process in turn for each description of the image. The final score is produced either by micro-averaging the scores across all descriptions in the dataset or by macro-averaging the scores across all images (average scores per image, and average the mean scores). Other statistics such as standard deviation, me-dian, minimum and maximum scores are also computed. We evaluate the images descriptions for eight datasets (sec-tion 2.), using the various metrics described in sec(sec-tion 3. In section 4.2., we further measure the ranking correlation between metrics. As it is impractical to present all these numbers in this paper, we provide all computed statistics online8, and instead concentrate here on highlighting and
discussing interesting observations.
As a preprocessing step, all image descriptions are stripped of punctuation, case-normalised and tokenised (words sep-arated by hyphens are always tokenised).
4.1.
Human upper-bound results
We discuss the human upper-bound evaluation results by metric, interleaved with dataset-specific observations where relevant.
7We have experimented concatenating all datasets to
com-pute a common DF statistic, which results in significant bias to-wards the two large datasets (MS COCO and Flickr30k). We did not observe any notable differences except for the Abstract Scenes Dataset and Abstract50S, which ended up with much higher CIDEr scores. We presume that this is mainly due to the words ‘mike’ and ‘jenny’, common in these datasets, being as-signed inflated IDF weights as they do not occur often (if ever) in the dominant MS COCO and Flickr30k datasets.
8
http://visualsense.github.io/loocv/
PASCAL1K VLT2K Abstract Flickr30k MSCOCOImageCLEF2015PASCAL50SAbstract50S
0.0 0.1 0.2 0.3 0.4 0.5 0.6 0.7 0.8 0.9 1.0
score
BLEU-1 BLEU-2 BLEU-3 BLEU-4
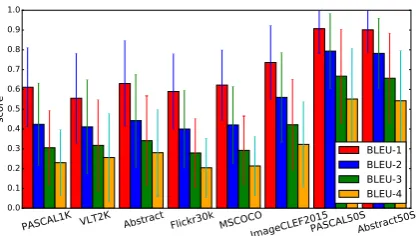
Figure 1: Upper-bound, micro-averaged BLEU scores for the eight datasets (best viewed in colour).
PASCAL1K VLT2K Abstract Flickr30k MSCOCOImageCLEF2015PASCAL50SAbstract50S
0.0 0.1 0.2 0.3 0.4 0.5 0.6 0.7 0.8 0.9 1.0
score
ROUGE-1 ROUGE-L ROUGE-W1.2 ROUGE-SU4
Figure 2: Upper-bound, micro-averaged ROUGE scores for the eight datasets.
BLEU. Figure 1 shows the absolute BLEU scores for the dataset. We found the overall BLEU-1 scores to be high (0.56-0.91), and as expected are lower for increased n -gram length. We also noticed that BLEU is sensitive to the number of references per image. Datasets with many de-scriptions per image (ImageCLEF2015, PASCAL50S, Ab-stract50S) produced higher scores, while VLT2K (two ref-erences per image) yielded lower scores. In fact, the me-dian BLEU score for PASCAL50S is actually 1.00. The reason for this observation is that BLEU measures the over-lap between a candidate and theunion ofn-grams in the corresponding references, thus increasing the number of references increases the chances of overlap. We further verified this by repeating the experiments, but sampling only 5 descriptions per image for ImageCLEF2015, PAS-CAL50S and Abstract50S. The BLEU scores on these re-duced datasets are now in the same range as the other datasets. As such, we do not recommend BLEU for datasets with too many reference descriptions because of the higher likelihood of spurious matching.
Another noteworthy point about all the datasets is that the maximum BLEU scores (all variants, micro-averaged) are 1.00 across all datasets. This means that for each dataset, there is at least one description that has all its 4-grams matched with the union of all 4-grams in the correspond-ing references.
ROUGE. Like BLEU, the unigram-based ROUGE-1
PASCAL1K VLT2K Abstract Flickr30k MSCOCOImageCLEF2015PASCAL50SAbstract50S
0.0 0.1 0.2 0.3 0.4 0.5 0.6 0.7 0.8 0.9 1.0
score
Meteor CIDEr CIDEr-D
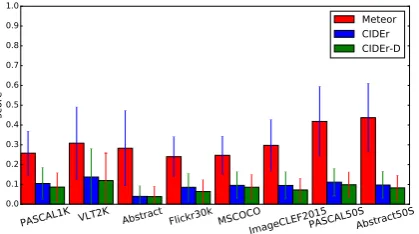
Figure 3: Upper-bound, micro-averaged Meteor, CIDEr and CIDEr-D scores for the eight datasets.
common subsequences. In contrast to BLEU, ROUGE is not sensitive to number of descriptions per image, as it per-forms averaging over all reference descriptions. This can be seen from the more uniform scores across datasets in Figure 2. With the scores being less dependent on ref-erence size, we observe several outliers. VLT2K yields higher ROUGE scores than other datasets, most likely be-cause the first sentence describes the main action, mak-ing the problem more constrained, and has better a chance of word or skip-gram overlaps. In fact, there are images with all three reference sentences being identical (six such cases). The standard deviation on this dataset, however, is also higher. This suggests that there are also many main ac-tions in the images that can be described differently by dif-ferent annotators. The other outlier is the Abstract dataset, with the lowest ROUGE-1, ROUGE-L and ROUGE-SU4 scores. This confirms the fact that the agreement between descriptions of the same image is quite low, i.e. many de-scriptions of the same image describe something different about the image. This can also be confirmed by compar-ing Abstract against Abstract50S, where the score range of Abstract50S is more similar to that of other datasets as it does not have this constraint of defining different aspects of the same image. Therefore, ROUGE manages to high-light this fact by averaging recall across allreference de-scriptions, compared to BLEU which computing precision against matching segments inanyreference descriptions.
Meteor. We can observe from Figure 3 that Meteor is also sensitive to the number of reference descriptions per im-age, albeit not to the extent of BLEU. This is because Me-teor takes the best matching reference (maximum score) as the final score, thus increasing the likelihood for a good match with more references. Contrast this to BLEU which sums co-occurrences of each n-gram from anyreference (i.e. matchingn-grams do not have to be in the same sin-gle reference ’robI’ve changed the wording here to make it clearer – is this correct?), which explains why BLEU is even more dependent on the number of reference de-scriptions. Again, like BLEU, the maximum Meteor score across all datasets is 1.0 (exact match). This suggests that there is at least one image with at least one pair of identi-cal descriptions; we have manually verified this fact. Thus, Meteor is the only metric covered in this paper that can cap-ture such cases. Again, VLT2K shows high scores despite
having only two reference sentences. Interestingly, Ab-stract actually showed the highest standard deviation with Meteor compared to other datasets (and other metrics). We attempt to draw some inferences from the second order macro-average statistics, more specifically by computing the standard deviation across descriptions per image, and computing the mean and standard deviation of these stan-dard deviations. The value for these are quite high, demon-strating that (i) there is on average high variation within descriptions of the same image; (ii) some descriptions of the same image have similar pairs, while others are quite dissimilar (the standard deviation themselves vary).
CIDEr. Compared to other metrics, the absolute raw
CIDEr scores are much lower. This is due to CIDEr be-ing designed to evaluate descriptions by consensus, i.e. a good candidate should agree with the majority of reference descriptions. To achieve a CIDEr score of 1.00 requires the candidate description andallreference descriptions to be exact matches. Our informal experiments showed that changing just a few words toonereference description can greatly affect the score. CIDEr is, however, very intu-itive and reinforces our previous observations. The Ab-stract Scenes Dataset achieved extremely low CIDEr scores (<0.04) compared to other datasets (≈0.09-0.11), show-ing low consensus among the descriptions. Again, VLT2K showed high consensus (0.14), with a high standard devia-tion (0.13), and a maximum score of 1.00 (all three descrip-tions are exact matches). CIDEr-D showed similar results.
Other observations. Across all metrics, MS COCO con-sistently achieved slightly higher scores than Flickr30k, suggesting that MS COCO might be more homogeneous than Flickr30k. PASCAL1K and MS COCO seems to be about equally homogeneous. The homogeneity of Image-CLEF2015 is hard to assess as it varies across metrics, but in general seems to lie between Flickr30k and MS COCO.
4.2.
Ranking correlation between metrics
In this section, we investigate whether different metrics rank datasets similarly. This gives insight into which met-ric pairs correlate better with each other. Two setting are explored: (i) ranking per image (average the upper-bound scores across all descriptions for the same image); (ii) rank-ing per description (use the upper-bound score for each de-scription directly, independent of the image). Kendall’sτ
ranking coefficient is used to measure the monotonic corre-lation between metric pairs. This measure is more intuitive and less sensitive to outliers compared to the more com-monly used Spearman’s ρ.9 We used Kendall’sτ-b vari-ant which makes adjustments for ties. Thep-values (two-tailed) are found to be extremely small (the largest being 9.9E-40). Again, we concentrate on highlighting interest-ing facts – detailed numbers are provided online.
Per image ranking correlation. All metric pairs across all datasets are found to be positively correlated (τ be-tween 0.37-0.97), indicating that there is a monotonic re-lationship between the rankings of each metric pair. First, looking at the coefficient values among BLEU variants,
9
BLEU-2 and BLEU-3 show very strong correlation (0.83-0.88), BLEU-3 and BLEU-4 show even stronger correla-tions (0.89-0.93). BLEU-2 and BLEU-4 show strong cor-relation (0.74-0.82), but not as strong as BLEU-2/BLEU-4 and BLEU-3/BLEU-4. BLEU-1 shows much weaker cor-relation: 0.67-0.79 against BLEU-2, 0.57-0.70 (BLEU-3), and 0.51-0.66 (BLEU-4). BLEU-1 also seems to show much weaker correlation when compared against all other metrics (0.37-0.70), especially on the datasets with many descriptions (0.38-0.49 against PASCAL50S/Abstract50S). All ROUGE variants strongly correlate with each other, especially between ROUGE-L and ROUGE-W (0.87-0.93). All BLEU variants almost always correlate bet-ter with ROUGE-SU4 than with the other ROUGE vari-ants. ROUGE also shows weak correlation with Me-teor and CIDEr (0.39-0.68). ROUGE generally correlates slightly better with Meteor than with CIDEr (especially for Flickr30k, VLT2K and MS COCO), although the correla-tion is comparable for PASCAL50S.
The correlation between CIDEr and CIDEr-D is extremely strong (0.80-0.97), especially for Abstract, MS COCO, Ab-stract50S and PASCAL50S (0.90 or above). Meteor and CIDEr/CIDEr-D are moderately correlated (0.55-0.68).
Per description ranking correlation. Compared to per image ranking, the overall correlation for per description ranking is predictably slightly lower, except for Abstract which varies depending on the metric. The datasets with many descriptions show a larger drop in scores, because there can be more disagreements in rankings with a larger set of descriptions. There is quite a large drop in correlation scores for Meteor compared to per image ranking. This is likely because of themaxfunction used by Meteor, making the variation in rankings larger; the mean aggregation for per image ranking appears to help alleviate this.
5.
Lower-bound evaluation
In this section, we employ LOOCV to compute various lower-bounds for evaluation metrics across different im-age description datasets. More specifically, we investigate the performance of various metrics when comparing a set of reference descriptions describing one image to a candi-date sentence that isnot from the original set of descrip-tions for that particular image. The candidate might de-scribe a different image from the same or different dataset, or could simply be random sentences from a generic corpus or even a random list of words. Lower-bound evaluation by LOOCV will be useful for investigating how image de-scriptions vary within and across dataset, and how well the metrics capture this.
To explore lower-bound evaluation, we perform LOOCV as in section 4., but substitute the candidate description that has been left out with one of the following candidate ‘de-scriptions’:
1. Random Intra-Dataset: A random description from
adifferentimage from thesamedataset. More specif-ically, for each candidate description, a description from another image in the dataset is randomly se-lected. This allows us to investigate how descriptions of different images vary within the same dataset.
2. Random Inter-Dataset: A random description from
adifferentdataset (selected at random). This allows us to explore how descriptions vary across datasets. Also, by comparing this toRandom Intra-Dataset, we can establish how domain-specific a particular dataset is. To be precise, for each candidate descrip-tion, one dataset (not the source dataset) is first ran-domly selected, and a description is ranran-domly chosen from the selected dataset. To avoid bias from highly similar datasets, we rule out using descriptions from Pascal50S as candidates for Pascal1K (and vice versa); and similarly for Abstract and Abstract50S.
3. Random Brown:A random sentence from the Brown
corpus. This is useful to ensure that the metrics are indeed measuring something more specific to image descriptions (content, structures, style, etc.) We retain only sentences with at least five word tokens and at least ten characters.
4. Gibberish Dataset: A randomly generated ‘gibber-ish’n-word sentence, with each word drawn indepen-dently from the unigram distribution of the image de-scriptions of thesamedataset. This explores how well a metric captures structure, as these ‘sentences’ are not grammatically well-formed. We experiment with
n= 10andn=average number of words in the de-scriptions of the corresponding dataset.
5. Gibberish Brown: A randomly generated
‘gibber-ish’n-word sentence, with each word drawn indepen-dently from the unigram distribution of the Brown cor-pus. This is useful to investigate how well a metric captures structureandcontent. We expect the scores for these to be the lowest out of all the substitute can-didates above. Again, we experiment with a fixed
n = 10and a variablenper dataset (average length of descriptions of the dataset).
5.1.
Results for lower-bound evaluation
Overall, the lower-bound scores are significantly lower than the upper-bound scores. As in section 4., we discuss the results by metric and, where relevant, highlight dataset-specific observations, providing detailed numbers online.
BLEU. The most notable observation is that the BLEU
to be due to BLEU being biased towards shorter tions, rather than because of the correctness of the descrip-tions. However, candidates drawn from a dataset of im-age descriptions perform better than those from the Brown corpus. As such, we can conclude that BLEU captures word overlap well, although we could not gain much in-sight about the datasets themselves.
ROUGE. In contrast to BLEU, ROUGE is less sensitive
to the candidate sentence length. Although we detected some slight bias towards longer sentences (e.g. Gibberish fared better with n=10 than n=6 for Abstract), the met-ric is balanced by both precision and recall, as evidenced from the comparable scores betweenRandom Brownand
Gibberish Brown. Like BLEU, the ROUGE scores are
much higher for candidates drawn from dataset-specific corpora than for those using the Brown corpus, show-ing the importance of domain-specific tunshow-ing for generat-ing image descriptions. Random Intra-Dataset yielded much higher ROUGE scores thanRandom Inter-Dataset, something not quite captured by BLEU. This suggests that besides domain-specific tuning, dataset-specific tun-ing is also important for these datasets, especially Ab-stract (ROUGE-1 score of 0.23 for Intra-Dataset vs. 0.09 for Inter-Dataset) which contains many dataset-specific vo-cabularies and structure/style not present in other datasets. We also found VLT2K to be quite dataset-specific (0.23 vs. 0.15), while ImageCLEF2015/MS COCO (0.17 vs. 0.14) are less so and PASCAL1K/PASCAL50S/Flickr30k even less again (less than 0.02 difference in score).
Another interesting observation is how the scores of
Random Intra-Dataset for ROUGE-1, ROUGE-L and
ROUGE-W1.2 are much closer to their upper-bound scores (ratio is about 1:2). This either shows that the datasets are pretty homogeneous, or that the ROUGE measure over-rewards irrelevant terms. The Abstract Scenes Dataset, with a ROUGE-1 score of 0.23 (compared to its upper-bound of 0.30), and Abstract50S (0.28 vs. 0.40) show the smallest difference between the upper-bound and the lower-bound Random Intra-Dataset scores. The small difference in score suggests that the datasets are quite homogeneous – recall that the dataset contains images that are semantically similar. Thus, ROUGE successfully picks out this fact. The distances between the scores are much larger for ROUGE-SU4 (ratio about 1:3), although it still picks out the homo-geneity of the two Abstract datasets very well. For this rea-son, ROUGE-SU4 may be the best measure for evaluating image descriptions among the ROUGE variants.
Meteor. The lower-bounds for Meteor also echo the same observations from ROUGE: (i) using dataset-specific cor-pora gives higher scores than using the Brown corpus; (ii) structured sentences are better than ’gibberish’. Like ROUGE, Meteor also captures dataset specificity, but in-terestingly shows an even larger difference in the Intra-Dataset vs Inter-Intra-Dataset scores for Abstract/Abstract50S (0.17/0.23 vs. 0.07/0.08 respectively) compared to the ratio of other datasets, and also showed that Flickr30k is more dataset-specific than previously suggested by ROUGE. Like ROUGE-SU4, Meteor also captures the homogeneity of the datasets (ratio is about 1:3 to 1:4, except the
Ab-stract datasets with a ratio of about 1:1.6-1:1.9). In this case, we find that Meteor might be an even better measure than ROUGE-SU4, or otherwise comparable.
CIDEr. Finally, CIDEr/CIDEr-D also demonstrates the
same observations as ROUGE, giving higher scores to can-didates from image description specific domains than from the Brown corpus. It also captures the fact that the two Abstract datasets are much more dataset-specific than the other datasets. What is most striking is that the differ-ences in scores between the upper-bounds and Random Intra-Datasetlower-bounds are much larger compared to ROUGE and Meteor (e.g. 0.1372 vs. 0.0095 for VLT2K, 0.0949 vs. 0.0029 for ImageCLEF2015, and 0.0384 vs. 0.0066 for Abstract). Thus it captures the homogeneity of datasets while still keeping the lower-bound/upper-bound score differences large. We have not ascertained why, but we assume that this is because of the way CIDEr tries to ensure that the candidate must be similar to all reference descriptions (and by extension the majority). This is a very interesting observation, which makes CIDEr an extremely valuable metric for evaluating image descriptions.
6.
Conclusion
We proposed using leave-one-out cross validation (LOOCV) to analyse and gain insights into multiply annotated, human-authored, image description datasets as well as commonly used metrics for evaluating image descriptions. We estimated a human upper-bound perfor-mance on the task with regards to each evaluation metric, for each dataset. The upper-bound performance scores provided us insights into both the datasets and the metrics. For example, BLEU is sensitive to the number of reference descriptions, Meteor was useful for discovering the fact that there is at least one image with at least one pair of identical descriptions, and ROUGE and CIDEr were useful for measuring agreement/consensus among reference descriptions. We also ranked the image descriptions per dataset by their scores, and analysed the rank correlation between difference metrics. We found BLEU to be weakly correlated with other metrics, and that ROUGE shows better correlation than BLEU to Meteor and CIDEr, which in turn are moderately correlated. We further estimated various lower-bounds for the evaluation metrics, again using LOOCV, to investigate how image descriptions vary within and across datasets and how well the evaluation metrics capture this. From the results, we concluded that learning to generate descriptions from image description specific datasets does yield better performance than from a generic corpus, and that using dataset-specific image descriptions further improves results, even more so with datasets like the Abstract Scenes Dataset, which has a unique vocabulary set and language structure.
Future work should consider characterising image descrip-tion datasets and discovering which components of image descriptions matter more to each evaluation metric.
7.
Acknowledgements
8.
Bibliographical References
Berg, T. L., Berg, A. C., Edwards, J., and Forsyth, D. A. (2004). Who’s in the picture? In Neural Information Processing Systems, pages 137–144.
Bernardi, R., Cakici, R., Elliott, D., Erdem, A., Erdem, E., Ikizler-Cinbis, N., Keller, F., Muscat, A., and Plank, B. (2016). Automatic description generation from images: A survey of models, datasets, and evaluation measures. Journal of Artificial Intelligence Research, 55:409–442. Chen, B. and Cherry, C. (2014). A systematic
compari-son of smoothing techniques for sentence-level BLEU. In Proc. of the Ninth Workshop on Statistical Machine Translation, pages 362–367.
Chen, J., Kuznetsova, P., Warren, D., and Choi, Y. (2015). D´ej`a image-captions: A corpus of expressive descrip-tions in repetition. In Proc. NAACL-HLT, pages 504– 514.
Denkowski, M. and Lavie, A. (2014). Meteor universal: Language specific translation evaluation for any target language. InProc. of the EACL 2014 Workshop on Sta-tistical Machine Translation.
Ellebracht, L. D., Ramisa, A., Madhyastha, P. S., Cordero-Rama, J., Moreno-Noguer, F., and Quattoni, A. (2015). Semantic tuples for evaluation of image to sentence gen-eration. InProc. of the 4th Workshop on Vision and Lan-guage, pages 18–28.
Elliott, D. and Keller, F. (2013). Image description us-ing visual dependency representations. InProc. Conf. on Empirical Methods in Natural Language Processing. Elliott, D. and Keller, F. (2014). Comparing automatic
evaluation measures for image description. InProc. As-sociation for Computational Linguistics.
Everingham, M., Eslami, S. M. A., Van Gool, L., Williams, C. K. I., Winn, J., and Zisserman, A. (2015). The Pascal Visual Object Classes challenge: A retrospective. Inter-national Journal of Computer Vision, 111(1):98–136. Farhadi, A., Hejrati, M., Sadeghi, A., Young, P.,
Rashtchian, C., Hockenmaier, J., and Forsyth, D. (2010). Every picture tells a story: Generating sentences for im-ages. InProc. European Conf. on Computer Vision. Feng, Y. and Lapata, M. (2008). Automatic image
annota-tion using auxiliary text informaannota-tion. InProc. ACL-08: HLT, pages 272–280.
Ferraro, F., Mostafazadeh, N., Huang, T.-H., Vanderwende, L., Devlin, J., Galley, M., and Mitchell, M. (2015). A survey of current datasets for vision and language re-search. InProc. Conf. on Empirical Methods in Natural Language Processing, pages 207–213.
Gao, J. and He, X. (2013). Training MRF-based phrase translation models using gradient ascent. In Proc. NAACL-HLT, pages 450–459.
Gilbert, A., Piras, L., Wang, J., Yan, F., Dellandrea, E., Gaizauskas, R., Villegas, M., and Mikolajczyk, K. (2015). Overview of the ImageCLEF 2015 scalable image annotation, localization and sentence generation task. In CLEF2015 Working Notes, CEUR Workshop Proceedings.
Grubinger, M., Clough, P., M¨uller, H., and Deselaers, T. (2006). The IAPR benchmark: A new evaluation
re-source for visual information systems. InLanguage Re-sources and Evaluation, pages 13–23.
Hodosh, M., Young, P., and Hockenmaier, J. (2013). Fram-ing image description as a rankFram-ing task: Data, models and evaluation metrics. Journal of Artificial Intelligence Research, 47(1):853–899.
Lin, C.-Y. and Och, F. J. (2004). ORANGE: A method for evaluating automatic evaluation metrics for machine translation. In Proc. International Conf. on Computa-tional Linguistics, pages 501–507.
Lin, T., Maire, M., Belongie, S., Hays, J., Perona, P., Ramanan, D., Doll´ar, P., and Zitnick, C. L. (2014). Microsoft COCO: Common objects in context. CoRR, abs/1405.0312.
Lin, C.-Y. (2004). ROUGE: A package for automatic eval-uation of summaries. In Proc. ACL workshop on Text Summarization Branches Out.
Ordonez, V., Kulkarni, G., and Berg, T. L. (2011). Im2text: Describing images using 1 million captioned photographs. InNeural Information Processing Systems. Papineni, K., Roukos, S., Ward, T., and Zhu, W.-J. (2002). BLEU: A method for automatic evaluation of machine translation. InProc. Association for Computational Lin-guistics, pages 311–318.
Rashtchian, C., Young, P., Hodosh, M., and Hockenmaier, J. (2010). Collecting image annotations using amazon’s mechanical turk. InProc. of the NAACL HLT 2010 Work-shop on Creating Speech and Language Data with Ama-zon’s Mechanical Turk, pages 139–147.
Thomee, B., Shamma, D. A., Friedland, G., Elizalde, B., Ni, K., Poland, D., Borth, D., and Li, L. (2015). The new data and new challenges in multimedia research. CoRR, abs/1503.01817.
Vedantam, R., Lawrence Zitnick, C., and Parikh, D. (2015). CIDEr: Consensus-based image description evaluation. InProc. IEEE Conf. on Computer Vision & Pattern Recognition.
Villegas, M., M¨uller, H., Gilbert, A., Piras, L., Wang, J., Mikolajczyk, K., de Herrera, A., Bromuri, S., Amin, M. A., Mohammed, M. K., Acar, B., Uskudarli, S., Mar-vasti, N. B., Aldana, J. F., and del Mar Rold´an Garc´ıa, M. (2015). General overview of ImageCLEF at the CLEF 2015 labs. In Josiane Mothe, et al., editors, Experimen-tal IR Meets Multilinguality, Multimodality, and Interac-tion, volume 9283 ofLecture Notes in Computer Science, pages 444–461. Springer International Publishing. Wang, J. and Gaizauskas, R. (2015). Generating image
de-scriptions with gold standard visual inputs: Motivation, evaluation and baselines. InProc. 15th European Work-shop on Natural Language Generation, pages 117–126. Young, P., Lai, A., Hodosh, M., and Hockenmaier, J.
(2014). From image descriptions to visual denotations: New similarity metrics for semantic inference over event descriptions. Trans. of the Association for Computa-tional Linguistics, 2:67–78, February.