P R O C E E D I N G S
Open Access
Comparison of 2 models for gene
–
environment interactions: an example of
simulated gene
–
medication interactions on
systolic blood pressure in family-based data
Lindsay Fernández-Rhodes
1*, Chani J. Hodonsky
1, Mariaelisa Graff
1, Shelly-Ann M. Love
1, Annie Green Howard
2,
Amanda A. Seyerle
1, Christy L. Avery
1, Geetha Chittoor
3, Nora Franceschini
1, V. Saroja Voruganti
3, Kristin Young
1,
Jeffrey R. O
’
Connell
4, Kari E. North
1and Anne E. Justice
1FromGenetic Analysis Workshop 19 Vienna, Austria. 24-26 August 2014
Abstract
Background:Nearly half of adults in the United States who are diagnosed with hypertension use blood-pressure-lowering medications. Yet there is a large interindividual variability in the response to these medications. Two complementary gene–environment interaction methods have been published and incorporated into publicly available software packages to examine interaction effects, including whether genetic variants modify the association between medication use and blood pressure. The first approach uses a gene–environment interaction term to measure the change in outcome when both the genetic marker and medication are present (the“interaction model”). The second approach tests for effect-size differences between strata of an environmental exposure (the
“med-diff”approach). However, no studies have quantitatively compared how these methods perform with respect to 1 or 2 degree of freedom (DF) tests or in family-based data sets. We evaluated these 2 approaches using simulated genotype–medication response interactions at 3 single nucleotide polymorphisms (SNPs) across a range of minor allele frequencies (MAFs 0.1–5.4 %) using the Genetic Analysis Workshop 19 family sample.
Results:The estimated interaction effect sizes were on average larger in the interaction model approach compared to the med-diff approach. The true positive proportion was higher for the med-diff approach for SNPs less than 1 % MAF, but higher for the interaction model when common variants were evaluated (MAF >5 %). The interaction model produced lower false-positive proportions than expected (5 %) across a range of MAFs for both the 1DF and 2DF tests. In contrast, the med-diff approach produced higher but stable false-positive proportions around 5 % across MAFs for both tests.
Conclusions:Although the 1DF tests both performed similarly for common variants, the interaction model estimated true interaction effects with less bias and higher true positive proportions than the med-diff approach. However, if rare variation (MAF <5 %) is of interest, our findings suggest that when convergence is achieved, the med-diff approach may estimate true interaction effects more conservatively and with less variability.
* Correspondence:[email protected]
1Department of Epidemiology, University of North Carolina at Chapel Hill,
Chapel Hill, NC 27514, USA
Full list of author information is available at the end of the article
Background
Hypertension—defined as an average systolic blood
pres-sure (SBP) of 140 mm Hg or higher or an average
dia-stolic blood pressure (DBP) of 90 mm Hg or
higher—affects approximately 30 % of American adults,
45 % of whom use antihypertensive medications for blood pressure (BP) control [1, 2]. Broad interindividual variability in responsiveness to antihypertensive medica-tions suggests that genetics may modify response to treatment [3, 4]. Furthermore, SBP and DBP are herit-able, and candidate-gene and genome-wide association studies have uncovered more than 50 loci associated
with BP [5–15]. Detection of genetic markers
respon-sible for differential pharmacologic response inform our understanding of biological pathways relevant to hyper-tension, as well as future interventions to reduce its burden [16, 17].
Two complementary gene–environment (G × E)
interaction methods have been described in the lit-erature to test G × E interactions such as differential response to antihypertensives resulting from genetic
variation. The first method (the “interaction model”)
tests for interaction using a gene–environment
inter-action term to measure the change in outcome when both the genetic marker and environmental factor are present, as compared to when the genetic marker is present but the environmental factor is not [18].
The second method (the “med-diff” approach) tests
for effect size differences between strata that differ by environmental exposure [19]. Both methods can estimate 1 degree of freedom (DF) tests of gene-medication interactions as well as 2DF (or joint) tests of these interactions and the genetic main effect using publicly available software.
Although these methods have been assumed to be the-oretically equivalent, no previous studies have directly compared them. Therefore, in this study we aimed to evaluate their performance by comparing both their power to detect simulated interaction effects as well as their false-positive proportions (FPPs) in family-based data from the Genetic Analysis Workshop 19 (GAW19) [20]. This was done by first calculating the true-positive proportion (TPP) for the 1DF and 2DF tests using 3
coding variants atCYP3A43 of varying minor allele
fre-quencies (MAFs) with simulated genotype–medication
response interactions. We then used TPP to evaluate the
power to detect simulated main effects at MAP4 (the
simulated single nucleotide polymorphisms, SNPs, with the largest proportion of variance explained in SBP, MAF 2.7 %) using a 2DF test in each approach. Lastly, we assessed the observed FPPs of each approach across the odd-numbered chromosomes without simulated ef-fect using both 1DF and 2DF tests using publicly avail-able software.
Methods
Type 2 Diabetes Genetic Exploration by Next-generation sequencing in Ethnic Samples (T2D-GENES) Consor-tium Project [21] genotypic and GAW19 simulated phenotypic data have been described separately [20]. The GAW19 genotypic dosage data come from whole genome sequence variants for 20 extended Mexican American fam-ilies collected as part of the San Antonio Family Studies. Imputation for missing SNP genotypes in pedigrees was conducted using a likelihood-based method implemented in MERLIN, based on the framework of available high-density genome-wide SNP data [22]. The GAW19 con-veners simulated 200 replicates of phenotypic data based on the observed longitudinal data in the family-based sam-ple. These data included 3 predicted deleterious coding
variants inCYP3A43with simulated gene–medication
in-teractions in the absence of genetic main effects. We were aware that carriers of these risk variants were assigned to be nonresponsive to the simulated BP treatment effect on
SBP of−6.2 mm Hg (βInt= 6.2 mm Hg). Additionally there
were 984 SNPs with simulated genetic main effects for SBP explaining between less than 0.1 % and 2.78 % of the phenotypic variance.
Accounting for family relatedness and population structure
We accounted for family relatedness using linear mixed models using a Comprehensive Mixed Model Program for Analysis of Pedigree and Population Data (MMAP) [23, 24]. To account for population structure, we applied principal component (PC) analysis to the observed geno-typic data [21]. PCs were initially calculated in unrelated
founders(n= 117) and a subset of 28,156 SNPs were
se-lected for uniform coverage and low mutual linkage
dis-equilibrium (r2≤0.2). PCs were assigned to all other
individuals (n= 959) using estimated PCs from founders
and the predict function in R to compute each
individ-ual’s PC scores based on the individual’s genotypes
(www.R-project.org). We included the top 5 PCs in all association analyses [25].
Gene–environment interaction analyses
Our analysis evaluated simulated SBP at the last time point (t = 3), when both the prevalence of hypertension and use of antihypertensive medications were the highest [1]. We assessed the appropriateness of model-based SEs by examining the heterogeneity of residuals by medica-tion status using a likelihood ratio test to compare the homogeneity model with the heterogeneity model, and based on these results, our models allowed the residual
error term to differ by medication status (p ≥0.05). All
characteristics of true-positive findings were investigated
at the 3 SNPs inCYP3A43with simulated gene–medication
effects (1DF and 2DF tests), and the only SNP in MAP4
with a simulated genetic main effect (2.87 % variation in
SBP, chr3: 48040283, −9.91 mm Hg per minor allele) and
greater than 80 % estimated power using a 2DF test. The FPP was calculated for the odd-numbered chromosomes
using SNPs beyond 500 kb of the simulated effects (gene–
medication effects for the 1DF tests, or simulated main and interaction genetic effects for the 2DF joint tests). Both true and false positives were considered statistically significant
using apvalue criterion of less than 0.05. Based on the
sim-ulated prevalence of medication status and SBP distribu-tion, we estimated the expected TPP using an approximate
effective sample size of 80 % of the total sample(n= 849),
to account for the nonindependence of relative pairs. Power analyses were conducted using Quanto [26].
“Interaction model”
The interaction between the simulated genotypes and BP medication status on SBP at t = 3 (equation 1) was modeled to calculate the estimated interaction effect,
model-based SEs, and p values using MMAP [23]. The
1DF and 2DF joint tests (shown below) for this method have been described by Manning et al. [18].
Model 1
SBPt¼3 ¼ α þ β
SNPXSNP þ βMedXMed þ βIntXInt
þ βCXCþ g þ e
Where XInt= 1 when both XSNPand XMedare nonzero,
C represents adjustments for covariates (age, sex, PCs),
g~N(σa2R) is a polygenic random effect to account for
familial correlation through a relationship matrix, ande
~N(σe2I) is the error term. The null hypotheses for X1DF
Medication-stratified,“med-diff”approach
To apply the med-diff approach to BP medication–stratified
results (Models 2a, b), we modeled the genetic main effect within strata of BP medication status using MMAP [23]. Then the Spearman rank correlation coefficient between
strata for all SNPs (r, range across replicates and
chromo-somes: −0.13 to 0.16), magnitude, SE, and p value of the
difference were estimated using EasyStrata [27]. The 1DF and the 2DF joint tests (shown below) have been described by Randall et al. [19] and Aschard et al. [28].
Model 2a
Where C represents adjustments for covariates (age,
sex, PCs), and g and e are as in Model 1. The null
hy-The average age was 48.1 years (58 % female) with the youngest and oldest participants across all replicates be-ing 18 and 101 years old, respectively. The mean preva-lence of BP medication use at the last simulated time point was 32.7 % (range across replicates: 30.2 to 36.4 %). The average change in SBP in individuals who initiated BP medication between the first and last time
points was −6.9 mm Hg. The average odd-numbered
chromosome-wide convergence was higher for the inter-action model than for the med-diff approach (1DF: 8.0 × 10⁶vs. 7.0 × 10⁶’, 2DF: 6.5 × 10⁶vs. 5.7 × 10⁶).
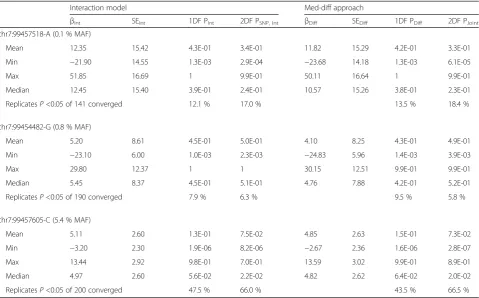
CYP3A43true-positive gene–medication effects (1DF)
At the 3 SNPs at this locus the same replicates
con-verged in both G × E approaches (Table 1).
Nonconver-gence, caused by multicollinearity between the SNP and interaction terms or the small stratified-sample size, in-creased as MAF dein-creased for both approaches. The es-timated interaction effects were slightly larger on
average for the interaction model (difference 0.26–
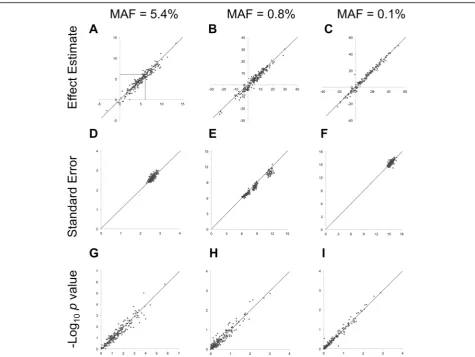
1.10 mm Hg) compared to the med-diff approach (Table 1). Both approaches produced estimated effects that varied across replicates, with the least-common
SNP (Fig. 1a–c) showing the most variability in effect
6.2 mm Hg, the med-diff approach estimated this ef-fect more conservatively on average than the inter-action model, which resulted in less bias using the med-diff approach for the rarest of the 3 SNPs (MAF 0.1 %, Table 1) and more bias for the other 2 SNPs (MAF 0.8 % and 5.4 %). As would be expected, the estimated mean SE decreased as the SNP became
more common (Fig. 1d–f ). Yet at the least-common
SNP with the poorest model convergence (MAF 0.1 %), the interaction and med-diff SE estimates were less variable than another more frequent SNP at the same locus (0.8 %, Table 1). Estimates of the 1DF and
2DF p values between the 2 approaches were
compar-able (Tcompar-able 1, Fig. 1g–i). The TPPs identified using
1DF or 2DF tests were higher for the med-diff ap-proach when the SNPs were less than 1 % MAF, but higher or equivalent for the interaction model when the SNP was common (MAF 5.4 %). The observed TPPs were not statistically significantly different from
what we had estimated prior to the study (p ≥0.2)
with the exception of the least-common SNP (p
<0.02), which also did not converge for 30 % of the replicates (59 of 200 replicates).
MAP4true-positive main genetic effects (2DF)
At chromosome (chr) 3:48040283, the main genetic effect was overestimated by both the interaction model
(−13.1 mm Hg) and the med-diff stratified analysis of
nonmedicated individuals (−13.3 mm Hg), whereas the
med-diff analysis of medicated individuals
underesti-mated the effect (−7.8 mm Hg). The 2DF jointpvalues
were comparable between the 2 approaches with TPPs
of 100 %(n= 156).
False-positive proportions (1DF, 2DF)
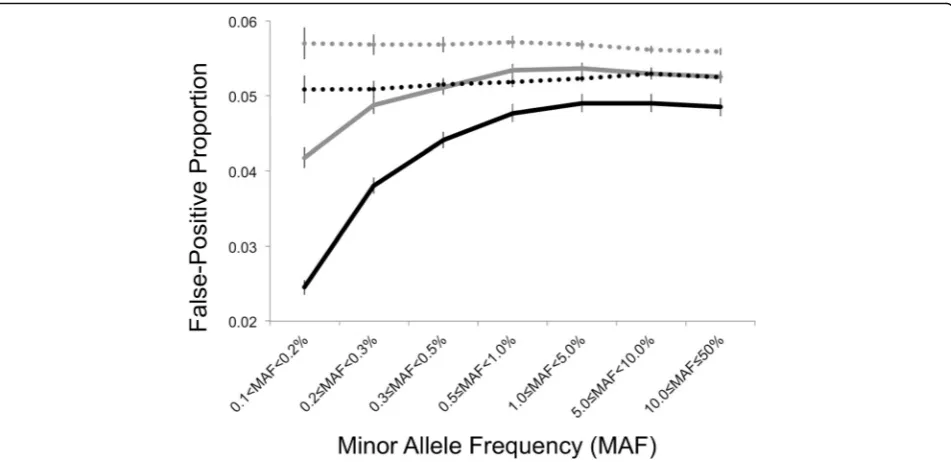
As shown in Fig. 2, the interaction model produced de-flated FPPs in both the 1DF and 2DF tests, which approached 5 % across bins of increasing MAF. In con-trast the med-diff approach produced stable FPPs across bins of MAF for both 1DF and 2DF tests. Both models produced higher FPPs for 2DF tests as compared to 1DF tests.
Discussion
Randall et al. [19] have argued that 1DF tests, such as the interaction model and the med-diff approach, are
particularly useful for informing public health
Table 1Power to detect true-positive gene–medication interactions atCYP3A43using 2 approaches. Gene–medication interactions (200 replicates) were simulated to be 6.2 mm Hg at 3 single nucleotide polymorphisms (SNPs) representing a range of minor allele frequencies (MAFs) (0.1 to 5.4 %)
Interaction model Med-diff approach
βInt SEInt 1DF PInt 2DF PSNP, Int βDiff SEDiff 1DF PDiff 2DF PJoint
chr7:99457518-A (0.1 % MAF)
Mean 12.35 15.42 4.3E-01 3.4E-01 11.82 15.29 4.2E-01 3.3E-01
Min −21.90 14.55 1.3E-03 2.9E-04 −23.68 14.18 1.3E-03 6.1E-05
Max 51.85 16.69 1 9.9E-01 50.11 16.64 1 9.9E-01
Median 12.45 15.40 3.9E-01 2.4E-01 10.57 15.26 3.8E-01 2.3E-01
ReplicatesP<0.05 of 141 converged 12.1 % 17.0 % 13.5 % 18.4 %
chr7:99454482-G (0.8 % MAF)
Mean 5.20 8.61 4.5E-01 5.0E-01 4.10 8.25 4.3E-01 4.9E-01
Min −23.10 6.00 1.0E-03 2.3E-03 −24.83 5.96 1.4E-03 3.9E-03
Max 29.80 12.37 1 1 30.15 12.51 9.9E-01 9.9E-01
Median 5.45 8.37 4.5E-01 5.1E-01 4.76 7.88 4.2E-01 5.2E-01
ReplicatesP<0.05 of 190 converged 7.9 % 6.3 % 9.5 % 5.8 %
chr7:99457605-C (5.4 % MAF)
Mean 5.11 2.60 1.3E-01 7.5E-02 4.85 2.63 1.5E-01 7.3E-02
Min −3.20 2.30 1.9E-06 8.2E-06 −2.67 2.36 1.6E-06 2.8E-07
Max 13.44 2.92 9.8E-01 7.0E-01 13.59 3.02 9.9E-01 8.9E-01
Median 4.97 2.60 5.6E-02 2.2E-02 4.82 2.62 6.4E-02 2.0E-02
ReplicatesP<0.05 of 200 converged 47.5 % 66.0 % 43.5 % 66.5 %
interventions by highlighting the nature by which the environment may attenuate or exacerbate genetic predis-position to disease susceptibility. Our preliminary results thus far indicate that these 2 G × E approaches have not-able differences with respect to the interaction effect simulated herein. The interaction model may be better at detecting true positive interactions than the med-diff approach for common SNPs, but the med-diff approach may estimate interaction effects more conservatively (i.e. closer to the null) and with less variability at rare SNPs (MAF <1 %). However, it is unclear how nonconver-gence may be influencing these results.
The simulated GAW19 data set used in this analysis did not contain any simulated interaction effects at loci with simulated main genetic effects. Thus, using the simulated GAW19 data we were unable to validate a true positive with both main and interaction effects for either approach (2DF test), which may limit the generalizability of our findings. We were however able to compare our ability to detect a strong main effect at
MAP4using a 2DF joint test of main and interaction
ef-fects. Even though we expect that a 1DF test of the main genetic effect would be a more powerful approach than a
2DF test when there is a true genetic main effect, this“true
positive”assessment may represent a real world application
of a 2DF test, wherein the investigator has no knowledge of the underlying true effects and may be interested in asses-sing the influence of potential interactions on established genetic loci. Furthermore, unlike the med-diff approach 1DF test implementation, the published 2DF test imple-mented in publicly available software does not account for the potential for correlation between strata due to related-ness. It is unclear how this may bias the observed 2DF re-sults and methods comparisons made herein. Future work warrants a more thorough investigation of these approaches in family-based and unrelated data sets to detect associa-tions at loci with both true main and interaction effects.
Based on our findings, the use of these G × E ap-proaches on SNPs with less than 1 % MAF may lead to unstable TPPs and FPPs. First, nonconvergence may
Fig. 1Comparison of the estimated effects (a–c), standard errors (d–f), and -log10of the 1DFpvalues (g–i) on SBP from the interaction model
(x-axis) and med-diff (y-axis) approaches in up to 200 replicates of simulated gene–medication interactions at 3 SNPs atCYP3A43(6.2 mm Hg,
plague the most moderate samplings of the data, allow-ing the SEs to appear smaller than they really are and TPPs higher than expected, as we had observed for the
least commonCYP3A43SNP (MAF 0.1 %). At the SNPs
examined atCYP3A43andMAP4 we observed identical
convergence between the 2 approaches. Yet we observed lower odd-numbered chromosome-wide convergence for the med-diff approach than the interaction model, be-cause all medication-stratified models must have con-verged in order to apply the med-diff approach. Second, we observed FPPs for the interaction model less than ex-pected (5 %) for both 1DF and 2DF tests, which was not the case for the med-diff approach. An analytic focus on
low-frequency SNPs (MAF 1–5 %) or common SNPs
(MAF >5 %) may minimize the observed difference in the FPPs between the 2 approaches.
Conclusions
In this specific simulated example of gene-medication interactions in family-based data the med-diff approach exhibited greater power to detect interaction effects for low-frequency variants (MAF <1 %), whereas the inter-action model exhibited greater power for common
al-leles (MAF >5 %). However, the med-diff method
resulted in a stable but greater FPP for low-frequency variants as compared to the interaction method. In sum-mary, both approaches are robust for common variants (MAF >5 %), but become less concordant as MAF de-creases. One of the benefits of the stratified analysis of
the med-diff approach is that it is less computationally intensive, but may not be appropriate for continuous en-vironmental factors. This indicates that model selection may in part be context-specific. Furthermore if rare vari-ation is of interest in future investigvari-ations, our findings here suggest that the med-diff approach may estimate true interaction effects more robustly, with less variabil-ity, and with stable FPPs around 5 % as expected; how-ever, if common variants are the focus, the interaction model may be more robust.
Future investigations should consider different types of simulated interactions, for example, where genetic ef-fects are in opposite directions in the 2 environmental strata or where genetic effects differ in magnitude be-tween strata (ie, when both interaction and main effects are present). This current study used the GAW19 simu-lated family-based data to fill a gap in the G × E
litera-ture and make quantitative comparisons directly
relevant to model choice in future effect estimation (TPP) and discovery (FPP) studies in the field of genetic epidemiology.
Acknowledgements
We would like to thank Thomas W. Winkler for his help implementing the analysis in EasyStrata and his review of the manuscript.
Declarations
The T2D-GENES Consortium Project is supported by National Institutes of Health grants U01 DK085524, U01 DK085501, U01 DK085526, U01 DK085584, and U01 DK085545. The San Antonio Family Studies are supported by P01 HL045222, R01 DK047482, and R01 DK053889. This work is funded in part Fig. 2Comparison of the false-positive proportions (FPPs) and 95 % confidence intervals for the interaction model (solid line) and med-diff approaches (dashed line) and 200 replicates of true negative findings on the odd-numbered chromosomes using the 1DF (gray) and 2DF tests
(black) across bins of minor allele frequency (>0.1 to 50 %). Note: False-positive proportions were calculated after excluding SNPs at theCYP3A43
through NIH grants U01 HL084756, 2 T32 HL007055-36, and the AHA Pre-/
Post-doctoral Fellowships. This article has been published as part ofBMC
ProceedingsVolume 10 Supplement 7, 2016: Genetic Analysis Workshop 19:
Sequence, Blood Pressure and Expression Data. Summary articles. The full contents of the supplement are available online at http://bmcproc.biomed-central.com/articles/supplements/volume-10-supplement-7. Publication of the proceedings of Genetic Analysis Workshop 19 was supported by National Institutes of Health grant R01 GM031575.
Availability data and materials
The data was available as part of participation in the GAW19 workshop [20].
Authors’contributions
LFR participated in this study’s design and coordination, and in statistical
analyses, assembling, and drafting the manuscript. CJH assisted in statistical analyses, assembling, and drafting the manuscript. MG, AGH, AAS, and AEJ assisted in statistical analyses and drafting the manuscript. SML, JRO, and KEN assisted in design of the study and drafting the manuscript. CLA, GC, NF, VSV, and KLY assisted in drafting the manuscript. AEJ conceived of the study and participated in its design. All authors read and approved the final manuscript.
Competing interests
The authors declare that they have no competing interests.
Author details
1Department of Epidemiology, University of North Carolina at Chapel Hill,
Chapel Hill, NC 27514, USA.2Department of Biostatistics, University of North Carolina at Chapel Hill, Chapel Hill, NC 27514, USA.3Department of Nutrition, and UNC Nutrition Research Institute, University of North Carolina, Kannapolis, NC 28081, USA.4School of Medicine, University of Maryland, Baltimore, MD 21201, USA.
Published: 18 October 2016
References
1. Centers for Disease Control and Prevention (CDC). Vital signs: awareness
and treatment of uncontrolled hypertension among adults—United States,
2003–2010. MMWR Morb Mortal Wkly Rep. 2012;61:703–9.
2. Gu Q, Burt VL, Dillon CF, Yoon S. Trends in antihypertensive medication use
and blood pressure control among United States adults with hypertension: the National Health And Nutrition Examination Survey, 2001 to 2010.
Circulation. 2012;126(17):2105–14.
3. Konoshita T, Genomic Disease Outcome Consortium (G-DOC) Study
Investigators. Do genetic variants of the renin-angiotensin system predict blood pressure response to renin-angiotensin system-blocking drugs?: a systematic review of pharmacogenomics in the renin-angiotensin system.
Curr Hypertens Rep. 2011;13(5):356–61.
4. Suonsyrja T, Donner K, Hannila-Handelberg T, Fodstad H, Kontula K,
Hiltunen TP. Common genetic variation of beta1- and beta2-adrenergic receptor and response to four classes of antihypertensive treatment.
Pharmacogenet Genomics. 2010;20(5):342–5.
5. Franceschini N, Fox E, Zhang Z, Edwards TL, Nalls MA, Sung YJ, Tayo BO,
Sun YV, Gottesman O, Adeyemo A, et al. Genome-wide association analysis of blood-pressure traits in African-ancestry individuals reveals common associated genes in African and non-African populations. Am J Hum Genet.
2013;93(3):545–54.
6. He J, Kelly TN, Zhao Q, Li H, Huang J, Wang L, Jaquish CE, Sung YJ, Shimmin
LC, Lu F, et al. Genome-wide association study identifies 8 novel loci associated with blood pressure responses to interventions in Han Chinese.
Circ Cardiovasc Genet. 2013;6(6):598–607.
7. Hottenga JJ, Boomsma DI, Kupper N, Posthuma D, Snieder H, Willemsen G,
de Geus EJ. Heritability and stability of resting blood pressure. Twin Res
Hum Genet. 2005;8(5):499–508.
8. International Consortium for Blood Pressure Genome-Wide Association
Studies, Ehret GB, Munroe PB, Rice KM, Bochud M, Johnson AD, Chasman DI, Smith AV, Tobin MD, Verwoert GC, et al. Genetic variants in novel pathways influence blood pressure and cardiovascular disease risk. Nature.
2011;478(7367):103–9.
9. Kato N, Takeuchi F, Tabara Y, Kelly TN, Go MJ, Sim X, Tay WT, Chen CH,
Zhang Y, Yamamoto K, et al. Meta-analysis of genome-wide association
studies identifies common variants associated with blood pressure variation
in East Asians. Nat Genet. 2011;43(6):531–8.
10. Kraja AT, Vaidya D, Pankow JS, Goodarzi MO, Assimes TL, Kullo IJ, Sovio U,
Mathias RA, Sun YV, Franceschini N, et al. A bivariate genome-wide approach to metabolic syndrome: STAMPEED consortium. Diabetes. 2011; 60(4):1329–39.
11. Levy D, Ehret GB, Rice K, Verwoert GC, Launer LJ, Dehghan A, Glazer NL,
Morrison AC, Johnson AD, Aspelund T, et al. Genome-wide association
study of blood pressure and hypertension. Nat Genet. 2009;41(6):677–87.
12. Newton-Cheh C, Johnson T, Gateva V, Tobin MD, Bochud M, Coin L, Najjar
SS, Zhao JH, Heath SC, Eyheramendy S, et al. Genome-wide association study identifies eight loci associated with blood pressure. Nat Genet. 2009; 41(6):666–76.
13. Tragante V, Barnes MR, Ganesh SK, Lanktree MB, Guo W, Franceschini N,
Smith EN, Johnson T, Holmes MV, Padmanabhan S, et al. Gene-centric meta-analysis in 87,736 individuals of European ancestry identifies multiple
blood-pressure-related loci. Am J Hum Genet. 2014;94(3):349–60.
14. Wain LV, Verwoert GC, O’Reilly PF, Shi G, Johnson T, Johnson AD, Bochud M,
Rice KM, Henneman P, Smith AV, et al. Genome-wide association study identifies six new loci influencing pulse pressure and mean arterial pressure.
Nat Genet. 2011;43(10):1005–11.
15. Rutherford S, Cai G, Lopez-Alvarenga JC, Kent JW, Voruganti VS, Proffitt JM,
Curran JE, Johnson MP, Dyer TD, Jowett JB, et al. A chromosome 11q quantitative-trait locus influences change of blood-pressure measurements over time in Mexican Americans of the San Antonio Family Heart Study. Am
J Hum Genet. 2007;81(4):744–55.
16. Lee JW, Aminkeng F, Bhavsar AP, Shaw K, Carleton BC, Hayden MR, Ross CJ.
The emerging era of pharmacogenomics: current successes, future
potential, and challenges. Clin Genet. 2014;86(1):21–8.
17. Weitzel KW, Elsey AR, Langaee TY, Burkley B, Nessl DR, Obeng AO, Staley BJ,
Dong HJ, Allan RW, Liu JF, et al. Clinical pharmacogenetics implementation: approaches, successes, and challenges. Am J Med Genet C: Semin Med
Genet. 2014;166C(1):56–67.
18. Manning AK, LaValley M, Liu CT, Rice K, An P, Liu Y, Miljkovic I,
Rasmussen-Torvik L, Harris TB, Province MA, et al. Meta-analysis of gene-environment interaction: joint estimation of SNP and SNP x environment regression
coefficients. Genet Epidemiol. 2011;35(1):11–8.
19. Randall JC, Winkler TW, Kutalik Z, Berndt SI, Jackson AU, Monda KL,
Kilpeläinen TO, Esko T, Mägi R, Li S, et al. Sex-stratified genome-wide association studies including 270,000 individuals show sexual dimorphism in genetic loci for anthropometric traits. PLoS Genet. 2013;9(6):e1003500.
20. Blangero J, Teslovich TM, Sim X, Almeida MA, Jun G, Dyer TD, Johnson M,
Peralta JM, Manning AK, Wood AR, et al. Omics squared: human genomic, transcriptomic, and phenotypic data for Genetic Analysis Workshop 19. BMC Proc. 2015;9 Suppl 8:S2.
21. Almasy L, Dyer TD, Peralta JM, Jun G, Wood AR, Fuchsberger C, Almeida
MA, Kent Jr JW, Fowler S, Blackwell TW, et al. T2D-GENES Consortium: Data for Genetic Analysis Workshop 18: human whole genome sequence, blood pressure, and simulated phenotypes in extended pedigrees. BMC Proc. 2014;8 Suppl 1:S2.
22. Abecasis GR, Cherny SS, Cookson WO, Cardon LR. Merlin—rapid analysis of dense
genetic maps using sparse gene flow trees. Nat Genet. 2002;30(1):97–101.
23. O’Connell JR. MMAP: A Comprehensive Mixed Model Program for Analysis
of Pedigree and Population Data. Boston: American Society of Human Genetics; 2013.
24. O’Connell JR. MMAP User Guide. Baltimore: University of Maryland; 2014.
25. Price AL, Patterson NJ, Plenge RM, Weinblatt ME, Shadick NA, Reich D.
Principal components analysis corrects for stratification in genome-wide
association studies. Nat Genet. 2006;38(8):904–9.
26. Kelly TN, Takeuchi F, Tabara Y, Edwards TL, Kim YJ, Chen P, Li H, Wu Y, Yang
CF, Zhang Y, et al. Genome-wide association study meta-analysis reveals transethnic replication of mean arterial and pulse pressure loci.
Hypertension. 2013;62(5):853–9.
27. Winkler TW. EasyStrata: Evaluation of Stratified Genome-Wide Association
Meta-Analysis Results. 2014. http://cran.r-project.org/web/packages/ EasyStrata/index.html.
28. Aschard H, Hancock DB, London SJ, Kraft P. Genome-wide meta-analysis of
joint tests for genetic and gene-environment interaction effects. Hum