University of South Carolina
Scholar Commons
Theses and Dissertations
12-14-2015
Viruses and Metals in Ocean Food Webs:
Top-Down and Bottom-Up Effects of Marine Viruses
and Trace Elements on Marine Picophytoplankton
Brady Robert Cunningham University of South Carolina - Columbia
Follow this and additional works at:https://scholarcommons.sc.edu/etd Part of theMarine Biology Commons
This Open Access Dissertation is brought to you by Scholar Commons. It has been accepted for inclusion in Theses and Dissertations by an authorized administrator of Scholar Commons. For more information, please [email protected].
Recommended Citation
Cunningham, B. R.(2015).Viruses and Metals in Ocean Food Webs: Top-Down and Bottom-Up Effects of Marine Viruses and Trace
V
IRUSES ANDM
ETALS INO
CEANF
OODW
EBS:
T
OP-
DOWN AND BOTTOM-
UP EFFECTS OF MARINE VIRUSES AND TRACE ELEMENTS ON MARINEPICOPHYTOPLANKTON
by
Brady Robert Cunningham Bachelor of Science University of Maryland, 2011
Submitted in Partial Fulfillment of the Requirements For the Degree of Doctor of Philosophy in
Marine Science College of Arts and Sciences University of South Carolina
2015 Accepted by:
Seth John, Co-Major Professor Tammi Richardson, Co-Major Professor Ryan Rykaczewski, Committee Member Matthew Sullivan, Committee Member
D
EDICATION“Sentiment without action is the ruin of the soul.” -Edward Abbey
A
CKNOWLEDGEMENTSA
BSTRACTnutrients and trace elements when picophytoplankton are grown under varying conditions. Determining internal cellular concentrations are important when attempting to understand what nutrients are absorbed and then released by the host during viral infection and lysis. We find that Fe-limitation of cyanobacteria cells elicits a similar response to that of P-limitation, causing an overall decrease in cellular P concentration under both conditions. Overall, this dissertation provides a more complete understanding of differences in viral and cellular production of Fe-limited hosts and suggests a possible role for Fe in the efficiency of the marine microbial loop, carbon, and nitrogen cycle.
T
ABLE OFC
ONTENTSDEDICATION ... iii
ACKNOWLEDGEMENTS ... iv
ABSTRACT ...v
LIST OF TABLES ... ix
LIST OF FIGURES ...x
CHAPTER 1:INTRODUCTION ...1
1.1: BOTTOM-UP CONTROL:TRACE ELEMENT LIMITATION OF CELLS ...2
1.2:TOP-DOWN CONTROL:VIRAL PREDATION AND INFECTION ...4
1.3:BOTTOM-UP AND TOP-DOWN EFFECTS ...6
CHAPTER 2:AN INEXPENSIVE, ACCURATE AND PRECISE WET-MOUNT METHOD FOR ENUMERATING AQUATIC VIRUSES ...11
2.1: ABSTRACT ...12
2.2:INTRODUCTION ...13
2.3:MATERIALS AND METHODS ...14
2.4:RESULTS AND DISCUSSION ...18
2.5:CONCLUSION ...22
CHAPTER 3: PHAGE GROWTH KINETICS OF 3 CYANOPHAGES PROPAGATED ON FE-LIMITED HOST SYNECHOCOCCUS WH7803 ... 31
3.1: ABSTRACT ...31
3.4:RESULTS AND DISCUSSION ...38
3.5:CONCLUSION ...41
CHAPTER 4:CHANGES IN ELEMENTAL STOICHIOMETRY OF PICOPHYTOPLANKTON GROWN UNDER FE-LIMITATION AND INFECTION ...44
4.1: ABSTRACT ...44
4.2:INTRODUCTION ...45
4.3:MATERIALS AND METHODS ...49
4.4:RESULTS AND DISCUSSION ...54
4.5:CONCLUSION ...66
CHAPTER 5:CONCLUSIONS AND CLIMATE CHANGE ...81
5.1:FE-LIMITATION DURING CLIMATE CHANGE ...81
5.2:CLIMATE CHANGE AND VIRAL INFECTION OF FE-LIMITED CYANOBACTERIA ...84
5.3:CLIMATE CHANGE AND EXTENDED ELEMENTAL STOICHIOMETRY OF FE-LIMITED PICOPHYTOPLANKTON ...85
5.4:FUTURE DIRECTIONS ...86
REFERENCES ...88
L
IST OFT
ABLESTable 2.1 Reagent preparation for wet-mount virus enumeration protocol ...23
Table 2.2 Wet-mount protocol for virus enumeration ...24
Table 2.3 Description of samples used for comparison of the wet-mount and filter-mount virus enumeration methods ...25
Table 3.1 Physiological measurements of host and phage production ...42
Table 4.1 Average growth rates of picophytoplankton cells ...67
Table 4.2 Comparison of the combined average elemental stoichiometry ...68
Table 4.3 Comparison of the average elemental stoichiometry for each species ...69
L
IST OFF
IGURESFigure 1.1 The biological pump in the subtropical open ocean ...10
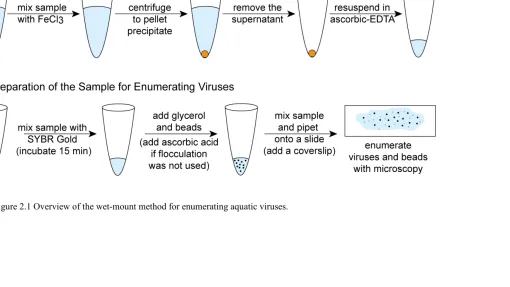
Figure 2.1 Overview of the wet-mount method for enumeration of aquatic viruses ...27
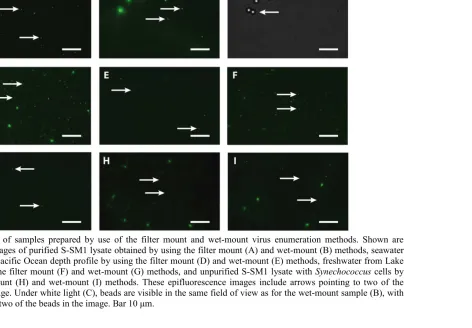
Figure 2.2 Images of samples prepared using the filter-mount and wet-mount virus enumeration methods ...28
Figure 2.3 Viral concentrations from natural samples and lysates obtained using the filter-mount and wet-mount enumeration methods ...29
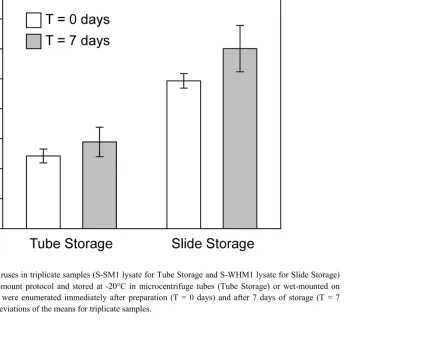
Figure 2.4 Storage of samples prepared using the wet-mount method ...30
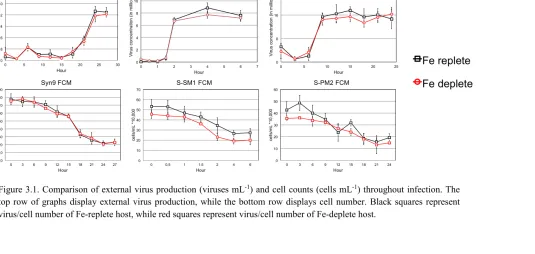
Figure 3.1 Comparison of external virus production and cell counts ...43
Figure 4.1 Average cellular P concentration between species ...71
Figure 4.2 Comparison of average elemental quotas ...72
Figure 4.3 Average cellular Fe concentration between species ...73
Figure 4.4 Comparison of flow cytometry data between species ...74
Figure 4.5 Comparison of average elemental quotas of metal cofactors per species ...75
Figure 4.6 Average growth rate of WH7803 post-infection ...76
Figure 4.7 Change in WH7803 cellular P concentration post-infection ...77
Figure 4.8 Changes in average elemental quotas of alkaline phosphatase cofactors post-infection ...78
Figure 4.9 Changes in the average elemental quotas of macronutrients post-infection ....79
CHAPTER
1
I
NTRODUCTIONMarine microbes are some of the major contributors to carbon fixation and biogeochemical cycling in the ocean. Two of the main groups of microbes, marine phytoplankton and viruses, are important due to their high abundance and combined effects on nutrient cycling and flux through the microbial loop and biological pump (Fuhrman 1999; Suttle 2005). Within the microbial loop, nutrients are cycled as heterotrophic bacteria take up dissolved organic matter (DOM) and then the bacteria become prey for grazers and viruses, leading to DOM release continuing the microbial loop (Figure 1.1) (Azam 1998). However, the microbial loop is not a closed system. The loop is part of a much larger system, the biological pump.
The biological pump is the biologically driven portion of the oceanic carbon cycle. Within the pump, phytoplankton take up CO2 during the photosynthesis process,
fixing the CO2 and turning it into organic matter (Figure 1.1). In fact, phytoplankton are
and pelagic (open-ocean) zones and are comprised of both prokaryotes and eukaryotes. Also, due to the small size of picophytoplankton, these cells also tend to have a competitive advantage in low nutrient regions, like open ocean environments. Picophytoplankton have a larger surface area to volume ratio compared to bigger phytoplankton cells. This difference provides a growth advantage since picophytoplankton take up less nutrients per cell compared to their larger counterparts (Azam et al. 1983; Chisholm and Morel 1991; Chisholm 1992; Azam 1998; Maranon et al. 2001). In this dissertation, I focus on the biological and chemical interactions between picophytoplankton, viruses, and trace nutrients in the subtropical open ocean environment. This environment is primarily inhabited by two broad categories of picophytoplankton, the cyanobacteria (Synechococcus and Prochlorococcus) and the picoeukaryotes (e.g. Ostreococcus).
1.1BOTTOM-UP CONTROL: TRACE ELEMENT LIMITATION OF CELLS
nutrient limitation of phytoplankton. Initial nutrient limitation studies focused primarily on macronutrient limitation. Studies show that the macronutrients nitrogen and phosphorus can typically be limiting factors in marine and freshwater systems (Tilman et al. 1982; Hecky and Kilham 1988). However, researchers have identified ocean regions with high levels of macronutrients, but still observe slow growing phytoplankton cells.
(Martin et al. 1994; Coale et al. 1996; Scharek et al. 1997; Boyd et al. 2000, 2007; Maldonado et al. 2001).
Fe is not the only important micronutrient for phytoplankton growth. Researchers have found that certain trace elements exhibit similar ocean depth profiles to that of macronutrient depth profiles. A typical nutrient depth profile relates element concentration to ocean depth. In the surface waters, if an element is used for cellular growth, concentrations are extremely low due to biological uptake. As depth increases and concentrations rates of primary production decreases, elemental concentrations increase and stay constant throughout deep water due to remineralization and lack of biological uptake (Boyle et al., 1976). The pattern of these trace element depth profiles shows that some trace elements can be used as nutrients for phytoplankton.
In this dissertation, I focus solely on the effects of Fe-limitation on picophytoplankton. I cultured two strains of cyanobacteria (Synechococcus WH7803 and
Prochlorococcus MED4) and one picoeukaryote strain (Ostreococcus lucimarinus). Over
the course of my experiments, I decreased the growth rates of the cultured picophytoplankton by lowering the concentration of Fe 100-fold in each metal-buffered media. Overall, the growth rates in the Fe-deplete medias declined on average by 50% compared to the nutrient-replete medias.
1.2 TOP-DOWN CONTROL: VIRAL PREDATION AND INFECTION
and nutrient cycling (Bergh et al. 1989; Proctor and Fuhrman 1990; Suttle and Chan 1994). One of the first studies of viral-phytoplankton interaction observed the effects of viral infection on the coccolithophore, Emiliania huxleyi (Bratbak et al. 1993). This study intended to investigate the effects of dissolved nutrient composition on phytoplankton dynamics. They found that viruses were responsible for 25-100% of the net mortality of
Emiliania huxleyi during algal bloom decline under nutrient-replete or N-limited
conditions. However, under P-limited conditions, they observed limited viral production throughout the decline of the algal bloom. Interestingly, this information led the researchers to propose that viruses play an important “side-in” role in phytoplankton bloom termination. In ecology, a “side-in” role is considered to be a counterpart to the “top-down” control that grazers impart on phytoplankton communities (Bratbak et al. 1993). This study posits that viruses only have partial influence on phytoplankton growth and decline, while grazers are the main phytoplankton population control. However, more recently, researchers have determined that viruses, much like zooplankton, actually have a top-down effect on phytoplankton communities (Bouvy et al. 2004, 2011; Deng et al. 2013). The viral predation effect creates a “viral shunt” that interrupts energy flow from phytoplankton to grazers and higher trophic levels. This shunt releases nutrients back into the surrounding media via viral lysis, stimulating the microbial loop (Wilhelm and Suttle 1999). Overall, this shows that viruses have a similar influence on phytoplankton growth and biogeochemical cycling when compared to grazing.
enumeration of viruses in aquatic samples was accomplished by using transmission electron microscopy (Bergh et al. 1989). This piece of equipment was too large to bring on research cruises and therefore virus samples could not be immediately determined while in the field. Since then, methods have been developed using epifluorescence microscopy (Suttle and Fuhrman 2010) and flow cytometry making viral enumeration much simpler (Brussaard et al. 2010). While each of the above methods requires the use of relatively expensive laboratory equipment, the per-sample cost for the widely used filter-mount epifluorescence microscopy method has recently increased dramatically. To address this, chapter 2 of this dissertation describes a new, less costly ‘wet-mount’ epifluorescence microscopy method to enumerate aquatic viruses. Briefly, fluorescently stained samples are combined with a known concentration of silica microsphere beads and then wet-mounted directly onto a slide. Determination of viral concentration is based on the relative abundance of viruses and silica beads in the sample. This method was used throughout this dissertation to determine total marine virus concentration during each project.
1.3 BOTTOM-UP AND TOP-DOWN EFFECTS
1996). Further examination of these systems reveals that there are specific host and virus genes relating to host phosphate acquisition. In this study, researchers found up-regulation of phosphate-binding protein gene (pstS) and alkaline phosphatase gene (phoA) in the host when viruses infected P starved cyanobacteria hosts compared to P-replete control hosts. This is the first finding to show regulation of genes by viral infection during host nutrient limitation (Zeng and Chisholm 2012). Aside from prokaryotes, studies of marine eukaryotic phytoplankton have also shown similar reduction in viral production under P-limitation. Under various conditions, P-limitation of hosts seems to reduce viral burst size and increase viral latency period (Bratbak et al. 1993, 1998; Maat et al. 2014). However, there was no observed difference in viral growth kinetics when an eukaryotic host was grown in the absence of metals Zn, Cd, or Co. Interestingly, the addition of Cu did reduce viral burst size and latency period, but this may be a result of Cu toxicity impacting host cellular functions, most likely leading to lower viral production (Gledhill et al. 2012). These few, but important, results from viral infection studies in nutrient-limited systems indicate that nutrient limitation plays an important role in the viral infection of host phytoplankton cells. This information may further illustrate how carbon is cycled in HNLC regions and shed light on the impacts which phytoplankton have on local and global processes including the subtropical open ocean biological pump.
Chisholm 2012). This up-regulation in acquisition genes could alter cellular elemental composition. However, I am currently unaware of any prior studies that have directly evaluated the changes in cellular elemental concentration during viral infection. Therefore, I predicted that viral infection of a Fe-limited host would cause an increase in P cellular concentration since the host is already Fe-limited but still needs an ample supply of P to produce viral particles.
* * *
This dissertation examines the effects of viruses and trace elements on picophytoplankton cells. I measure phytoplankton physiological data using flow cytometry and fluorometry, viral growth kinetics and concentration using qPCR and the wet-mount method, and internal cellular elemental composition using mass spectrometry on laboratory cultures of
Synechococcus, Prochlorococcus, and Ostreococcus. This combination of approaches
CHAPTER 2
A
N INEXPENSIVE,
ACCURATE AND PRECISE WET-
MOUNT METHOD FORENUMERATING AQUATIC VIRUSES1
1Cunningham BR, Brum JR, Schwenck SM, Sullivan MB, John SG. 2015. An inexpensive, accurate and
precise wet-mount method for enumerating aquatic viruses. Appl. Environ. Microbiol. 81:2995–3000.
Reprinted here with permission of publisher. (Appendix A)
2.1 ABSTRACT
Viruses affect biogeochemical cycling, microbial mortality, gene flow, and metabolic functions in diverse environments through infection and lysis of microorganisms. Fundamental to quantitatively investigating these roles is the determination of viral abundance in both field and laboratory samples. One current, widely-used method to accomplish this in aquatic samples is the ‘filter-mount’ method in which samples are filtered onto costly 0.02 μm-pore-size ceramic filters for enumeration of viruses with epifluorescence microscopy. Here we describe a cost-effective (ca. 500-fold lower materials cost) alternative virus enumeration method in which fluorescently-stained samples are wet-mounted directly onto slides, after optional chemical flocculation of viruses in samples with viral concentrations <5×10⁷ mL-1. The concentration of viruses in
the sample is then determined from the ratio of viruses to a known concentration of added microsphere beads via epifluorescence microscopy. Virus concentrations obtained using this wet-mount method, with and without chemical flocculation, were significantly correlated with, and had equivalent precision to, those from the filter-mount method across concentrations ranging from 2.17×10⁶ to 1.37×10⁸ viruses mL-1 when tested using
2.2 INTRODUCTION
Viruses are the most abundant biological entities in aquatic systems and their infection of microorganisms has substantial influences on microbial ecology, biogeochemical cycling, and gene transfer in aquatic environments (e.g., reviewed by Suttle 2005; Breitbart 2012). An accurate method to quantify aquatic viruses is thus essential for use in field and laboratory studies to investigate the roles of viruses in aquatic environments. This enumeration of viruses in aquatic samples has previously been accomplished using transmission electron microscopy (TEM; Bergh et al. 1989), epifluorescence microscopy (reviewed by Suttle and Fuhrman 2010), and flow cytometry (reviewed by Brussaard et al. 2010).
2.3 MATERIALS AND METHODS
2.3.1 COMPARISON OF THE WET-MOUNT AND FILTER-MOUNT METHODS FOR VIRUS ENUMERATION
The wet-mount method was tested by comparing viral concentrations obtained with the wet-mount and filter-mount methods in triplicate samples collected from a variety of marine and freshwater environments, as well as in cultivated viral lysates (described in Table 2.3). Briefly, field samples included a 6-depth profile (5–300m) from the Eastern Tropical North Pacific Ocean (using whole seawater samples), 8 surface ocean locations throughout the Pacific, Atlantic and Southern Oceans chosen for their range in chlorophyll concentrations (collected on the Tara Oceans Expedition (Karsenti et al. 2011); using 0.2 μm-filtered samples), and a freshwater location from South Carolina, USA. All field samples were preserved with glutaraldehyde (0.5% final concentration), flash-frozen in liquid nitrogen, and stored at -80°C until analysis. Lysate samples included the Synechococcus virus S-WHM1 (Millard et al. 2004), two dilutions of the
Synechococcus virus S-SM1 (Sullivan et al. 2003), and the Prochlorococcus virus
P-HM2 (Sullivan et al. 2010). Triplicate independent 1-mL samples were processed using each the filter-mount and wet-mount methods, as described below. Statistical comparison of viral concentrations obtained using each method was then performed using two-tailed t-tests and Pearson correlation (SigmaPlot v12.5, Systat Software Inc).
2.3.2 FILTER MOUNT SAMPLE PREPARATION AND ANALYSIS
on a glass slide with antifade solution (Acros Organics). Viruses were viewed under blue excitation using a Nikon TS100 inversion microscope or a Zeiss Axio Imager epifluorescence microscope at 1000× magnification. Viral concentration was determined using the average number of fluorescent viruses within a given area of the microscope reticle in 20 fields of view and the total volume of sample filtered through a measured area on the filter.
2.3.3 WET-MOUNT SAMPLE PREPARATION AND ANALYSIS
the bead solution must be vortexed thoroughly prior to adding beads to the sample to ensure addition of an accurate concentration of beads. These concentrated samples did not require addition of an antifade solution since they were resuspended in a buffer containing ascorbic acid which reduces fading of the fluorescent signal (Patel et al. 2007). Samples were then pipetted directly onto an isopropanol-cleaned glass microscope slide and covered with a cleaned glass cover slip (step 4 in Table 2.2). Viruses and beads were enumerated in multiple fields of view on a Nikon TS100 inversion microscope or a Zeiss Axio Imager epifluorescence microscope at 1000× magnification until at least 100 each of viruses and beads were enumerated to calculate virus concentration (steps 5-6 in Table 2.2). For each field of view, the total number of fluorescent viruses was determined under blue excitation, after which the total number of beads within the same field of view was determined under white light (Figure 2.2).
a popular antifade chemical (Suttle and Fuhrman 2010), it reacted with glutaraldehyde to form a precipitate in these mount samples and thus should not be used in the wet-mount method with fixed samples. determined under white light (Figure 2.2).
The minimum number of beads and viruses enumerated per sample is justified as follows. Counting statistics (also known as shot noise) dictates that the error in the quantity of viruses or beads counted is given by
√ (John and Adkins 2010), where n is
the number of objects enumerated, and therefore the total error in viral abundance is:
σtotal = + (1)
where nvirus and nbeads are the total number of viruses and beads counted, respectively.
When at least 100 of each viruses and beads are enumerated, the maximum error is 14%. 2.3.4 STORAGE CONDITIONS FOR SAMPLES PREPARED USING THE WET-MOUNT METHOD
2.4 RESULTS AND DISCUSSION
The wet-mount method resulted in fluorescently stained viruses of similar intensity to those in the filter-mount method (Figure 2.2). While there was typically a lower density of viruses in the images derived from samples prepared using the wet-mount method, this is favorable because viruses are enumerated in larger fields of view with the wet-mount as compared to the filter-mount method. However, images depicting a greater density of viruses and cells can be obtained with more concentrated samples (Figure 2.2I). Viral concentrations obtained using the wet-mount method were strongly correlated (Pearson correlation coefficient 0.986, p < 0.001) with those obtained using the filter-mount method for all sample types tested including viral lysates and samples from a variety of oceanic and freshwater regions (Figure 2.3). There was no significant difference in viral concentration obtained when using these methods for the majority of samples (13 of 19 samples; two-tailed t-tests; Table 2.1). For the remaining samples with significantly different viral concentrations, neither method consistently resulted in higher or lower viral concentrations, nor were these differences restricted to a specific range of viral concentration (i.e., high vs. low) or sample type (i.e., freshwater vs. marine, natural sample vs. lysate, low vs. high chlorophyll concentration), indicating stochastic variability inherent to analyzing samples (Figure 2.3, Table 2.3). Furthermore, we consider the low magnitude of the differences in average viral concentration for the few significantly different samples to be acceptable for studies of aquatic viruses.
discrepancies between methods, with one method usually resulting in consistently higher viral concentrations (Hennes and Suttle 1995; Weinbauer and Suttle 1997; Noble and Fuhrman 1998; Marie et al. 1999; Bettarel et al. 2000). However, we observed no such consistent differences in our comparison of the wet-mount and filter-mount methods. Further, the comparison in this study showed that most of the samples had at least 70% agreement between virus concentrations obtained using the wet-mount and filter-mount methods (Figure 2.3), which is similar to previous comparisons of methods used to enumerate viruses (Noble and Fuhrman 1998; Marie et al. 1999). The wet-mount method also had high precision; standard deviations of the mean for triplicate samples were 2–18 % (average 7±4%) of the mean virus concentration and were not significantly different from those obtained using the filter-mount method (two-tailed t-test; p=0.531). Thus, the wet-mount method can be used with equal confidence as the filter-mount method. fixed samples.
The wet-mount method had one major drawback compared to the filter-mount method, which was the inability to efficiently enumerate samples with viral concentrations less than 1×10⁶ viruses mL-1. Attempted analysis of samples with lower
viral concentrations (i.e., samples below 300m in the Pacific Ocean depth profile) using the wet-mount method resulted in ≤1 virus per field of view, even after maximum concentration (100-fold) with chemical flocculation. Thus, the wet-mount method is not recommended for samples with viral concentrations <1×10⁶ viruses mL-1 because the low density of viruses on the slide significantly extends the time to analyze a sample. Although this limitation prevented analysis of the deep-sea samples (>300m) in the Pacific Ocean depth profile in this study, many deep-sea samples have viral concentrations above this limit (e.g., Parada et al. 2007) and thus the wet-mount method should be useful for a wide range of environmental samples.
enumerate both viruses and bacteria (if present) using the same prepared sample (22). However, the wet mount method presented here has not yet been evaluated for accuracy in counting bacterial cells. Among the available epifluorescence-based methods, the filter-mount method also provides an opportunity to obtain images with a high density of viruses and cells while the flow cytometry method does not. The viral density in images obtained using the wet-mount method is generally much lower than for filter-mount samples, though the density of viruses and cells increases when more concentrated samples are used. While each of these variables is important when evaluating potential virus enumeration methods for a given project, we offer the wet-mount method as a cost-effective alternative to the widely-used filter-mount epifluorescence method.
A significant advantage of the wet-mount method over the filter-mount method is the lack of a requirement for costly 0.02 μm-pore-size ceramic filters. Currently, these filters are only available from one supplier and are expensive (~$10 US each). Instead, the wet-mount method uses microsphere silica beads that can be purchased from several suppliers at ~500-fold lower cost ($0.02 for 20 µL of 108 bead mL-1 working solution per sample, calculated based on $150 USD for 15 mL of 109 bead mL-1 stock solution). Even
2.5 CONCLUSION
2
5
Table 2.3. Description of samples used for comparison of the wet-mount and filter-mount virus enumeration methods.
Sample Latitud
e Longitu de Depth (m) Chloroph yll (mg m-3)
Prefilte
r Storage Conditions
Fe-flocculation concentration
factor
Wet-mount (viruses ml
-1)
Filter-mount (viruses ml
-1)
t-test (p-value)
Pacific Ocean depth
profile 18.92ºN 104.89º
W
5 N/A none 0.5% glutaraldehyde,
-80ºC 100x
1.72 x 107
± 2.20 x 10⁵
2.39 x 10⁷
± 1.67 x 10⁶ 0.013
Pacific Ocean depth
profile 18.92ºN 104.89º
W
30 N/A none 0.5% glutaraldehyde,
-80ºC 100x
3.04 x 107
± 6.08 x 10⁶
2.84 x 10⁷
± 1.10 x 10⁶ 0.593
Pacific Ocean depth
profile 18.92ºN 104.89º
W
60 N/A none 0.5% glutaraldehyde,
-80ºC 100x
8.03 x 106
± 2.46 x 10⁶
6.01 x 10⁶
± 213 x 105 0.229
Pacific Ocean depth
profile 18.92ºN 104.89º
W
85 N/A none 0.5% glutaraldehyde,
-80ºC 100x
1.09 x 107
± 1.05 x 10⁶
6.92 x 10⁶
± 4.51 x 10⁵ 0.008
Pacific Ocean depth
profile 18.92ºN 104.89º
W
100 N/A none 0.5% glutaraldehyde,
-80ºC 100x
7.85 x 106
± 2.39 x 10⁶
4.94 x 10⁶
± 1.51 x 10⁵ 0.103
Pacific Ocean depth
profile 18.92ºN 104.89º
W
300 N/A none 0.5% glutaraldehyde,
-80ºC 100x
3.59 x 106
± 2.04 x 10⁶
1.41 x 10⁶
± 3.44 x 10⁴ 0.138
Tara Oceans, Station 96,
Pacific Ocean
29.72ºS 101.16º W
5 0.008 0.22
µm
0.5% glutaraldehyde,
-80ºC 100x
2.17 x 106
± 4.61 x 10⁵
1.04 x 10⁶
± 1.22 x 10⁵ 0.048
Tara Oceans, Station 142,
Atlantic Ocean 25.51ºN
88.38ºW 5 0.052 0.22 µm
0.5% glutaraldehyde,
-80ºC 100x
4.16 x 106
± 5.21 x 10⁵
5.71 x 10⁶
± 1.28 x 10⁵ 0.007
Tara Oceans, Station 81,
Atlantic Ocean
44.53ºS 52.47ºW 5 0.112 0.22 µm
0.5% glutaraldehyde,
-80ºC 100x
5.40 x 106
± 6.59 x 10⁵
5.84 x 10⁶
± 1.20 x 10⁵ 0.434
Tara Oceans, Station 139,
Pacific Ocean
6.48ºN 94.96ºW 5 0.226 0.22 µm
0.5% glutaraldehyde,
-80ºC 100x
1.47 x 107
± 3.51 x 10⁶
1.74 x 10⁷
2
6
Tara Oceans, Station 90,
Pacific Ocean
39.62ºS 76.96ºW 5 1.339 0.22 µm
0.5% glutaraldehyde,
-80ºC 100x
1.42 x 107
± 2.07 x 10⁶
2.06 x 10⁷
± 1.25 x 10⁶ 0.021
Tara Oceans, Station 89,
Pacific Ocean
57.73ºS 67.11ºW 5 1.962 0.22 µm
0.5% glutaraldehyde,
-80ºC 100x
4.61 x 106
± 1.73 x 10⁶
2.20 x 10⁶
± 2.81 x 10⁵ 0.191
Tara Oceans, Station 92,
Pacific Ocean
33.69ºS 72.00ºW 5 3.142 0.22 µm
0.5% glutaraldehyde,
-80ºC 100x
2.22 x 107
± 4.73 x 10⁶
3.22 x 10⁷
± 1.54 x 10⁶ 0.036
Tara Oceans, Station 87,
Southern Ocean
63.85ºS 56.13ºW 5 5.691 0.22 µm
0.5% glutaraldehyde,
-80ºC 100x
7.45 x 106
± 2.88 x 10⁶
8.25 x 10⁶
± 7.36 x 10⁵ 0.667
Lake Murray, South Carolina, USA
34.04
ºN 81.22ºW 1 N/A
0.22 µm
0.5% glutaraldehyde,
-80ºC 10x
6.28 x 106
± 2.13 x 10⁵
5.98 x 10⁶
± 3.86 x 10⁵ 0.295
Lysate SWHM1 N/A N/A N/A N/A 0.22
µm 4ºC 100x
1.30 x 107
± 6.78 x 10⁵
1.24 x 10⁷
± 1.80 x 10⁶ 0.629
Lysate PHM2 N/A N/A N/A N/A 0.22
µm 4ºC 100x
7.30 x 106
± 4.18 x 10⁵
7.82 x 10⁶
± 5.37 x 10⁵ 0.257
Lysate S-SM1 N/A N/A N/A N/A 0.22
µm 4ºC N/A
7.38 x 10⁷
± 1.07 x 10⁷
5.72 x 10⁷
± 4.13 x 10⁶ 0.067
Lysate S-SM1 N/A N/A N/A N/A 0.22
µm 4ºC N/A
1.37 x 10⁸
± 1.90 x 10⁷
1.20 x 10⁸
± 2.18 x 10⁷ 0.434
2
7
2
8
2
9
3
0
CHAPTER
3
P
HAGE GROWTH KINETICS OF3
CYANOPHAGES PROPAGATED ONF
E-LIMITED HOST
S
YNECHOCOCCUSWH7803
3.1 ABSTRACT
Fe-limitation of hosts had no effects on phage growth kinetics for 3 cyanophages (Syn9, S-SM1, S-PM2) individually propagated on nutrient-replete and Fe-limited host
Synechococcus WH7803. Therefore, if future climate change causes increased
Fe-limitation in many ocean regions, we may observe a less efficient microbial loop and biological pump since host cells are growing slower, but producing a similar concentration of viruses. This would cause an increase in viral infection and lysis reducing carbon fixation and sequestration.
3.2 INTRODUCTION
Over the last few decades, researchers have determined that viruses are the most abundant biological entity in the ocean, averaging 3x10⁹ virusesl-1 (Suttle 2005). Marine viruses infect many microorganisms and influence microbial ecology, biogeochemical cycling, and gene transfer within the ocean (Breitbart 2012). However, viral replication varies between strains and even among the metabolic status of the host (Weinbauer 2004). For example, it has been shown that viral burst size (the number of viral particles released per infected host cell) of phages can range from ~20 to greater than 200 and viral latency period (time from infection to lysis of a cell) can range from ~1 hour to greater than 9 hours (Wilson et al. 1996; Mann et al. 2003; Brown et al. 2006; Lindell et al. 2007; Stoddard et al. 2007; Wang 2007; Kuznetsov et al. 2010; Raytcheva et al. 2011; Sabehi et al. 2012; Maat et al. 2014).
areas of the ocean. There are many areas in the ocean where phytoplankton can either by limited of co-limited by available nutrients, influencing growth and metabolism of cells (Moore et al. 2013). One of the first and most commonly studied nutrient limitations is phosphorus (P) limitation. Interestingly, one viral kinetics study analyzed the effects of a phosphate-replete and phosphate-deplete host (WH7803) on viral kinetics of phage S-PM2. It was discovered that under phosphate limitation the viral burst size was reduced by 80% and the latency period increased compared to the host grown in phosphate-replete conditions (Wilson et al. 1996). Other studies on marine eukaryotes have shown similar reduction in viral production under P-limitation (Bratbak et al. 1993, 1998; Maat et al. 2014). However, there was no observed difference in viral growth kinetics when an eukaryotic host was grown in the absence of metals Zn, Cd, or Co, (Gledhill et al. 2012).
hypothesized that Fe-limitation of hosts would illicit a similar response in phage growth kinetics to P-limitation, where phage production decreases and latency period increases. 3.3 MATERIALS AND METHODS
The strain Synechococcus WH7803 (CCMP 1334) used as a host throughout this study was routinely grown in 1 L trace metal cleaned polycarbonate bottles with constant bubbling from air pushed through a 0.2 μm filter. These cultures were grown under a 14:10 light:dark cycle at 40 μEinsteins at 23° C in trace metal ion buffered artificial sweater (ASW) (Sunda et al. 2005) with the addition of nutrients to create SN media (Waterbury et al. 1986). ASW contained 409 mM NaCl, 53 mM MgCl2 * 6H2O, 28 mM
Na2SO4, 10 mM CaCl2 * 2H2O, 9 mM KCl, 2.7 mM NaHCO3, 824 μM KBr, 420 μM
H3BO3, 90 μM SrCl2 * 6H2O, 71 μM NaF. To create SN media in a 1 L polycarbonate
bottle, 750 mL ASW was combined with 236 mL ultrapure water (UPW) with the following addition of nutrients and trace metals to achieve final concentrations of 9 mM NaNO3, 99 μM K2HPO4, 15 μM Na2EDTA * 2H2O, 100 μM Na2CO3, 738 pM
cyanocobalomin, 32.5 μM citric acid * H2O, 23 μM ferric ammonium citrate, 7.08 μM
MnCl2 * 2H2O, 772 nM ZnSO4 * 7H2O, 85.9 nM Co(NO3)2 * 6H2O. For Fe-limited SN
3.3.1 PREPARATION OF PHAGE STOCK
Phage stocks ranged in concentration from 2.1 to 8.7x10⁸ virus mL-1 and were generated by adding an aliquot of phage lysate to an exponentially growing 1 L Fe-replete culture. The infected culture was kept at 23° C under 14:10 light:dark illumination at 40 μEinsteins. Phage was harvested when cell lysis was observed by flow cytometry in the infected culture. Harvested phage was filtered through a 0.2 μm filter to remove cellular debris. To increase total phage concentration, the 0.2 μm filtered lysate was concentrated from 1 L to ~50 mL using a 100kDa Sartoris 50R.
3.3.2 DETERMINATION OF PHAGE TITER
Phage titer was determined by most probably number (MPN) assay (Cochran 1950). Briefly, this assay combines exponentially growing WH7803 with a serial dilution of phage in a 96-well plate. The plate is kept in the incubator and visually inspected daily for cell lysis. If lysis occurs in a well, the phage dilution previously recorded assumes that there are at least that many infective phage particles in solution. For example, if lysis occurs in a well with phage stock diluted 10-6, and not in 10-7 phage dilution well, then there are at least 106 infective phages mL-1. Phage titer in these experiments was 107 for
Syn9, S-SM1, and S-PM2.
3.3.3 GROWTH CURVES OF WH7803
3.3.4 CONCENTRATION OF HOST CELLS
Exponentially growing Synechococcus WH7803 in both nutrient-replete and Fe-limited SN media were harvested when concentrations reached 107 cells mL-1 as determined by
flow cytometry. The cells were transferred in to trace metal clean 50 mL centrifuge tubes and centrifuged at 5000 x g for 10 minutes at room temperature. The supernatant was removed and the cells were resuspended in ~5 mL of nutrient-replete or Fe-limited SN media to achieve 108 cell mL-1.
3.3.5 PHAGE GROWTH KINETICS
Growth kinetics for each phage strain was determined by one-step growth curves. In triplicate, 1 mL of host cells at a concentration of 108 mL-1 were combined with 1 mL of infective phage at a concentration of 107 mL-1 in 15 mL trace metal clean tubes
host cell concentrations were then used to determine burst size of the phage by dividing the number of newly produced phages by the number of lysed host cells (Maat et al. 2014).
3.3.6 QUANTITY OF EXTERIOR PHAGE
The quantities of exterior phages produced over time were determined by quantitative real-time polymerase chain reaction (qPCR). Primers for Syn9, S-SM1, and S-PM2 was designed using Primer3 software with an ideal primer size of 18-22bp and a product size of ~120bp. The primer sequences for each phage are as follows: Syn9 forward AGCGATTAAAGCAGTCAACC, Syn9 reverse AGGGAGATTACCAACGTCAA,
S-SM1 forward GTCCAGAAGAACTGCGTGGT, S-SM1 reverse
GCAATTTTCATGCCCTGATT (Zeng and Chisholm 2012), S-PM2 forward CTACACTTCCAGGCGGTCAG, and S-PM2 reverse TCGAAGGATCTCCGTGGACT (this study).
extension at 72°C for 30 s; melting curve analysis heated to 95°C for 10 s, annealing at 65°C for 5 s, and extension at 95°C for 5 s.
3.4 RESULTS AND DISCUSSION
3.4.1 RESPONSE OF HOST CELLS TO FE-LIMITATION
Synechococcus WH7803 host cells grown in nutrient-replete and Fe-limited media were
measured by cell count and fluorescence to analyze cell growth and stress. Host cell population doublings per day were on average 0.8 ± 0.1 in nutrient-replete media and 0.39 ± 0.1 in Fe-limited media, while fluorescence also showed a decrease by ~1/3 between nutrient-replete and Fe-limited media (Table 3.1). Both measurements show that the growth rate between cells in Fe-limited media is at least halved allowing us to believe that these cells are Fe-limited.
3.4.2 PHAGE GROWTH KINETICS
3.4.3 COMPARISON OF PHAGE GROWTH KINETICS
Here, we intended to model our experiments after a set of experiments performed by Wilson et al. (Wilson et al. 1996) using the same host and phage. However, instead of P-limiting the host we instead grew the host under Fe-limitation and performed phage kinetics on three phages, including the phage used in the original experiments. Wilson et al. (Wilson et al. 1996) found that phage S-PM2 propagated on P-deplete host WH7803 showed a delayed latency period of 18 hours and a decreased burst size of 80% when compared to S-PM2 propagated on the P-replete host. Our results showed no change in latency period or significant difference in burst size for all three phages when propagated on host WH7803 under nutrient-replete and Fe-deplete conditions.
Another difference between experiments is host cellular growth conditions. For our study, host growth rate was determined by cell count, while Wilson et al. host growth rate was determined by absorbance. The difference in methodologies makes host growth rates difficult to directly compare, but our study observed a 50% average decrease in host growth rate from nutrient-replete to Fe-deplete cells, while Wilson et al. observed a 40% decrease. The reduction in growth rates between the studies is similar, but difference in experimental methodologies occurs when nutrient-limiting the host cells. To Fe-limit our host cells, we transfer nutrient-replete WH7803 into Fe-deplete media and grow these cells over multiple generations in low Fe conditions. In the Wilson et al. study, nutrient-replete host cells are transferred to P-deplete media and immediately used in phage growth kinetic experiments. It is possible that our host cells grown in Fe-limited conditions over successive generations have adapted their cellular machinery to low Fe conditions for optimal performance. On the other hand, the host cells in the Wilson et al. study may be “shocked” when first transferred into P-deplete media and may respond by slowing down cellular machinery, thereby increasing the time to lysis and producing less phage during infection.
host Synechococcus WH7803 is an oceanic strain that is adapted for low Fe conditions, but does not elicit a typical response to Fe-limitation. Unlike other cyanobacteria, this strain does not produce siderophores to capture Fe nor does it synthesize the flavodoxin protein, a protein that replaces ferrodoxin during periods of low Fe availability (Chadd et al. 1996; Roche et al. 1996). Instead, this strain produces the IdiA protein, which is predicted to function in Fe transport and photosystem II protection during Fe stress (Fulda et al. 2000; Tölle et al. 2002). Interestingly, when WH7803 was cultured and Fe-limited, IdiA, which can be used as an indicator of Fe-stress, was only significantly detected when Fe was completely removed from the media (Webb et al. 2001; Rivers et al. 2009). Since our media still contained 230 nM Fe, it may be possible extreme Fe-stress was not induced in our cultures. Finally, a recent study of Fe-limited oceanic
Synechococcus suggests that Fe-limitation does not depend on Fe alone, but also depends
on the availability of Fe, N, and P (Mackey et al. 2015a). 3.5 CONCLUSION
4
2
Phage Media
Cell count Growth Rate
(day-1)
Fluorescence Growth Rate
(day-1)
Latent Period
(hours) Burst Size
Syn9 Nutrient-replete 0.72 0.26 15-18 42.1
Fe-limited 0.33 0.13 15-18 41.8
S-SM1 Nutrient-replete 0.76 0.34 1.5-2 39
Fe-limited 0.34 0.11 1.5-2 31.6
S-PM2 Nutrient-replete 0.93 0.36 6-9 57.8
Fe-limited 0.51 0.18 6-9 62.9
4 3 0 8 16 24 32 40 48
0 5 10 15 20 25 30
V ir u s c o n c e n tr a ti o n ( in m ill io n s ) Hour Syn9 qEXT 0 2 4 6 8 10 12
0 1 2 3 4 5 6 7
V ir u s c o n c e n tr a ti o n ( in m ill io n s ) Hour S-SM1 qEXT 0 8 16 24
0 5 10 15 20 25
V ir u s c o n c e n tr a ti o n ( in m ill io n s ) Hour S-PM2 qEXT 0 10 20 30 40 50 60 70 80 90
0 3 6 9 12 15 18 21 24 27
c e lls /m L *1 0 ,0 0 0 Hour Syn9 FCM 0 10 20 30 40 50 60 70
0 0.5 1 1.5 2 4 6
c e lls /m L * 1 0 ,0 0 0 Hour S-SM1 FCM 0 10 20 30 40 50 60
0 3 6 9 12 15 18 21 24
c e lls /m L * 1 0 ,0 0 0 Hour S-PM2 FCM
Fe replete
Fe deplete
CHAPTER 4
C
HANGES IN ELEMENTAL STOICHIOMETRY OF PICOPHYTOPLANKTON GROWNUNDER
F
E-
LIMITATION AND INFECTION4.1 ABSTRACT
stoichiometry of two cyanobacteria and one picoeukaryotic phytoplankton species. We find the average elemental composition of the nutrient-replete cells to be
(C80N18.5P1Mg6Ca2)1000Fe20.5Mn1.68Zn1.1Cu0.5Ni0.3Co0.04Cd0.002, while Fe-limited cells
average is (C123N30P1Mg11Ca1.7)1000Fe9.32Mn2.7Zn1.4Cu0.6Ni0.66Co0.11Cd0.0033. We also
examined how viral infection can influence the extended elemental stoichiometry of an Fe-limited cyanobacteria host. Our data show that viral infection leads to an increase P concentration in the cell. This increase in P is accompanied by increases in Zn, Mg, and Ca that could indicate production of the alkaline phosphatase and 5’ nucleotidase enzymes. By analyzing the data from extended elemental stoichiometry of Fe-limited picophytoplankton, we may be able to determine how impending climate change and variation in nutrient availability may impact phytoplankton growth and utilization of nutrients.
4.2 INTRODUCTION
it was believed that if the 16:1 ratio in seawater were altered, phytoplankton would experience N-limitation (ratios below 16:1) or P-limitation (ratios above 16:1). However, recently is has been discovered that N:P composition of some phytoplankton communities can range by over an order of magnitude (Geider and La Roche 2002). This range in N:P ratios are due to the regional variation in the phytoplankton community species composition and typically range from 12:1 in polar oceans to 20:1 in sub-Antarctic oceans These findings lead to the idea that the average dissolved nutrient concentration of 16:1 is controlled by global ocean circulation patterns that distribute dissolved N:P ratios derived from variation in particulate ratios (Weber and Deutsch 2010, 2012).
high, but if it favors exponential growth, then N:P will be low (Elser et al. 2003; Klausmeier et al. 2004). The fourth explanation is the alteration of cellular elemental stoichiometry due to availability of nutrients in the surrounding media. This is commonly observed in laboratory cultures where phytoplankton can exhibit varying elemental stoichiometry by altering nutrient concentration in situ (Rhee 1978; Bertilsson et al. 2003).
Among these explanations, one of the most important to climate change and trophic food web dynamics is determining how the variation in nutrient availability alters cellular elemental stoichiometry. Several studies have analyzed changes in elemental stoichiometry in laboratory cultures of nutrient-limited phytoplankton (Hutchins et al. 1999; Lynn et al. 2000; Sañudo-Wilhelmy et al. 2001; Bertilsson et al. 2003; Ho et al. 2003), but very few studies have analyzed the effects of Fe-limitation on the Redfield Ratio or the extended elemental stoichiometry (Price 2005; Hoffmann et al. 2007). Analyzing the extended elemental stoichiometry of nutrient-replete and nutrient-limited phytoplankton in laboratory cultures can reveal differences between uptake of micro- and macronutrients that can be extrapolated to oceanic populations. These differences could help understand how climate change will influence particulate nutrient concentration in surface seawater.
However, there exists little research determining the extended elemental stoichiometry of these phytoplankton species in Fe-limited conditions. Available research has used synchrotron X-ray fluorescence microscopy (SXRF) to determine P:element ratios in field samples of cyanobacteria cells (Twining et al. 2010; Twining and Baines 2013). This work is extremely important in that it is some of the first research to determine P:element ratios of cyanobacteria. However, SXRF cannot directly determine C and N concentrations. Determining these macronutrient concentrations, in conjunction with other elements, would provide further information to make conclusions about extended elemental stoichiometry of picophytoplankton.
Our research analyzes the extended elemental stoichiometry, including C and N, of laboratory cultures of oceanic strains of cyanobacteria and picoeukaryotic phytoplankton. We axenically grew two strains of cyanobacteria (Synechococcus
WH7803 and Prochlorococcus MED4) and one strain of picoeukaryotic phytoplankton
(Ostreococcus lucimarinus) in nutrient-replete and Fe-limited media. Here, we report the
first full comparison of extended elemental stoichiometry of laboratory grown nutrient-replete and Fe-limited picophytoplankton. We find significant differences between average element:P ratios of C, N, Co, Fe, Mn, and Cd between nutrient-replete and Fe-limited picophytoplankton cells. Also, when we separate the elemental stoichiometry ratios based on species, we find interesting patterns possibly relating to production of stress-reducing enzymes. To gain a fuller understanding of how trophic food web dynamics influence picophytoplantkon elemental stoichiometry, we also examined the effects of viral infection on the extended elemental stoichiometry of Fe-limited
significant increase in P concentration (moles cell-1) in the treatments containing active
virus compared to uninfected treatments. 4.3 MATERIALS AND METHODS
4.3.1 GROWTH OF LABORATORY CULTURES
Three strains of picophytoplankton (Synechococcus WH7803, Prochlorococcus MED4,
Ostreococcus lucimarinus) were axenically grown in nutrient-replete and Fe-deplete
media. Each culture was routinely grown in 1 L trace metal cleaned polycarbonate bottles with constant bubbling from air pushed through a 0.2 μm filter. These cultures were grown under a 14:10 light:dark cycle at 40 μEinsteins at 23° C. Cell concentrations were tracked daily using a Guava easyCyte HPL flow cytometer. We observed significant decreases in growth rate between cells grown in nutrient-replete and Fe-limited cultures (Table 4.1).
To promote sustained growth in culture, each strain was cultured in a slightly different media. Synechococcus WH7803 was grown in SN media, Prochlorococcus
in growth rates between nutrient-replete and Fe-deplete conditions for each species. Below we further describe the recipes for each media.
The strain Synechococcus WH7803 (CCMP1334) was grown in trace metal ion buffered artificial sweater (ASW) (Sunda et al. 2005) with the addition of nutrients to create SN media (Waterbury et al. 1986). ASW contained final concentrations of 409 mM NaCl, 53 mM MgCl2 * 6H2O, 28 mM Na2SO4, 10 mM CaCl2 * 2H2O, 9 mM KCl,
2.7 mM NaHCO3, 824 μM KBr, 420 μM H3BO3, 90 μM SrCl2 * 6H2O, 71 μM NaF. To
create SN media in a 1 L polycarbonate bottle, 750 mL ASW was combined with 236 mL ultrapure water (UPW) with the following addition of nutrients and trace metals to achieve final concentrations of 9 mM NaNO3, 99 μM K2HPO4, 15 μM Na2EDTA *
2H2O, 100 μM Na2CO3, 738 pM cyanocobalamin, 32.5 μM citric acid * H2O, 23 μM
ferric ammonium citrate, 7.08 μM MnCl2 * 2H2O, 772 nM ZnSO4 * 7H2O, 85.9 nM
Co(NO3)2 * 6H2O. For Fe-limited SN media, the ferric ammonium citrate was reduced
100-fold to 230 nM, while all other nutrient concentrations remained the same.
The strain Prochlorococcus MED4 (CCMP1986) was grown in low-nutrient, 0.2 μm filtered and microwave sterilized seawater with the addition of nutrients to create PRO99 media (Moore et al. 2007). The seawater was combined macronutrients to achieve final concentrations of 50 μM NaH2PO4 * H2O, 800 μM NH4Cl, and trace
element mixture. The trace element mixture was filter sterilized, added at a concentration of 1 mL L-1 of PRO99 media, and contained final nutrient concentrations of 1.17 μM Na2EDTA * 2H2O, 1.17 μM FeCl3 * 6H2O, 8 nM ZnSO4 * 7H2O, 5 nM CoCl2 * 6H2O,
For Fe-limited PRO99 media, the FeCl3 * 6H2O was reduced 100-fold to 11.7 nM, while
all other nutrient concentrations remained the same.
The strain Ostreococcus lucimarinus was grown in trace metal ion buffered ASW with the addition of nutrients to create Aquil media (Sunda et al. 2005). ASW contained the same salt concentrations described in the above paragraph creating SN media. To create Aquil the following addition of nutrients, trace metals, and vitamins were added to achieve final concentrations of 10 μM NaH2PO4 * H2O, 100 μM NaNO3, 100 μM
Na2SiO3 * 9H2O, 100 μM Na2EDTA * 2H2O, 1 μM FeCl3 * 6H2O, 79.7 nM ZnSO4 *
7H2O, 50.3 nM CoCl2 * 6H2O, 121 nM MnCl2 * 4H2O, 100 nM NaMoO4 * 2H2O, 10 nM
Na2SeO3, 19.6 nM CuSO4 * 5H2O, 297 nM thiamine, 2.25 nM biotin, 370 pM
cyanocobalamin.
4.3.2 PROPAGATION OF VIRUS
The virus was propagated on WH7803 host cells grown in Fe-limited conditions to reduce Fe-contamination when infecting Fe-limited cultures. The infected culture was kept at 23° C under 14:10 light:dark illumination at 40 μEinsteins. Virus was harvested when cell lysis was observed by flow cytometry in the infected culture. Harvested virus was filtered through a 0.2 μm filter to remove cellular debris. To increase total virus concentration, the 0.2 μm filtered lysate was concentrated from 1 L to ~50 mL using a 100kDa Sartoris 50R. The final virus concentration totaled 8.7x10⁹ virus mL-1.
4.3.3 INFECTION OF FE-LIMITED CELLS
killed virus (HK, Syn9 removed) media, and tracked over the course of the infection by flow cytometry. Initially, exponentially-growing Fe-limited WH7803 cells were transferred into four separate 4 L trace metal cleaned polycarbonate bottles, each containing 2 L of Fe-limited SN media. Each bottle was aerated with constant bubbling from air pushed through a 0.2 μm filter. These cultures were grown under a 14:10 light:dark cycle at 40 μEinsteins at 23° C. Once cells reached early exponential growth (~5x10⁶ cells mL-1), 5 mLs of either AV or HK media was added to separate duplicate cultures. The AV media contained ~108 infective Syn9 virus particles, creating a
multiplicity of infection (MOI) of 0.05. The HK media was used as a control for the addition of nutrients when AV/HK media was transferred to each culture. Since the virus were propagated on Fe-deplete media and addition of AV/HK media is only 0.25% of the total culture media, any nutrient-addition effect should be negligible. After the addition of AV/HK media, cultures were tracked and harvested for elemental concentration at T0 (time of infection), T24, T48, T72 hours past infection. The procedures outlining harvesting of cells and extended elemental stoichiometry measurements are described below.
4.3.3 PARTICULATE CARBON AND NITROGREN MEASUREMENTS
4.3.4 TRACE ELEMENT MEASUREMENTS
To analyze trace elements concentration of cells, the cells were harvested, processed, and run on an Element 2 ICP-MS to determine cellular elemental concentration. Briefly, cells were harvested when they achieved mid-log phase growth. Initially, cells were washed in 60 mL oxalate solution per 1 L culture to remove any metals that had precipitated onto the outside of the cells. This solution has been shown to remove surface adsorbed Fe and other metals from phytoplankton cells (Tovar-Sanchez et al. 2003; Sanudo-Wilhelmy et al. 2004). Then, cultures were inverted and incubated at room temperature for 30 minutes. After incubation, 100 mL of culture was vacuum-filtered onto trace-metal cleaned 47-mm 0.2 μm polycarbonate filters. Filtrations were performed in triplicate for each culture. Once filtration was complete, the filter rig was washed 3X with 5 mL of UPW to rinse remaining cells off the filter rig wall. Filters were then cleanly removed and placed in individual acid cleaned Teflon pots. A 10-pbb-indium standard was added to the filters to control for metals retained on the filters during the leaching process. Then, 1 mL each of concentrated ultrapure quartz distilled HCl and HNO3 were
Elemental Mass Spectrometry at the University of South Carolina with a 10-pbb multi-element standard to determine extended multi-elemental stoichiometry.
4.3.5 DATA ANALYSIS
Statistical comparison of elemental composition of phytoplankton cells obtained throughout the experiments was performed using two-tailed t-tests and Kolmogorov-Smirnov tests for normality (SPSS Statistics v23.0, IBM Corporation).
4.4 RESULTS AND DISCUSSION
4.4.1 ELEMENTAL STOICHIOMETRY OF PICOPHYTOPLANKTON
We average the extended elemental stoichiometry data of two prokaryotes and one eukaryote grown in laboratory cultures. We find significant (p<0.05) element:P quota (moles cell-1) increases in C , N, Mn, Co, and Cd and a decrease in Fe between cells
grown in nutrient-replete compared to Fe-limited media (Table 4.2). Overall, the average elemental composition of the nutrient-replete cells is
(C80N18.5P1Mg6Ca2)1000Fe20.5Mn1.68Zn1.1Cu0.5Ni0.3Co0.04Cd0.002, while Fe-limited cells
average (C123N30P1Mg11Ca1.7)1000Fe9.32Mn2.7Zn1.4Cu0.6Ni0.66Co0.11Cd0.0033.
4.4.1.1 MACRONUTRIENT CONCENTRATIONS
paleoceanography, this research has implications when interpreting Cd:P ratios. Within seawater, Cd and P exhibit similar distributions, which are controlled by phytoplankton biological uptake and remineralization (Boyle et al. 1976; de Baar et al. 1994). Since, cellular P concentrations influence cellular Cd concentrations, Cd deposits in ocean cores can be used as a proxy for biological P uptake. Therefore, this helps researchers better understand phytoplankton growth and ocean nutrient regimes during various times throughout geological history (Cullen et al. 1999; Lane et al. 2009).
2000). These habitats exhibit varying nutrient concentrations, which influence phytoplankton community composition. Together, this information shows that increase in cellular P concentration of Fe-limited diatoms in the Price (2005) study may not phytoplankton response observed for all phytoplankton, but may only be applicable to certain ocean regions. Our data shows that Fe-limited smaller species of phytoplankton, native to different habitats actually have reduced cellular P concentrations, potentially influencing local biogeochemical cycling in certain ocean regions differently than that of diatoms.
Interestingly, our results match results from other studies of elemental stoichiometry of P-limited picophytoplankton of cyanobacteria cells (Sañudo-Wilhelmy et al. 2001; Bertilsson et al. 2003; Ji and Sherrell 2008). These studies show that under P-limitation, phytoplankton cellular P concentrations decrease, causing N:P ratios to increase. The P-limited phytoplankton N:P ratios varied substantially based on species and ranged from an average of 21:1 for Trichodesmium (Sañudo-Wilhelmy et al. 2001) to 57:1 for picoeukaryotes (Ji and Sherrell 2008) to 109:1 for Synechococcus and
Prochlorococcus cells (Bertilsson et al. 2003). Under P-limitation, it would be expected
that cellular P concentrations would decrease in response to reduced amounts of dissolved P in the surrounding media. However, a decrease in cellular P concentration when only dissolved Fe concentrations are reduced and dissolved P concentrations remain unaltered is fascinating. Under Fe-limitation we observe increased N:P ratios ranging from 25:1 for Ostreococcus to 29:1 for Prochlorococcus to 32:1 for
Synechococcus (Table 4.3). Coincidentally, we also observe a reduction in cellular
Synechococcus (Table 4.1). These findings may suggest that for Fe-limited picophytoplankton, dissolved P uptake is not regulated by ambient P concentration, but instead by bulk cellular growth rate. The reduction in cellular P concentration leading to the increase in cellular N:P ratios under Fe-limitation indicate that phytoplankton metal-limitation and cellular metal concentration may be extremely important in interpreting particulate cellular and dissolved oceanic macronutrient concentrations.
Our particulate phytoplankton findings also match modeled data of dissolved N:P variations due to changes in oceanic Fe concentrations and denitrification (Weber and Deutsch 2012). The model predicts that with increasing ocean Fe-limitation and decreasing denitrification, subtropical ocean regions will exhibit larger dissolved N:P ratios than the common 16:1 Redfield ratio (Weber and Deutsch 2012). This modeling data matches data from our study where we observe an increase in particulate N:P ratios from an average of 18.5 in replete media to an average of 28.5 in Fe-limited media (Table 4.3). As described earlier, particulate and dissolved stoichiometric ratios are tightly correlated. Phytoplankton growth corresponds to the available concentrations of dissolved nutrients in the surrounding media. When phytoplankton die, the decomposition of the cells remineralize and the nutrients are redistributed back into the dissolved phase. Typically, in regions where high particulate N:P content is observed, competition among phytoplankton for dissolved N is high. This competition limits the amount of available N, causing phytoplankton growth limitation. Under this scenario, N2
nutrients are abundant, for instance under bloom conditions, diazotrophs are usually growth-limited due to their requirement for large concentrations of Fe to fix N2 and
photosynthesize. Non-N2-fixing phytoplankton can prosper under these conditions since
their major Fe requirement is used solely for photosynthesis. However, under Fe-limitation, unlike N-Fe-limitation, diazotrophs lose their competitive growth advantage. It has been shown that under Fe-limitation, diazotrophs conserve Fe by selectively sacrificing N2 fixation to ensure photosynthetic efficiency (Berman-Frank et al. 2001;
Moore et al. 2002; Moore and Doney 2007; Shi et al. 2007). A reduction or termination of diazotroph N2 fixation would cause effects throughout the phytoplankton community.
Typically, it is assumed that diazotrophs are responsible for high N:P signals in particulate ocean samples (Sohm et al. 2011; Weber and Deutsch 2012). As described earlier, particulate stoichiometric ratios are tightly correlated with dissolved ratios. Since large portions of the global ocean, including vast areas of the Pacific Ocean and Southern Atlantic Ocean, are considered limited (Sohm et al. 2011), it may be possible that Fe-limited picophytoplankton, not diazotrophs, are driving the high N:P signals observed in the subtropical open oceans. Again, our data shows that cultured Fe-limited picophytoplankton have larger N:P ratios than picophytoplankton grown in replete conditions.
grown in P-limitation or used equipment (SXRF) that can only measure metal:P ratios and do not directly measure C:N:P ratios (Bertilsson et al. 2003; Twining and Baines 2013). On the other hand, the studies that have examined extended elemental stoichiometry of picophytoplankton were performed using SXRF on field samples that could only determined metal elemental composition of phytoplankton in low-nutrient habitats (Twining et al. 2004, 2010; Twining and Baines 2013). Our study differs in that we are able to determine the entire elemental stoichiometry spectrum, including C and N, while comparing laboratory cultured phytoplankton grown in Fe-limited media to nutrient-replete media (Table 4.3).
4.4.1.2 Fe, Zn, Co, Cd CONCENTRATIONS
On average, the trace metal composition of cells grown in nutrient-replete media do not vary more than a factor of 4 from cells grown in Fe-limited media. The metal concentrations follow the order Fe>Mn>Zn>Cu>Ni>Co>Cd in nutrient-replete and Fe>Mn>Zn>Cu≈Ni>Co>Cd in Fe-limited cell cultures (Table 4.2). As stated earlier, we observe significant increases in cellular concentrations of Mn, Co, and Cd and a significant decrease in Fe when picophytoplankton are grown in Fe-limited compared to nutrient-replete media. Interestingly, there are also certain inter-species variations that we observe when the element:P quotas are plotted by species and culture media (Figure 4.2, Table 4.3). When individually comparing the prokaryotes (Synechococcus and
Prochlorococcus) to the eukaryote (Ostreococcus) we observe higher concentrations of
eukaryotes (Brand 1991; Wilhelm et al. 1996; Twining and Baines 2013). It was observed that when cyanobacteria cells and eukaryotic phytoplankton were grown under the same conditions, cyanobacteria cells appeared to be Fe-limited, while the eukaryotic phytoplankton growth was not impaired (Brand 1991). Another study shows that unlike eukaryotic phytoplankton, certain strains of cyanobacteria can produce siderophores to assimilate previously unavailable Fe from the surrounding media (Wilhelm et al. 1996). Overall, it seems that a potential reason for the difference in Fe concentrations and requirements between prokaryotes and eukaryotes is due to the absence of carbon-rich structures in prokaryotes (Twining and Baines 2013).
an oceanic strain (Carr and Mann 2004) and tends to acquire large amounts of Fe when increased dissolved Fe concentrations are available.
The observed increases in cellular P and Fe concentration should not be due to any excess cellular adsorbtion of P or Fe particles. The oxalate-EDTA wash was used to rinse the cells of any extracellular material prior to cell processing (Tovar-Sanchez et al. 2003). In fact, the phytoplankton (WH7803) that exhibited the greatest change in P and Fe concentration between medias also seems to exhibit a large change in cell size. Our flow cytometry measurements show a size difference between WH7803 cells grown in nutrient-replete and Fe-limited media, which is not apparent in measurements of our other cells. When WH7803 is grown on nutrient-replete media, we see larger on average cell size by forward scatter compared to Fe-limited media. This pattern is not observed in cultures of Fe-limited or nutrient-replete cultures of Prochlorococcus MED4 or
Ostreococcous lucimarinus (Figure 4.4). This size difference could potentially account
for the increased cellular P and Fe due to production of a larger cellular body leading to a larger cell surface area that facilitates increased nutrient uptake.