Scholarship@Western
Scholarship@Western
Electronic Thesis and Dissertation Repository
8-2-2013 12:00 AM
Auditory Temporal Processing in Children with Specific Language
Auditory Temporal Processing in Children with Specific Language
Impairment Compared to Same-Age Controls
Impairment Compared to Same-Age Controls
Elaine Yuen Ling Kwok
The University of Western Ontario
Supervisor Dr. Janis Cardy
The University of Western Ontario
Graduate Program in Health and Rehabilitation Sciences
A thesis submitted in partial fulfillment of the requirements for the degree in Master of Science © Elaine Yuen Ling Kwok 2013
Follow this and additional works at: https://ir.lib.uwo.ca/etd
Part of the Communication Sciences and Disorders Commons
Recommended Citation Recommended Citation
Kwok, Elaine Yuen Ling, "Auditory Temporal Processing in Children with Specific Language Impairment Compared to Same-Age Controls" (2013). Electronic Thesis and Dissertation Repository. 1379. https://ir.lib.uwo.ca/etd/1379
This Dissertation/Thesis is brought to you for free and open access by Scholarship@Western. It has been accepted for inclusion in Electronic Thesis and Dissertation Repository by an authorized administrator of
Auditory Temporal Processing in Children with Specific Language Impairment
Compared to Same-Age Controls
(Thesis format: Monograph)
by
Elaine Yuen Ling Kwok
Graduate Program in Health and Rehabilitation Sciences
A thesis submitted in partial fulfillment
of the requirements for the degree of
Master of Science (Child and Youth Health)
The School of Graduate and Postdoctoral Studies
The University of Western Ontario
London, Ontario, Canada
Abstract
It has been proposed that impaired language development in children with
Specific Language Impairment (SLI) originates from immature auditory temporal
integration (ATI), but results are inconsistent. We compared electroencephalographic
data from 25 children with SLI aged 6-11 years to 25 typically developing peers.
Participants’ neural responses to a 50ms tone presented alone were compared to their
responses to two tones separated by silent gaps of 100, 200, 300 or 400ms. Amplitude
and latency of P1 and N2 responses to single tones and tone pairs were compared across
groups and gap conditions. The groups did not differ in the amplitude or latency of their
responses to the second tone in any gap condition. Both groups showed attenuated, but
present, responses to the second tone even in the shortest gap condition. Although results
did not provide evidence for ATI impairments in SLI, further research using smaller gaps
is required.
Keywords: Auditory Temporal Integration (ATI); Specific Language Impairment (SLI);
Acknowledgments
I would first like to express my deepest gratitude to my Master’s thesis
supervisor, Dr. Janis Oram Cardy for her advice and guidance throughout my study. I
have greatly benefited from working with such a devoted, knowledgeable, insightful and
considerate lead researcher in the field of study.
Secondly, I would like to thank my advisory committee: Dr. Lisa Archibald and
Dr. Marc Joanisse who have provided excellent direction and input to this work. Thank
you very much for the continuous patience and help particularly during the absence of
Dr. Cardy.
Lastly but not least, I would also like to express my gratitude for all the members
of the Autism Spectrum and Language Disorders Lab: Charity, Heather, Jackson, Jessi,
Jillian, Margot and Rachael. Thank you for all the help, support and advice I received
Table of Contents
Abstract……….………..ii
Acknowledgements………...……….iii
List of Tables………..vii
List of Figures………..………..viii
List of Appendices………..ix
Introduction….……….1
Characteristics of Specific Language Impairment (SLI)…….………1
Auditory Temporal Integration (ATI)………..2
ATI and Language Learning………3
Event Related Potential Studies………..8
ATI studies focusing on Mismatch Negativity (MMN)………..8
ATI studies focusing on Cortical Auditory Evoked Potentials (CAEP)…13 Purposes of This Study………..………...….16
Method….………..……18
Participants……….18
Procedures………..…20
Conditions………..………21
EEG Recording………..…………22
Data recording and online processing………23
Offline Processing and Data Analysis………...23
EEG waveform offline processing………23
Principle Component Analysis (PCA) of individually subtracted waveforms………...23
Results….………..…….25
PCA on Second Tone Responses………..25
Analysis of mean amplitude………...30
Analysis of peak latency………..37
Analysis of maximum amplitude………...41
Summary of Analyses……….44
Discussion….………..…….45
ATI Impairment in SLI Compared to Controls………..………..46
Is ATI not impaired in SLI? ...………..…………...47
Impaired detection of rapidly presented stimuli in SLI………….50
P1 and N2 as a Neural Indicator of ATI…………...53
Comparison of Our TD Data to the Literature…………...54
Difference in tonal frequency and duration………...55
Difference in tone intensity (Loudness)………...56
Limitations and Future Directions……….57
References………..………61
Appendices….………..………..………69
List of Tables
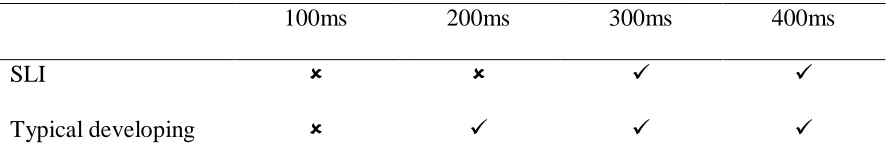
Table 1. Expected result for P1 and N2 amplitude to the second tone in TT conditions
analysis.………..….18
Table 2. Participant demographic information……….…….20
Table 3.Mean amplitude of P1 over latency range 64 to 148ms for selected channels…33
Table 4. Mean amplitude of N2 over latency range 208-296ms for selected channels….36
Table 5. Summary of P1and N2 latencies in TD and SLI (channel Fz only)…………..39
Table 6. Maximum amplitude of P1and N2 in subtracted two tone waveforms (channel Fz
List of Figures
Figure 1. Stimuli Paradigm………....22
Figure 2a. Grand average waveform of TD group across selected channels. …………...26
Figure 2b. Grand average waveform of SLI group across selected channels…………....27
Figure 3a. Topographic images of subtracted waveform of TD group.………28
Figure 3b. Topographic images of subtracted waveform of children with SLI.………..29
Figure 4a. Grand average of OT and subtracted TT waveform of TD group…………..31
Figure 4b. Grand average of OT and subtracted TT waveform of SLI group…………..33
Figure 5. Grand average waveforms showing main effect of channels across conditions
for the period 64ms to 148ms (P1)………..………..34
Figure 6. Interaction effect of channel by condition for mean P1 amplitude…………34
Figure 7. Grand average waveforms showing main effect of channels across conditions
for the period 208ms to 296ms (N2)………..………38
Figure 8. Interaction effect of channel by condition for mean N2 amplitude ………….38
Figure 9. P1 peak latencies at channel Fz across conditions..………...…………40
Figure 10. N2 peak latencies at channel Fz across conditions..……….…...……….41
Figure 11. Maximum P1 amplitude at channel Fz across conditions……….……...……43
List of Appendices
Appendix A: Matched TD and SLI participants information………..………..69
Appendix B: Quantile-Quantile plots of showing distribution of second tone P1
amplitude at TT100, N2 amplitude at TT100, N2 amplitude at TT200 condition………70
Appendix C: Ethics approval………72
Appendix D: Letter of information and consent form………...73
Introduction
Characteristics of SLI
Specific language impairment (SLI) is a language disorder affecting 7% of
individuals, with higher prevalence in males than females. These individuals experience
difficulties acquiring language despite otherwise normal development in cognitive,
neurological and hearing abilities and irrespective of socioeconomic status (Leonard,
2000). It has been reported that individuals with SLI have increased risk for difficulties in
academic learning (Conti-Ramsden, Knox, Botting, & Simkin, 2000; Young et al., 2002)
and establishing friendships (Fujiki, Brinton, & Todd, 1996).
Many studies have investigated and characterized the language impairment in SLI
from different perspectives. Some studies have centered on biological origins. Familial
studies showed some linkage of language impairment within family members, suggesting
a role of genetics. For example, a region on chromosome 7 that contains a gene, FOXP2,
has shown to be mutated in some families in which multiple members have language
impairment (O’Brien, Zhang, Nishimura, Tomblin, & Murray, 2003). Neuroanatomical
abnormalities have also been observed in individuals with SLI, particularly in
language-relevant areas such as Broca’s area (Bishop, 2006). From a linguistic perspective,
English-speaking individuals with SLI have been described as demonstrating a lesser
extent of impairment in vocabulary and phonology development as compared to syntax
and grammatical morphology (e.g., past tense), and to display more impaired expressive
than receptive language (Leonard & Weber-Fox, 2008). Studies that focused on cognitive
underpinnings have showed that these individuals demonstrate impairments in multiple
SLI have been noted to be impaired in both verbal short-term and working memory
(Archibald & Gathercole, 2006) and to have slower response time to various processing
tasks (Leonard & Weber-Fox, 2008; Miller, Kail, Leonard, & Tomblin, 2001). Other
studies have suggested that individuals with SLI have poor attention (e.g., Shafer, Morr,
Datta, Kurtzberg, & Schwartz, 2005).
One theory of particular interest to the present study relates to the auditory
processing ability of individuals with SLI. Studies have indicated that children with SLI
have poor frequency discrimination ability (McArthur & Bishop, 2004) and such ability,
though maturing with age, shows persistent impairments into adolescence compared to
age-matched controls (Hill, Hogben, & Bishop, 2005). Other studies have focused on the
proposal that individuals with SLI are specifically impaired in their ability to process
auditory stimuli that occur in rapid succession, a theory that is explored from a
neurophysiological perspective in the present study. The sections that follow review
literature on temporal integration of auditory stimuli, as well as behavioral and
neurofunctional studies involving individuals with SLI that inspired the design of the
present study.
Auditory Temporal Integration
Early behavioral studies of auditory processing involved measuring participants’
reports on the loudness and pitch of auditory signals that were presented at varying
durations and with varying time gaps between stimuli. Results revealed that auditory
signals are integrated if presented rapidly. This phenomenon was termed Auditory
Temporal Integration (ATI) (Cowan, 1984). For example, Zwishlocki (1960) conducted
successive tone bursts presented with varying time gaps between them. Participants
reported an increased loudness when the two tone bursts were presented at gaps shorter
than 200ms (Zwislocki, 1960). It was proposed that this perception of increased loudness
resulted from auditory summation of the two tones. That is, when neurons are first
activated in response to the primary tone, and before they return back to an inactivated
state, the second tone stimulates them to fire again, resulting in overall signal summation.
As a result, the activation of the second stimulus is combined with the residue activation
of the first stimulus leading to a perceived increase in tone loudness (Zwislocki, 1969).
This and other behavioral studies estimated that integration occurs in typical
adults when auditory stimuli are presented within a roughly 200-300ms window (see
Cowan, 1984 for a review) and this window decreases with increasing age (Trehub,
Schneider, & Henderson, 1995). Later neural evidence confirmed the existence of the
window and showed that auditory signals are integrated as unitary percepts if presented
within the integration window (i.e., cannot be distinguished as separate signals), but are
processed independently if presented outside of the window (Winkler, Czigler, Jaramillo,
Paavilainen, & Näätänen, 1998; Yabe, Tervaniemi, Reinikainen, & Näätänen, 1997).
Therefore, a shorter window of ATI will provide higher resolution for the processing of
auditory signals. Putatively, this higher resolution is important for language learning.
ATI and Language Learning
The importance of ATI to language acquisition has been proposed through a
number of behavioral studies involving individuals with SLI. A number of studies have
suggested that individuals with SLI have an immature ATI. For example, Tallal and
were of the same or different pitch. Typically developing children performed
significantly better than chance when the tones were separated with a silent gap as short
as 8ms, whereas children with SLI required a significantly longer silent gap between
tones (>300ms)1 to reach the same level of accuracy. A similar impairment in temporal
processing ability has also been shown by other behavioral studies in individuals with
SLI (reviewed by Leonard, 2000; Tallal, Miller, & Fitch, 1993).
The role of ATI in language development was further examined in longitudinal
research conducted by Benasich and Tallal (2002). They studied ATI in infants at 6-12
months with or without a family history of language impairments, and later examined
their language performance at 2-3 years of age. To study ATI in infants, an operant
conditioning paradigm was used, where the infants were trained to turn their head
towards a visual reinforcer when presented with a tone pair (left for 100Hz tone followed
by 300Hz; and right for 300Hz tone followed by 100Hz). Blocks of randomized order
tone pairs were presented with varying silent gaps between the tones to determine their
threshold of ATI. When tones were presented at silent gaps shorter than their ATI
window, infants performed no better than chance. Result indicated that the ATI window
of infants with a family history of language impairment was longer than for those
without. Importantly, the ATI window at this early age was predictive of later language
performance on a standardized language test at 2 year of age, regardless of family history
1
of language impairment (Benasich & Tallal, 2002). This study suggested that early
development in processing of rapidly presented fundamental auditory stimuli plays an
important role in language development.
Although a causal link between ATI and language acquisition has not been
established, one of mechanism has been proposed to account for the effect of immature
auditory temporal processing on language acquisition in individuals with SLI. Tallal et al.
(1993) suggested the link between the two lies in the less efficient processing of
phonemes, which are the smallest contrastive units in spoken language (Tallal et al.,
1993; Tallal, 1999). Tallal and Piercy (1974) conducted an experiment in which they
trained 6-9 year old participants (typically developing or SLI) to press buttons
corresponding to computer-generated speech stimuli. The first pair of stimuli was the
vowels /Ɛ/ and /æ/, which had steady-state frequencies throughout their presentation.
Participants with SLI performed no different from the controls in distinguishing this pair
of speech stimuli. The second pair of stimuli was the syllables/ba/ and /da/, which
differed only in the initial 40ms for the corresponding frequencies of consonants b and d.
Result showed that all 12 typically developing participants but only 2 out of 10
participants with SLI reached criterion (75% correct) after training. Participants with SLI
also reported hearing no difference between the two consonant syllables (Tallal & Piercy,
1974). Tallal and her group also performed more experiments on speech stimuli and
showed similar impairments in individuals with SLI (see Tallal et al., 1993 for a review).
Tallal, Stark and Mellits (1985) found a high correlation (r=0.85) between
performance on tasks for discriminating rapidly presented (speech and non-speech)
SLI (Tallal, Stark, & Mellits, 1985). Taken together, the evidence from speech and
non-speech ATI experiments suggest that individuals with SLI may have an immature ATI
window that restricts their ability to perceive rapid transitions of information in speech
sounds, hence contributing to difficulties in learning language (Tallal et al., 1993).
Several other behavioral research studies were conducted to investigate the causal
relationship between ATI and language impairment, however, not all results showed that
individuals with SLI have impairment in ATI. A handful of studies found that individuals
with SLI performed no different from TD controls on ATI tasks (see McArthur &
Bishop, 2001 for a review). For example, Norrelgen et al. (2001) used a similar frequency
determination task of two successive tones to that used in Tallal and Piercy (1973),
involving shorter (20ms) and higher frequencies tones (878Hz and 1350Hz). Participants
were asked to report if the two sucessive tones were same or different in pitch. A speech
perception task was also included, where participants were presented two sucessive same
or different consonant-vowel pairs (e.g. /pa/ followed by /ba/) with the same seperation
time gap as the tone pairs, and participants were asked to report if the vowel pairs were
the same or different. In their first experiment, they assessed the correlation between the
tonal and speech perception tasks. Result showed a normal distribution of performance
on frequency determination of rapidly presented tones in the TD population, challenging
the uniqness of impairments of ATI to the language impaired population. In addition, the
authors also found that performance on the rapid tones task was only weakly correlated (r
= 0.35) with the speech perception task. The author argued that under the proposed causal
relationship between ATI development and phonological awareness, a strong correlation
experimental tasks suggested an indirect relationship that involves other factors that the
author did not examine, such as age of the participants.
In their second experiment, Norrelgen et al. investigated the relationship of ATI
and language development. Performance of TD participants on rapidly presenting tones
task was correlated to several language measures. Results revealed that only phonological
awareness was significantly correlated with ATI task performance (r = 0.47). Results of
this second experiment suggested that the relationship between ATI performance and
language development is limited to level of phonological processing and may not be
relevant to higher order language aspects such as lexical and receptive grammar
development. Using the same tonal and consonant-vowel paradigm, Norrelgen, Lacerda
and Forssberg (2002) compared the performance of a group of individuals with SLI to a
same-age typically developing group. Results revealed that there was no group difference
in performance. Both groups showed equal levels of difficulty in identifying the pitch of
two successive tones that were presenting with a silence gap smaller than 64ms.
Similarly, performances on the speech perception task greatly overlapped between the
two groups and no group difference was observed.
Some other studies have suggested that only a subgroup of individuals with SLI
have impairment in ATI compared to controls. For example, McArthur and Hogben
(2001) found that only individuals with SLI who show poor reading performance have
impairments in ATI compared to controls. Therefore, the proposed link between impaired
ATI and impaired language development has not received consistent support from
Some researchers have suggested that at least a subset of individuals with SLI
may have poor attention or motivation, which could contribute to the inconsistency of
findings in behavioral studies of auditory processes (McArthur & Bishop, 2005). One
behavioral study demonstrated impairments of ATI in children with attention-deficit/
hyperactivity disorder who do not have co-occurring SLI (Oram Cardy, Tannock,
Johnson, & Johnson, 2010). This result highlighted that the use of behavioral responses
as an indicator of ATI impairment may not reflect the underlying language or auditory
processing impairment of an individual but rather the level of attention. Other traits of
SLI that may also limit performance on behavioral tasks include immature motor control
(see Hill, 2001 for a review) and slow processing speed (Miller et al., 2001). To avoid
this potential confound, some studies employed a passive paradigm through the use of
electroencephalography (EEG) to capture the brain’s response to auditory signals in the
absence of a behavioural response.
Event Related Potential Studies
One neural marker for auditory processing is the late auditory evoked potentials
(LAEP), which are electrical potentials generated from the brain in response to auditory
stimuli, predominantly originating from auditory cortex in the temporal lobe (Picton,
2010). Of the many components in the LAEP, mismatch negativity (MMN) and cortical
auditory evoked potentials (CAEP) such as P1 and N2 are often the focus in studies
examining temporal integration.
ATI studies focusing on Mismatch Negativity (MMN). Mismatch Negativity is
an evoked response occurring at roughly 100 to 200ms after the presentation of auditory
active involvement of the brain in discriminating auditory stimuli (Burkard, Don, &
Eggermont, 2007). MMN was first reported by Näätänen, Gaillard and Mäntysalo in
1978 using an oddball paradigm where they presented, in a stream of standard stimuli, an
infrequently occurring deviant stimulus (an auditory stimulus slightly louder or higher in
pitch than the standard). MMN is the residual negative component after subtracting the
auditory evoked potential of the standard stimuli from that of the deviant stimuli. It is
suggested that MMN represents the brain’s discrimination of a stimulus as different from
the short term auditory memory trace of what has come before (i.e., the standard;
Näätänen, Paavilainen, Rinne, & Alho, 2007; Näätänen, 2003).
Some studies have used MMN as an indicator of auditory processing in typically
developing children. Wang, Datta, and Sussman (2005) used a modified oddball
paradigm where adults and typically developing children aged 5-8 and 9-11 years were
presented with different blocks of trials, each varying in the length of a silent gap
between two stimuli. A total of six gaps were studied: 100, 150, 200, 250, 300, and
350ms2. In each trial within the same block, all successive stimuli were presented at one
of the six gaps. Standard stimuli (440Hz 80db) were presented 85% of the time. A double
deviant stimulus, which was made up of a frequency deviant (490Hz 80db) followed by
an intensity deviant (440Hz, 60db), randomly occurred 15% of the time. In trials of tones
separated by a silent gap shorter than the participant’s ATI window (i.e., successive
auditory stimuli will be perceived as unitary), the double deviant triggered only one
MMN response. By contrast, two MMN responses were observed for stimuli presented
2
with a silent gap longer than that participant’s ATI window. Results indicated a
developmental maturation of the window of ATI in the typically developing population,
with an estimated window in adults, 9-11 year olds, and 5-8 year olds to be less than 150,
250 and 300ms, respectively (Wang, Datta, & Sussman, 2005). A similar estimate of the
window of ATI in adults (<200ms) was also observed in another MMN study using a
similar paradigm (Winkler et al., 1998).
Only a few MMN studies have directly compared ATI in individuals with SLI and
typically developing individuals. Using an oddball paradigm with a frequency deviant
(standard 500Hz , deviant 553Hz), Korpilahti and Lang (1994) showed that children with
SLI aged 7-13 years old had a significantly attenuated MMN amplitude at a presentation
gap of 350ms compared to age matched, typical controls. Similarly, Benaisch et al.
(2006) found that 6-month old infants at with a family history of language impairment
produced a MMN response to a frequency deviant (standard 100Hz, deviant 300Hz) that
was smaller in amplitude than that of infants without a family history of language
impairment, for trials with shorter gaps between tones (70ms) but not longer gaps
(300ms).
Consistent with behavioral studies, results of these MMN studies have indicated
that the window of ATI matures with age, and individuals with SLI have an immature
ATI window compared to age-matched typically developing individuals. One other
MMN study has been conducted on individuals with SLI. Uwer, Albrecht, and Von
Suchodoletz (2002) used both frequency deviants as well as duration deviants and found
no significant difference in MMN amplitude between individuals with SLI and typically
(around 900ms), so it may not have captured the developmental difference in auditory
integration of the two groups.
What remains uncertain from the aforementioned MMN studies is whether
individuals with SLI were impaired in their ability to detect or to discriminate rapidly
presented tones. There is some debate as to whether MMN is a neural indicator of
auditory detection of rapidly presented tones. The detection of a mismatch in auditory
stimuli recruits two cognitive functions: first, the formation of an auditory memory trace
of the standard stimulus, and second, the ability to detect a difference between the deviant
stimulus and existing memory. An early study showed that the MMN response in an
oddball paradigm did not vary in conditions where participants were asked to attend to
the auditory signal or when they were distracted by performing a simultaneous visual
task. This result and other studies suggested that MMN is an automatic response that does
not require conscious attention (Alho, Woods, Algazi, & Näätänen, 1992). However,
more recent evidence has suggested that MMN is not entirely attention-independent.
When participants were asked to attend to different aspects (e.g., pitch or pattern) of the
same oddball paradigm, MMN responses varied, and were not elicited in the condition
where the participants’ attention was drawn to the presentation pattern of the paradigm
(Sussman, Winkler, Huotilainen, Ritter, & Näätänen, 2002). This suggested the
involvement of selective attention to the auditory stimuli in MMN production. Later on, it
was further clarified that attention modulates the formation of auditory memory of the
standard stimuli, in turn altering the deviance detection process and leading to varying
MMN responses. Therefore, it has been recommended that future research should not
Bishop (2007) reviewed the auditory processing literature on SLI involving MMN
studies, and commented that the choice of frequency deviants also contributed to the
inconsistency in the literature. It has been shown that significant group differences in
MMN between individuals with SLI and controls was only observed in paradigms that
used a deviant that was less than 10% different in frequency compared to the standard
stimuli; no group difference was observed for larger frequency differences. This is
particularly concerning given that other studies have suggested individuals with SLI have
poor frequency discrimination (e.g., McArthur & Bishop, 2004). There is debate as to
whether the MMN difference between groups results from poor frequency discrimination
or if it reflects the inability of individuals with SLI to detect the frequency deviant
because of short presentation time. Many suggested that the focus of MMN experiments
is on discrimination, rather than simple detection, of auditory signals (for example,
Bishop & McArthur, 2005). Thus, MMN evidence showing an impairment of ATI in
individuals with SLI may reflect a disability in auditory discrimination rather than the
simple detection of auditory stimuli. Paradigms other than MMN, such as the one used in
the present study, are required in order to determine whether children with SLI are also
impaired at the level stimulus detection.
Another limitation with the use of an oddball paradigm for examining ATI is the
necessity of collecting many trials. Since MMN is only observed during deviant trials,
which must occur infrequently in any experimental blocks, MMN experiments contain
many trials of standards in order to obtain enough deviant trials for analysis. In order to
identify the gap durations at which a participant does versus does not show a MMN
the ATI threshold. However, a lengthy experiment is not readily tolerated by young
children or functionally compromised participants. Bishop (2007) also pointed out that
studies using MMN have generated inconsistent findings on the ATI ability of individuals
with SLI due to a restricted number of trials available for analysis, thus, conclusions are
often limited by noise in the data.
ATI studies focusing on cortical auditory evoked potentials (CAEP). A
handful of studies have investigated the use of a pre-attentive neural indicator of stimulus
detection such as cortical auditory evoked potentials (CAEP). CAEP emerge starting
around 50ms post-stimulus and last until 500ms post-stimulus, and reflect the earliest
processing of stimuli in the auditory cortex (Picton, 2010). These potentials are
considered sensory-evoked potentials, reflecting the fact that these potentials are
obligatory and fundamentally dependent on the features of the auditory stimuli (Burkard
et al., 2007).
Among the many components in the CAEP, P1 and N2 are the most prominent in
the auditory evoked potential waveforms of children under 13 years and thus were chosen
as the focus in this study. Although N1 and P2 are also found in adult CAEP, these
components do not clear emerge until adolescence, so were not investigated in this study
(Albrecht, Suchodoletz, & Uwer, 2000; Sussman, Steinschneider, Gumenyuk, Grushko,
& Lawson, 2008). P1, a positivity that peaks around 80-110ms post-stimulus (Ponton,
Eggermont, Kwong, & Don, 2000), is believed to be generated in Heschl’s gyrus
(Albrecht et al., 2000), part of the secondary auditory cortex. Since P1 has been shown to
be present even when participants are sleeping, it has been proposed to reflect
Townsend, 2005). At 220-270ms post-stimulus onset, N2 is observed, which is a
negative-going component reflecting perception of the auditory signal, and has been
suggested to originate from primary auditory cortex (Ruhnau, Herrmann, Maess, &
Schröger, 2011).
Fox et al. (2010) examined the ATI window in typically developing children aged
7-9 years and adults by observing the CAEP. Brain responses were recorded in children
when presented with a single 1000Hz tone, and six conditions of two identical 1000Hz,
20ms tone pairs separated by varying length of silent gaps (25, 50, 100, 200, 400, and
800ms). Individual CAEP to the single tone was subtracted from the response to tone
pairs, and the residual average P1 amplitude corresponding to the timing of the second
tone presentation (i.e., P1 response to the second tone) was measured. In cases where the
tone pair is presented within the child’s ATI window (two tones will be perceived as a
unit) a second tone response will be absent, and thus no residual P1 amplitude should be
observed. On the contrary, if the tone pair falls outside of the child’s integration window,
the two tones will be perceived as separate units, hence, a second P1 response to the
second tone will be present. Results revealed that the average P1 amplitude to the second
tone increased with increasing silent gap duration between tones and was not
significantly different from zero in typically developing children when the tones were
separated by a gap of less than 200ms, suggesting that 200ms is the threshold of the
window of temporal integration in children of this age group. Similar analysis on the N1
component was conducted on adult data and showed that the window of ATI was shorter
Fox et al.’s (2010) findings were consistent with above mentioned Wang et al.
(2005) MMN study. In addition to MMN, Wang et al. also analyzed P1 amplitudes on the
grand averaged standard stimulus trials of different tone gaps. In adults and 9-11 year old
children, P1 amplitude increased with increasing silent gap between tones and P1
amplitude from trials with shorter silent gaps between tones (<150ms) was significantly
smaller than that from longer gaps (>200ms), suggesting the ATI window in children
aged 9-11 years is less than 200ms. However, no such difference in amplitude was
observed in 5-8 year old children across any tested silent gaps, possibly because the
difference in P1 amplitude can only be observed in smaller tone gaps (e.g., 200ms) which
were not included in the experimental procedure of this age group. Both Fox et al. and
Wang et al. demonstrated the use of P1 as a neural indicator of processing of rapidly
presenting tones. The same window of temporal integration was indicated in Fox et al. on
a slightly younger group of typical children. This is likely due to the use of different
auditory stimuli (Fox et al. used shorter and higher frequency stimuli compared to Wang
et al.), highlighting that the window of temporal integration is specific to the stimuli
properties.
Oram Cardy, Flagg, Roberts, Brian and Roberts (2005) conducted a
magneto-encephalography (MEG) experiment on individuals with language impairment aged 8 to
17 years using two identical tones (1000Hz) presented with a separation gap of 150ms.
They reported that a M50 response (a magnetic equivalent of P1) to the second tone in
the pair was observed in significantly fewer individuals with SLI (34%) than same age
studies suggest the possibility of using the P1 amplitude as an indicator of ATI in both a
typically developing population and individuals with SLI.
In the Korpilahit and Lang (1994) MMN study mentioned above, the grand
average waveforms of standard trials showed a significant positive peak at 100ms and a
negative peak at 250ms (N2) post-stimulus that was observed in both SLI and control
groups. P1 and N2 average amplitude and peak latencies in the standard trials were also
analyzed. At a 350ms presentation gap between tones, children with SLI aged 7-13 years
compared to their TD peers showed a significant delayed N2 peak but no group
differences were observed in P1 amplitude, P1 latency, or N2 amplitude. Unlike the
above mentioned CAEP studies, result from this study shows that P1 amplitude was not a
sensitive neural indicator and that analysis on peak latency may reflects a group
difference.
Purposes of This Study
The purposes of this study were 1) to further examine ATI in children with SLI
compared to typically developing peers; and 2) to investigate the use of P1 and N2 as
neural indicators of ATI at the level of stimulus detection. Past behavioral studies have
suggested immature ATI in individuals with SLI, but methodology has possibly been
limited by attention and motivation confounds. Using a passive paradigm, a few
mismatch negativity (MMN) studies have suggested a similar impairment, however, the
lengthy experimental procedure may not be readily tolerated by children. In addition,
results reflect an impairment at the level of discrimination of auditory information, but do
not indicate whether impaired ATI is also observable at a more fundamental level of
detection. Here, we further examined the role of ATI in SLI using a short and passive
paradigm, and measured the cortical P1 and N2 responses, in order to characterize the
ability of individuals with SLI to detecting rapidly presented tones.
Past studies showed that typically developing children aged between 5 and 8 years
integrated auditory stimuli presented in a time gap smaller than 300ms (Wang, 2005) and
children aged 7 to 9 years integrated stimuli presented with a gap less than 200ms (Fox,
2010). Therefore, we used four gaps ranging from 100 to 400ms to estimate the AWI in
children aged 6-11 years old who were typically developing or had SLI. In order to
isolate the neural response to the second tone from that to the first tone, we adopted the
subtraction and Principal Component Analysis method reported by Fox et al. (2010, see
Methods section for further detail). In addition to the four blocks of two tones with
different time gaps between tones, every participant was also presented a block where
only one tone was presented. Mean amplitude, maximum amplitude, and peak latency of
the P1 and N2 responses to the second tone were compared across the four silent gap
conditions and between the groups.
We hypothesized that children with SLI would demonstrate immature ATI
compared to typically developing, same-age controls. Specifically, children with SLI
would need a longer presentation time gap between two successive tones to elicit P1 and
N2 responses to the second tone. Therefore, compared to same age peers, children with
SLI would demonstrate a smaller average and maximum amplitudes of the P1 and N2
responses, as well as a delayed latency of the P1 and N2 peaks in response to the second
tone in the 200ms gap condition, but no group differences would be observed in the
and N2 responses to the second tone) or the longer silent gap 300 and 400ms conditions
(where both groups would show evoked responses to the second tone). In other words, we
predicted that children with SLI would show evoked P1 and N2 responses to the second
tone only when it occurred at least 300ms after the first tone, while children with typical
development would show these responses at gaps of 200ms or greater (see Table 1 for a
summary of our hypotheses). We also expected to see an increase in amplitudes of P1 and
N2 responses to the second tone as the silent gap between tones increased.
Table 1
Expected result for P1 and N2 amplitude to the second tone in TT conditions analysis.
100ms 200ms 300ms 400ms
SLI
Typical developing
Note: represents an absence of P1 and N2 responses to the second tone. represents
the presence of P1 and N2 responses to the second tone.
Method
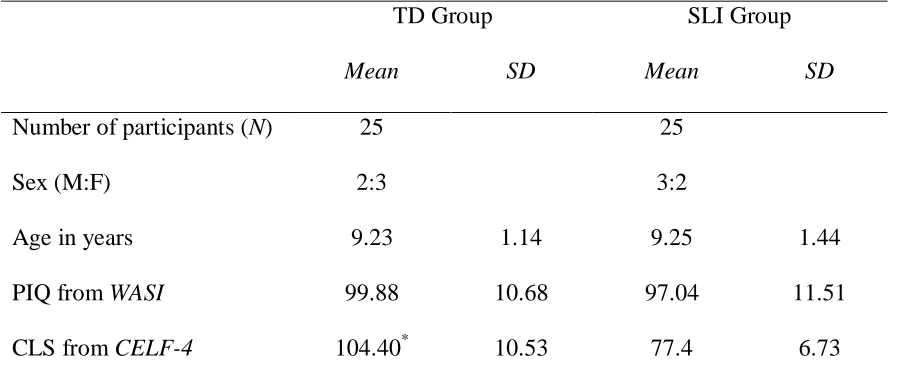
Participants
A total of 50 children, aged between 6 and 11 years old, participated in the study.
Of these, 41 were recruited from an existing database developed as part of a larger study
examining language, reading, and math in school age children (Archibald, Oram Cardy,
Joanisse, & Ansari, submitted) and nine through personal connections. A total of 25
children with typical development (TD; 10 males; age: M = 9.23 years, SD = 1.14) and 25
1.44) participated. All participants in this study were reported by their parents to be
primary English speakers, and to have no neurological, hearing, visual or global cognitive
impairments. As well, all participants scored 85 or above on the Performance IQ (PIQ)
scale from the Wechsler Abbreviated Intelligence Scale (WASI; Wechler, 1999)
administered within six months of the study. PIQ was computed from the child’s
performance on two subtests: Block Design, in which the child arranged blocks to match
a model, and Matrix Reasoning, which involved choosing a picture to complete a
pattern. The two groups did not differ on age, t(48) = 1.14, p = 0.951, or PIQ, t(48) =
0.904, p = 0.37.
Within six months of the study, all participants completed the four subtests from
the Clinical Evaluation of Language Fundamentals-4 (CELF-4; Semel, Wiig, & Secord,
2003) required to compute each child’s Core Language Score (CLS). In the Concepts and
Following Directions subtest, the child pointed to pictures in accordance with a spoken
instruction. For Recalling Sentences, the child repeated sentences immediately after
hearing them, and for Formulated Sentences, orally created a sentence using a given
word. Children under nine years completed the Word Structure subtest involving
completing a sentence with the grammatically correct word form, and those nine years
and over completed the Word Classes 2 subtest involving identifying which two of four
words had a related meaning. Children whose standard score on the CLS was below 85
were included in the SLI group, and those with scores at or above 85, in the TD group.
As expected, the group with SLI had a significantly lower CLS than the group with TD,
t(48) = 10.803, p < 0.001.Table 2 summarizes the descriptive statistics of participants in
Table 2
Participant demographic information
TD Group SLI Group
Mean SD Mean SD
Number of participants (N) 25 25
Sex (M:F) 2:3 3:2
Age in years 9.23 1.14 9.25 1.44
PIQ from WASI 99.88 10.68 97.04 11.51
CLS from CELF-4 104.40* 10.53 77.4 6.73
Note: TD – Typical development; SLI – Specific Language Impairment;
* p < 0.001
Procedures
All participants completed one individual session of approximately three hours in
the Siemens Hearing Research Clinic at Western University’s National Centre for
Audiology. EEG recordings in response to auditory stimuli in each of five conditions
were completed first. In cases when the most recent testing available in the database was
older than six months, the standardized tests described above were administered. Upon
arrival, the child and his/her parent(s) were given a tour of the lab and a brief description
of the experimental procedure. Parents were asked to read and sign a consent form, and
children signed an assent form. The child was given several breaks throughout the visit in
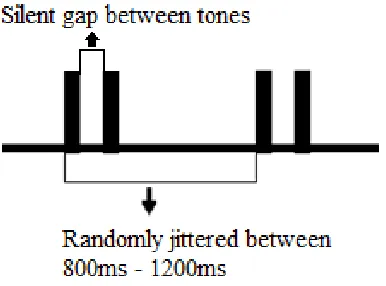
Stimuli. Auditory stimuli consisted of a single 50ms 440Hz pure tone presented
either alone in the one tone (OT) condition, or followed by a second 50ms, 490Hz pure
tone in the two tone (TT) condition. Both tones were recorded with a gradual 0-100%
increase in amplitude within 10ms after the onset of the tone then a decrease in amplitude
during the final 10ms of the tone (i.e., onset/offset ramps of 10ms). The auditory stimuli
were created using Praat software (Boersma & Weenink, 2011) with a sampling rate of
41.1 kHz. Intensity of stimulus presentation was determined individually. Before
presenting the experimental trials, participants performed an auditory threshold task in
which the 440Hz tone was presented at varying volumes, starting at 50dB. The child was
asked to press a button to indicate detection. The quietest threshold at which the child
reliably responded to the tone was determined through a staircase procedure. Loudness
was decreased by 10dB in cases of detection, and increased by 5dB in cases where no
tone was detected, until the lowest intensity at which the child showed two correct
detections was determined. The intensity of the auditory stimuli used in that child’s
experimental trials was then presented as 50dB above this detection threshold (i.e., 50dB
SL).
Conditions. Each participant was presented with five blocks of stimuli, which
included a OT block and four TT conditions. Tones in the TT conditions were separated
by silent gaps of either 100, 200, 300, or 400ms. The OT condition was presented first (5
minutes), followed by the four TT blocks in random order. The lengths of the TT blocks
were roughly 5 minutes each and the participants were given breaks in between blocks.
Throughout the blocks, a soundless movie of the child’s choice was played on the
tones, and were encouraged to sit still and pay attention to the movie. Each block (OT,
TT100, TT200, TT300, TT400) was composed of 250 trials of the tone or tone pair
stimuli. The delivery gap between trials was randomly jittered between 800 to1200ms to
avoid anticipatory ERP effects. Figure 1 illustrates the TT stimulus paradigm.
Figure 1. Stimulus Paradigm
EEG Recording. The EEG was recorded using a 128-channel channel
DenseArray system with HydroGel Geodesic Sensors (Electrical Geodesics, Inc. Eugene,
USA). First, the child’s head circumference was measured, and the center point of the
scalp was measured and marked with a non-permanent pencil. A sensor net that best fit
the child’s head circumference was soaked in soapy distilled water with KCl salt for 5
minutes before being placed on the participant’s head. The central electrode (VRCF) was
placed above the marked center point of the scalp for positioning of the cap on the
participant’s head. After placement of the net, the participant was asked to sit in a
comfortable chair in an electrically shielded, sound proof testing booth throughout the
experiment. Auditory stimuli were presented binaurally using E-Prime software
Research, Illinois, USA) that were inserted into both ears. Participants were given breaks
in between every block, and impedance was checked after completion of every two
blocks of experimental trials.
Data recording and online processing. The HydroGel Geodesic Sensor net was
connected to an amplifier sending EEG recordings to a Mac computer running NetStation
(Electrical Geodesics, Inc. Eugene, USA), the software used to record
electrophysiological data during the experiment. Data were recorded at 250Hz, with an
online bandpass filter of 0.1-100Hz and 60Hz notch filter. Impedance of the channels was
adjusted to below a threshold of 75Ω.
Offline Processing and Data Analysis
EEG waveform offline processing. The raw EEG waveforms were processed
offline. First, raw data were filtered through a 2-30Hz off-line finite impulse response
filter. Then the filtered waveforms were segmented into epochs of 1200ms, from 200ms
pre-stimulus to 1000ms after the presentation of the first tone. The epochs underwent
physiological artifact removal for eye blinks (>140μV) and eye movement (>55μV), and
rejection of bad channels (>200μV) for later analysis. Responses recorded in each
channel were referenced to the average of all 128 channels. Individual trials in the same
block of stimuli were averaged together individually (i.e., individual average waveforms
for the OT and the four TT conditions were calculated for each participant).
Principle Component Analysis (PCA) of individually subtracted waveforms.
PCA analysis was performed similar to that reported by Fox et al. (2010), with a focus on
the positive component P1 and negative component N2 of the CAEP. Due to the short
ERP response overlaps with the first tone response. To extract the second tone response,
each participant’s ERP response to the OT was subtracted from their TT response. The
subtracted waveforms were baseline corrected to 50ms before onset of the second tone.
Time was reassigned to zero at the onset of the second tone. Then, subtracted waveforms
of all conditions at the midline and lateral sites (Fz, Cz, Pz, T7, T8) for all participants
were entered into a PCA, a mathematical program that identifies patterns in data. A total
of 1000 cases were entered into the PCA analysis (5 channels, 4 TT conditions, 50
participants). Mahalanobis distance was calculated for outlier identification with a critical
threshold of 0.98, and 212 cases were rejected from the estimation of the PCA
components. The number of outlier cases identified in our analysis was considerably
higher than reported by Fox et al. (2010), however, it is unclear what outlier threshold
they used. Based on the covariance matrix, with Varimax rotation of the factors,
components were generated from a MATLAB program (The MathWorks, Inc). The
latency range of components generated from PCA analyses that were consistent with
previously reported latencies of P1 and N2 (Ponton et al., 2000) were chosen for further
analysis. Average amplitude under these PCA-generated latency ranges of P1 and N2,
was calculated using EGI Net Station Waveform Tools (version 4.5; EGI, Inc), and
analyzed using repeated measures ANOVA in SPSS (version 20; IBM) for group effects
(5 conditions x 5 channels x 2 groups). Greenhouse-Geiser Epsilon adjustments were
applied in cases where sphericity was violated. Note that even though outlier cases were
omitted from PCA estimation of the P1 and N2 time ranges, they were included in all
later amplitude and latencies analyses. Post-hoc analysis including pair-wise comparison
to investigate significant conditional effects, in order to determine if a second tone
response was elicited in the TT conditions.
Further analyses at sites demonstrating particularly strong responses were
planned, including analysis of component peak latency and maximum amplitude, which
were also generated using Waveform Tools. Maximum amplitude analyses were
included as a complimentary approach to average amplitude analysis due to the different
advantages of the two measures in different waveforms. Handy (2005) pointed out that
maximum peak amplitude is best for situations where a pronounced peak was being
analysed, whereas mean amplitude is more suitable when peaks appears to be flatter or
more diverse in morphologically. In addition, maximum and mean amplitude are
sensitive to different features of the waveform being analysed; the former is more
sensitive to noise in the data while the latter is more sensitive to changes in peak latencies
in different conditions (Handy, 2005).
Results
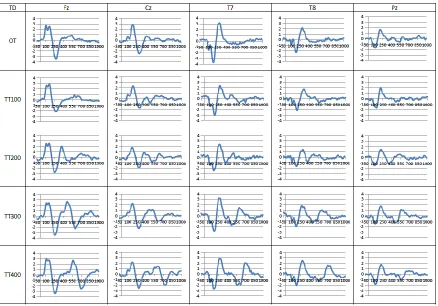
Figure 2a (TD) and 2b (SLI) show the group grand average waveforms without
OT subtraction over the time period of 50ms pre-stimulus to 1000ms after the
presentation of the first tone.
Principle Component Analysis (PCA) on second tone responses
Figure 3a and 3b provides the topographic images of the subtracted waveforms
from the groups with TD and SLI, respectively, over the time period of 50ms
pre-stimulus to 400ms post-pre-stimulus. Visual examination of the topographic image shows
Figure 2a. Grand average waveform of TD group across selected channels. Grand
average of ERP waveforms of TD group at Fz, Cz, T7, T8, Pz across OT and four TT
conditions. X-axis represents time in ms, from 50ms pre-stimuli baseline to 1000ms
Figure 3a. Topographic images of subtracted waveform of TD group. The topographic
images provide a top-down view of the recording of all channels from the onset of the
tone in the OT condition and onset of the second tone in the TT condition. Intensity of the
colour is proportional to the amplitude of responses recorded at the particular region of
the scalp; red colour reflects positive amplitude relative to baseline measurement, blue
The group averages of subtracted waveforms are shown in Figure 4a and 4b for
the groups with TD and SLI, respectively. Visual inspection suggests that both groups
showed a response to the second tone when it was presented as early as 100ms after the
first tone, and the response magnitude increased with an increasing gap between the two
tones.
The subtracted waveforms, over the period 0-400 ms, were entered into the PCA
for P1 and N2 latency range identification. Maximal loadings on the first and second
PCA components were at 64-148ms (eigenvalue = 64.9, explained variance = 23.9%) and
at 208-296ms (eigenvalue =62.7, explained variance = 23.0%) consistent with the
reported latencies of P1 and N2, respectively, in the CAEP (Ponton, 2000).
Analysis of mean amplitude. Mean amplitude over the latency range of P1
generated from the PCA is summarized in Table 3 for both TD and SLI.
A mixed ANOVA with group (TD/SLI) as the between subject factor and five
conditions (OT/TT100/TT200/TT300/TT400) and five channels (Fz, Cz, T7, T8, Pz) as
within subject variables, was completed on P1 mean amplitude. Results revealed a
significant main effect of channel, F(3.17, 151.93) = 113.63, p < 0.001, partial
eta-square, ƞ2 p = 0.703, and a significant interaction between channel and condition, F(7.14,
342.5) = 6.51, p < 0.001, ƞ2p = 0.119. There were no significant effects involving group
(group: F(1, 48) = 2.66, p = 0.109, ƞ2p = 0.053, group x condition: F(3.13, 150.27) = 0.54,
p = 0.66, ƞ2p = 0.011; group x channel: F(3.17, 151.93) = 1.09, p = 0.36, ƞ2p= 0.022; or
group x condition x channel: F(7.14, 342.54) = 0.91, p = 0.50, ƞ2p = 0.019. As well, the
main effect of condition was non-significant, F(3.13, 150.27) = 0.73, p = 0.54, ƞ2p =
Figure 4a. Grand average of OT and subtracted TT waveforms of TD group. X-axis
Table 3
Mean amplitude of P1 over latency range 64 to 148ms for selected channels. (Data
shown in μV: mean (SD))
Fz Cz T7 T8 Pz
Conditions TD SLI TD SLI TD SLI TD SLI TD SLI
OT 1 . 8 2
(1.05)
1 . 8 9
(1.21)
0 . 3 9
(0.95)
0 . 6 1
(0.90) -0.89 (1.08) -1.03 (1.20) -0.32 (1.27) -0.51 (0.83) -1.27 (1.01) -1.26 (0.79)
TT100-OT 1 . 1 9
(2.21)
0.057
(1.71)
0 . 6 1
(1.59)
-0.27
(1.29)
-0.52
(2.40)
0 . 0 4
(1.46) -0.28 (1.87) -0.00 (1.14) -0.25 (1.79)
0 . 0 6
(1.71)
TT200-OT 1 . 7 8
(2.98)
2 . 1 0
(2.07)
1 . 8 5
(2.20)
1 . 8 1
(2.00) -1.38 (2.70) -1.63 (1.71) -1.34 (2.41) -1.39 (2.46) -0.78 (2.09) -0.94 (1.76)
TT300-OT 1 . 0 9
(1.54)
0 . 6 0
(1.61)
0 . 2 3
(1.19) -0.31 (1.23) -0.18 (1.40) -0.35 (1.78) -0.25 (1.31)
0 . 0 9
(2.25)
-0.87
(1.93)
-0.60
(1.52)
TT400-OT 2 . 4 6
(2.13)
1 . 6 2
(1.76)
0 . 9 7
(1.78)
1 . 6 5
(1.53) -1.36 (1.29) -1.86 (1.56) -0.82 (2.15) -1.26 (1.83) -0.77 (1.96)
0 . 0 1
Figure 5. Grand average waveforms showing main effect of channels across conditions
for the period 64ms to 148ms (P1).
Figure 6. Interaction effect of channel by condition for mean P1 amplitude.
-2 -1.5 -1 -0.5 0 0.5 1 1.5 2 2.5
50 70 90 110 130 150
P 1 A m p li tu d e ( μ V) Time (ms) Fz Cz T7 T8 Pz -2 -1.5 -1 -0.5 0 0.5 1 1.5 2 2.5
OT TT100 TT200 TT300 TT400
channels, a positive peak was observed at the PCA-generated latency that corresponded
to the expected polarity of P1 at channels Fz and Cz, however, at all other electrodes (T7,
T8, Pz), a negative response was observed (see Figure 5). For the interaction effect
between channel and condition (see Figure 6), an increasing gap between tones
corresponded to an increase in average amplitude with a drop at TT300 for channels Fz
and Cz. Inversely, channel T7 and T8 showed negatively deflecting average amplitude
with the exception of TT300.
In order to further investigate the significant channel by condition effect,
responses at Fz were analyzed in a separate ANOVA, given that the biggest P1 response
was recorded at Fz. A main effect of condition was found, F (3.01, 147.64) = 5.78, p =
0.001, ƞ2p = 0.11. To determine if P1 was elicited in the TT conditions, post-hoc pairwise
comparison of second tone P1 average amplitude in all TT conditions to that of OT was
conducted. A significant difference was observed for average P1 amplitude between OT
(M = 1.86, SD = 1.12) and TT100 (M = 0.62, SD = 2.04), t(49) = 3.67, p = 0.001, as well
as OT and TT300 (M = 0.85, SD = 1.58), t(49) = 3.77, p < 0.001. A t-test against a test
value zero suggested that second tone P1 amplitudes at TT100 and TT300 were
significantly different from zero (p ≤ 0.036).
The second component from the PCA analysis emerged at time 208-296ms
post-stimulus, which corresponded to the latency of an N2 in the CAEP. Table 4 below
summarizes the average amplitude of N2 at the five selected channels for all conditions
and both groups at the time period generated from the PCA analysis. Similar to P1, a 2
Pz, T7, T8) mixed ANOVA was completed on N2 mean amplitude. Results indicated a
significant main effect of channel, F(1.64, 78.79) = 76.34, p < 0.001, ƞ2p = 0.61, and a
significant interaction between channel and condition, F(9.17, 440.30)= 7.75, p < 0.001,
ƞ2
p = 0.139. There were no significant effects involving group, F(1, 48) = 0.59, p = 0.45,
ƞ2
p = 0.012; group x condition, F(3.13, 150.43) = 0.75, p = 0.53, ƞ2p=0.015; group x
channel, F(1.64, 78.79) = 0.60, p = 0.52, ƞ2p = 0.012or group x condition x channel: F
Table 4
Mean amplitude of N2 over latency range 208-296ms for selected channels.(Data shown
in μV: mean (SD))
Fz Cz T7 T8 Pz
Conditions TD SLI TD SLI TD SLI TD SLI TD SLI
OT -2.59
(1.80) -2.35 (1.33) -0.89 (1.21) -0.80 (1.16)
2 . 0 3
(1.53)
1 . 6 9
(1.33)
1 . 0 1
(1.65) 1 . 2 5
(1.62)
0 . 8 6
(1.04)
1 . 0 0
(0.82)
TT100-OT -0.70
(1.63)
-0.96
(1.33)
0 . 2 3
(1.22)
-0.87
(1.47)
0 . 2 4
(1.37)
0 . 8 2
(1.54)
0 . 6 1
(1.35)
0 . 7 2
(1.30)
0 . 2 3
(1.33)
-0.27
(1.33)
TT200-OT -1.27
(2.46) -0.64 (1.52) -0.46 (2.28) -0.20 (1.25)
0 . 5 3
(1.70)
0 . 1 4
(1.33)
0 . 7 8
(2.52)
0 . 4 0
(1.40)
0 . 5 5
(1.46)
0 . 6 5
(1.67)
TT300-OT -2.66
(2.04) -2.04 (1.78) -1.57 (1.49) -1.81 (1.87)
2 . 1 4
(1.82)
1 . 6 0
(1.82)
1 . 5 8
(2.12)
1 . 3 6
(2.41)
0 . 5 0
(1.30)
0 . 7 2
(1.52)
TT400-OT -2.10
(2.15) -1.70 (1.43) -1.03 (1.92) -0.60 (1.13)
1 . 7 1
(1.94)
0 . 9 4
(1.42)
1 . 4 4
(2.46)
1 . 2 6
(1.54)
0 . 7 3
(1.83)
0 . 5 0
(9.17, 440.30) = 0.90, p = 0.52, ƞ2p = 0.018. As well, the main effect of condition was
non-significant, F(3.13, 150.43) = 1.26, p = 0.29, ƞ2p = 0.026. The significant effects are
shown in Figures 7 and 8. At the N2 time period generated by the PCA, Fz and Cz
involved negative components, while T7, T8, and Pz were positive (see Figure 7). The
N2 response was strongest in the OT condition. For the TT conditions, as the gap
between the two tones increased, a gradual increase in average N2 amplitude was
observed at Fz and Cz (see Figure 8). Such increments were also observed at T7 and T8
with the opposite polarity.
The significant channel and condition interaction was further examined in an
ANOVA completed on the Fz data only, given that the maximum N2 response was
recorded at Fz. Results revealed a significant main effect of condition, F(4, 196) = 12.39,
p < 0.001, ƞ2p=0.20. Post-hoc pairwise comparisons with Bonferroni correction (α/4) of
the TT conditions against OT showed significant differences in average N2 amplitude
between OT (M = -2.47, SD = 1.57) and TT100 (M = -0.83, SD = 1.48), t(49) = -5.62, p <
0.001, as well as OT and TT200 (M = -0.96, SD = 2.05), t(49) = -5.02, p < 0.001. Further
analysis on the amplitude of the second tone N2 responses at TT100 and TT200 showed
that the responses were significantly different from a test value of zero (p ≤ 0.002).
Analysis of peak latency. In addition to average amplitude, peak latencies of P1
and N2 were also analyzed. These data are summarized in Table 5.
Given that P1 and N2 responses were strongest at Fz, analyses only focused on
Fz. The latency at which P1 and N2 peaked within the time periods suggested by PCA
were generated and analyzed separately using 2 (group: TD/SLI) x 5 (condition:
-2 -1.5 -1 -0.5 0 0.5 1 1.5
250 270 290 310 330 350
N 2 A m p lit u d e (μ V) Time (ms) Fz Cz T7 T8 Pz -2 -1.5 -1 -0.5 0 0.5 1 1.5 2 2.5
OT TT100 TT200 TT300 TT400
N2 a ve ra ge a m p lit u d e (μ V) Conditions Fz Cz T7 T8 Pz
Figure 7.Grand average waveforms showing main effect of channels across conditions
for the period 208ms to 296ms
Table 5.
Summary of P1and N2 latencies (ms) in TD and SLI groups (channel Fz only)
TD SLI
Mean SD Mean SD
P1 Latency
OT 111.5 20.3 121.9 20.1
TT100-OT 109.6 24.1 113.0 21.9
TT200-OT 107.7 26.7 102.9 20.7
TT300-OT 113.8 19.9 113.6 22.5
TT400-OT 117.8 19.8 120.3 22.4
N2 Latency
OT 263.4 25.3 264.0 22.3
TT100-OT 246.7 26.0 253.9 28.6
TT200-OT 246.2 24.1 243.2 28.2
TT300-OT 244.3 24.6 254.7 21.7
TT400-OT 250.4 20.3 249.0 19.6
a significant main effect of condition, F(4, 192) = 3.41, p = 0.01, ƞ2p =0.06 (see Figure 9).
However, there were no significant effects involving group, F(1, 48) = 0.431, p = 0.515,
ƞ2
p = 0.01, or group x condition, F(4, 192) = 0.93, p = 0.45 ƞ2p = 0.02. Post-hoc pairwise
analysis examining the condition effect was conducted with Bonferroni correction for
multiple comparisons. Result showed that latency of the second tone P1 was significantly
Figure 9. P1 peak latency at channel Fz across conditions
p = 0.045, as well as TT200 and TT400 (M = 119.04, SD = 20.96) conditions, p = 0.013,
p ≥ 0.05 for the other comparisons.
Similarly for N2, results showed a significant effect of condition F(4, 192) = 4.34,
p = 0.002, ƞ2p = 0.083 (see Figure 10) but not significant effects involving group F(1, 48)
= 0.789, p = 0.379, ƞ2p =0.016, or group x condition, F(4, 192) = 0.72, p = 0.582, ƞ2p =
0.015. The condition effect was examined using post-hoc pairwise comparison with
Bonferroni correction. Result revealed a significant delay in N2 peak latencies in the
three shortest TT conditions: OT (M = 263.68, SD = 23.59) and TT100 (M = 250.32, SD
= 27.29) p = 0.049, OT and TT200 (M = 244.72, SD = 26.01) p = 0.006, OT and TT300
(M = 249.52, SD = 23.53) p = 0.037. No significant differences were found in any other
comparisons, p ≥ 0.05 for the other comparisons.
116.72
111.28
105.28
113.68
119.04
95 100 105 110 115 120
OT TT100 TT200 TT300 TT400
La
ten
cy
(m
Figure 10. N2 peak latency at channel Fz across conditions
Analysis of maximum amplitude. Maximum amplitude of P1and N2 was
generated from EGI Waveform Tools, and summarized in Table 6.
Maximum amplitude difference in the two tone conditions was analyzed using
repeated measures ANOVA on 5 conditions (OT/TT100/TT200/TT300/TT400) with
group as between subject factor. Analysis of maximum P1 amplitude showed a
significant main effect of condition, F (4, 192) = 7.38, p < 0.001, ƞ2p =0.13 (see Figure
11). However, there were no significant effects involving group, F (1, 48) = 0.64, p =
0.43, ƞ2p =0.01, or group x condition, F (4,192) =0.24, p = 0.91, ƞ2p = 0.01. To examine
the conditional effect, post-hoc comparison with adjusted significance level 0.0125 using
Bonferroni correction (α/4) based on apriori hypothesis was conducted on P1 amplitude
between OT and the second tone response in the four TT conditions using a paired
sample t-test. Result revealed a significantly reduced P1 maximum amplitude compared
to OT (M = 3.59, SD = 1.49) in TT conditions with a 100ms gap (M = 1.91, SD = 2.02),
263.68
250.32
244.72
249.52 249.68
235 240 245 250 255 260 265 270
OT TT100 TT200 TT300 TT400
Table 6
Maximum amplitude (μV) of P1and N2 in subtracted two tone waveforms (channel Fz
only)
Condition
TD SLI
Mean SD Mean SD
P1 Maximum
Amplitude
OT 3.41 1.45 3.78 1.54
TT100-OT 1.94 2.49 1.88 1.92
TT200-OT 3.04 2.27 3.39 2.78
TT300-OT 2.13 1.75 2.01 1.74
TT400-OT 3.08 2.03 3.59 1.91
N2 Maximum
Amplitude
OT -4.47 2.17 -3.66 1.64
TT100-OT -1.98 1.46 -2.01 1.45
TT200-OT -2.08 1.74 -2.26 2.70
TT300-OT -3.97 1.88 -3.26 2.07