Modelling and Tuning of DPFC using
Optimization Techniques
Monika Sharma1, Annapurna Bhargava2, Pinky Yadav3
PG Student [Power System], Dept. of EE, Rajasthan Technical University, Kota, Rajasthan, India1
Professor, Dept. of EE, Rajasthan Technical University, Kota, Rajasthan, India2
PG Student [Power System], Dept. of EE, Rajasthan Technical University, Kota, Rajasthan, India3
ABSTRACT: The foremost problem of power system is low frequency fluctuations. To damp out these fluctuations, a new idea is introduced in the form of Distributed Power Flow Controller (DPFC) for the enhancement of power system stability. D-FACTS (Distributed FACTS) concept is followed by this FACTS device. It is achieved from Unified Power Flow Controller (UPFC) by excluding the common dc link. This paper presents DPFC based damping controller. Designing issues are solved by computing the optimized value of parameters of damping controller using several algorithms i.e. Particle Swarm Optimization (PSO), Differential Evolution (DE) algorithms. Results illustrate that DE algorithm gives better results to enhance the stability of system compared with PSO algorithm.
KEYWORDS: Distributed Power Flow Controller, Current Injection Model, Damping Controller, Particle Swarm Optimization Algorithm, Differential Evolution Algorithm.
I.INTRODUCTION
Power demand is growing tremendously. Because of less available sources and environmental issues, transmission systems and generation systems are limited to extend which is the main cause to operate the power system near the stability boundaries. Low frequency fluctuations (0.2-3 Hz) are caused by interconnection of systems. These fluctuations increase continuously (in magnitude) and cause the loss of synchronism, if these will not damp out properly [1]-[2]. To damp out low frequency oscillations, power system stabilizers (PSS) are used but it has some disadvantages with large disturbances point of view [2]-[3]. Hence, to overcome this problem, FACTS devices have come into the picture. These electronics based equipments are more reliable and have fast control capabilities than mechanical controllers [2]-[4].
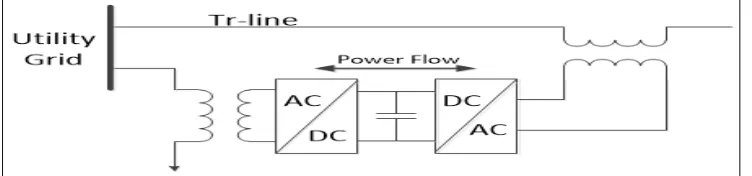
DPFC is introduced as a powerful FCATS-device [5]-[6]. It is attained from UPFC. UPFC is a combined form of Static Synchronous Series Compensator (SSSC) and Static Compensator (STATCOM) i.e. series and shunt connected converters having a common link of DC capacitors that permits the bidirectional active power transfer between series and shunt output ports of converters [3],[7]-[8].
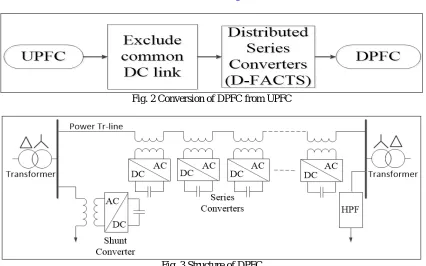
By excluding the common DC connection between series and shunt converters, DPFC is attained. It offers high reliability, low rating components, low price by following the D-FACTS theory concept (having numerous single phase converters) [9]-[10]. Its control capability is similar to UPFC. It also comprises independent shunt and series converters followed with D-FACTS theory, offer requisite DC voltage through their separate DC-capacitors [11].
Fig. 2 Conversion of DPFC from UPFC
Fig. 3 Structure of DPFC
In this paper, modelling of DPFC is done by Current Injection Model. Relative magnitude (r) and phase angle (λ) related to the terminal voltage are the control parameters of DPFC for its designing. Optimization techniques are used to solve the designing problems. To compute the optimized value of controller parameters, numerous algorithms are used such as Particle Swarm Optimization (PSO) [12]-[13], Differential Evolution (DE) [14] algorithms. Response of generator is obtained under different loading conditions. Results indicate that DE algorithm offers comparatively better performance with the purpose of damping out the low frequency oscillations and improve stability.
II.PRINCIPLE OF OPERATION
There is only one common link between the series and shunt converters i.e. power transmission line. Active power is exchanged between the AC ports of the converters that is related to the power theory of non-sinusoidal theory of components [11]. Active power can be represented as below using non-sinusoidal voltage and current.
m m m
P
V I cos
(1)Where Vm = Voltage at mth harmonic frequency, Im = Current at mth harmonic frequency, ϕm = Angle between Vm and Im.
Equation (1) demonstrates that power is not dependent at different frequencies and there is no effect of current and voltage at a frequency with power at different frequencies. Using this theory, active power absorption by shunt converter is done at fundamental frequency from grid and then at harmonic frequency, it is injected back to the line. If losses are neglected, generation and absorption at fundamental and harmonic frequency respectively, are equal.
III.CURRENT INJECTION MODEL
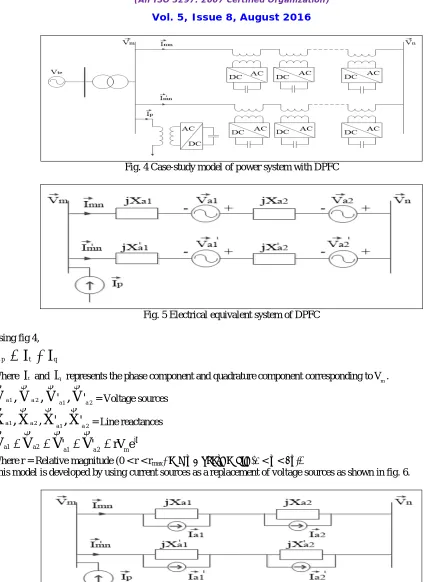
Fig. 4 Case-study model of power system with DPFC
Fig. 5 Electrical equivalent system of DPFC
Using fig 4,
p t q
I
I
I
(2)
Where
I
t
and
I
q
represents the phase component and quadrature component corresponding toVm.
a 1 a 2 'a 1 'a 2
V
,
V
,
V
,
V
= Voltage sources
a 1 a 2
a 1 a 2
,
'
'
X
,
X
X
,
X
= Line reactances
iλ a1 a 2
a1 a 2 m
'
'
rV e
V
V
V
V
(3) Where r = Relative magnitude (0 < r < rmax) and λ = phase angle (0 < λ < 2π).
This model is developed by using current sources as a replacement of voltage sources as shown in fig. 6.
Fig. 6 Current sources representation
a 1 iλ
a 1 a 1 m
a 1
jb rV e jX
V
I
Where a 1 a 1 1 b X
Active power drawn from shunt current source is given as-
*
m
p p m m
P Re
V
I
V I
(5)
If losses are neglected,
shunt series a1 a 2 a1 a 2
P P P P P' P' (6)
Apparent power drawn from Va1 is evaluated as-
*
* iλ m
mn
a1 a 2 n
a1 a1
a1 a 2
m
V V V V
S V I rV e
j X X
(7)a 1 a 1 a 1
S P jQ (8)
Active power and reactive power drawn from Va1 can calculated from equations (3), (7), (8) as-
2 a 1 a 1 a 2 m n m n m
P (b b ) rV V sin(
θ θ λ) rV sin(λ)
(9)
a1 a1 a 2
2 2 2
i i i j i j
Q (b b )
rV cos
λ
2r V
rV V cos(θ
θ
λ)
(10) Hence, powers drawn from other sources can also be evaluated.Shunt converter current is derived as-
jθmp t q
I
I
jI
e
(11)Hence, Current injection model is attained as-
i'
m p a1 a1 a1 a 2 n m n m
jθ
' ' jλ jλ
a1 a 2 n i j m q a1 m a 2
I
I
I
I
{2 b
b
rV sin θ
θ
λ
rV sin λ
2 b
b
rV sin
θ
θ
λ
rV sin λ
jI }e
jb rV e
jb re
(12)jλ jλ n1 a1 a2 a1 m a2
I
I
I
b rV e
jb re
(13)
jλ
n 2 a 2 a 2 m
I
I
jb rV e
(14)
' ' ' ' jλ ' jλ '
n1 a1 a 2 a1 m a2 m a1
I
I
I =-jb rV e +jb rV e b
(15)
' ' ' jλ
n 2 a1 a 2 m
I
I
jb rV e
(16) Hence, the model is attained by using current sources as shown in fig-(7).
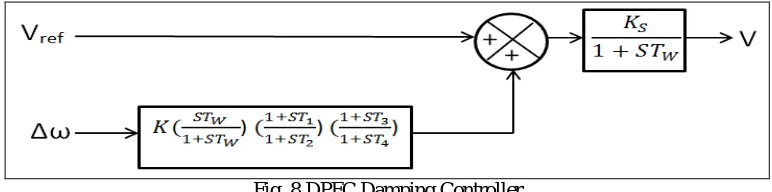
IV.DAMPING CONTROLLER
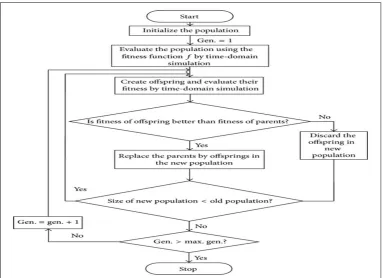
In this paper, damping controller is designed using r and λ as control parameters. The controller can be treated as lead -lag compensator whose input is speed deviation. Optimized value of parameters of the controller is find through PSO and DE algorithms.
Fig. 8 DPFC Damping Controller
V.CONTROLLER STRATEGY
In this paper, a controller is designed which is tuned using the proposed model. Fitness Function is defined as Integral of Time Multiplied Absolute Error. Objective Function is considered as [1]-
) 0
.(
si
t
i
K
t
dt
(17)1
o p e
N
i i
f
K
(18)Where tsi = Time for Simulation, Nope = Total Operating Points required for optimization.
Bounds for the parameters to be optimized are as following-
min max
K
K
K
min max
1 1 1
T
T
T
min max
2 2 2
T
T
T
min max
3 3 3
T
T
T
min max
4 4 4
T
T
T
(19)Optimization of the parameters is done through PSO and DE algorithms, explained as following-
VI.PARTICLE SWARM OPTIMIZATION TECHNIQUE
Russell Eberhart and James Kennedy has introduced PSO technique in 1995. It is a computational technique having wide area applications. Pseudo cade for the algorithm is given as below.
For every particle {
Initialize every particle }
Do until max iterations or min error criteria reached {
For every particle {
If the fitness-value is better than ‘pBest’ {
Set ‘pBest’ = current fitness value }
If ‘pBest’ is better than ‘gBest’ {
Set ‘gBest’ = ‘pBest’ }
}
For every particle {
Compute particle-Velocity
Use ‘gBest’ and Velocity to update particle-Data }
Velocity and position is updated by equation (20), (21) for all the particles [16].
m 1 m m 1 m m 1 m
i i 1 1 i i 2 2 i i
V
ω.V
C .rn . pBest
X
C .rn . gBest
X
(20)m 1 m m 1
i i i
X
X
V
(21)Optimization technique parameters are set as-
Number of variables=5, Population Size=30, Iterations=100, C1=C2=2, w=0.9 to 0.4 (decreasing).
VII. DIFFERENTIAL EVOLUTION ALGORITHM
This optimization technique is proposed by Storn and Price in 1996. Mutation, crossover and selection processes are used for this technique. All the strategies executed in DE algorithm are discussed in [17].
To get the better results from optimization techniques, parameters are considered as-
Number of variables=5, Population Size=30, Iterations=100, βmin=0.2, βmax=0.8, crossover probability=0.2.
Optimized values of parameters are obtained as-
Table 1. Optimized value of Parameters
Controller Parameters
Value
PSO based Controller
DE based Controller
Λ r Λ r
K 95.56 53 98.147 62.589 T1 0.1416 0.101 0.1359 0.0996
T2 0.4713 2.112 0.3876 1.1270
T1 1 0.5297 1.1134 0.4740
T4 0.0716 1.4348 0.0669 1.7059
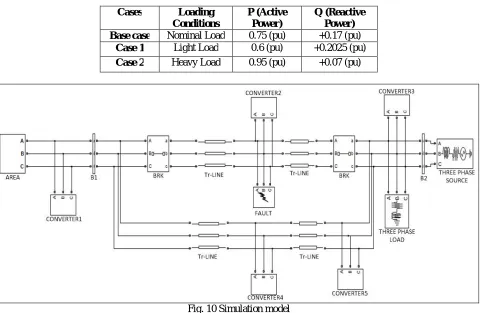
VIII.SIMULATION MODEL
The simulation model is used to evaluate the proposed technique, as shown in fig.10. In double-circuit line, converters are positioned at distinct locations and work independently to enhance the performance for stability point of view.
Simulation is done under distinct operating conditions, as given in table-2.
Table 2. Loading conditions for simulation study
Cases Loading Conditions
P (Active Power)
Q (Reactive Power) Base case Nominal Load 0.75 (pu) +0.17 (pu)
Case 1 Light Load 0.6 (pu) +0.2025 (pu) Case 2 Heavy Load 0.95 (pu) +0.07 (pu)
Fig. 10 Simulation model
Table 3. Design parameters
Considerations Es δ1 Er δ2 S Line
Length Parameter
Values
230 (KV)
10 (Deg)
230 (KV)
0 (Deg
900 (MVA)
220 (KM)
IX. SIMULATION RESULTS AND DISCUSSION
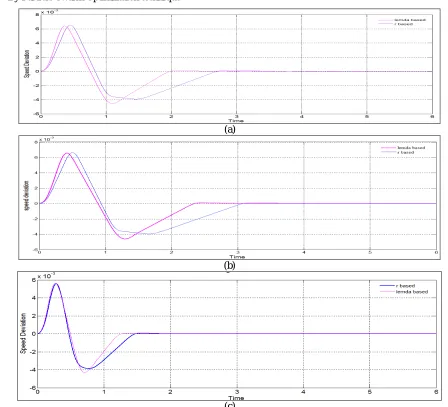
System is considered with six cycle, three phase fault at the mid of one transmission line at t = 1s. After the fault clearance, original system is achieved. Speed deviation responses of generator under distinct operating conditions are obtained using PSO and DE techniques for λ and r based damping controller.
A. By Particle Swarm Optimization technique
(a)
(b)
(c)
Fig. 11 Response of generator for speed deviation at (a) nominal load, (b) light load, (c) heavy load
B. By Differential Evolution Algorithm
(a)
(b)
(c)
Fig. 12 Response of generator for speed deviation at (a) nominal load, (b) light load, (c) heavy load
Fig.12 shows the response of generator for speed deviation at nominal load, light load and heavy load for λ and r based controller using DE algorithm, indicating the superiority of λ based controller over r based controller.
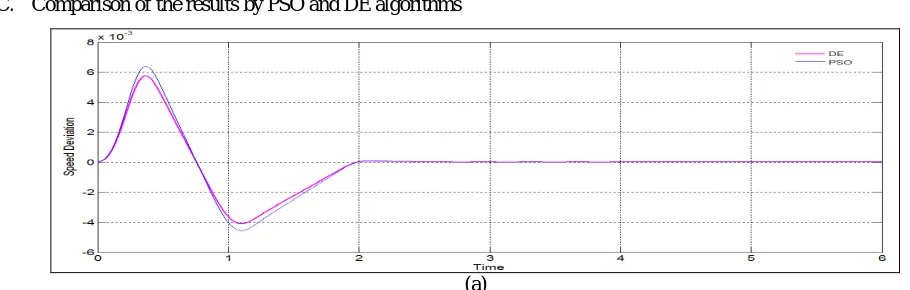
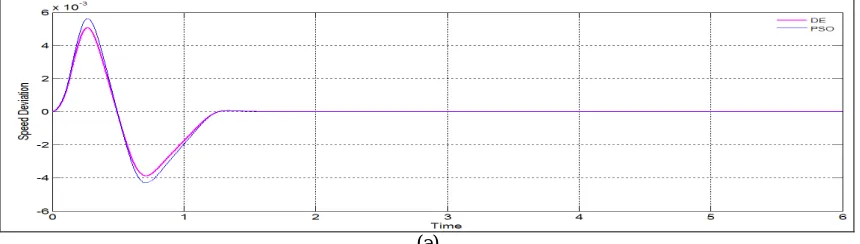
C. Comparison of the results by PSO and DE algorithms
(b)
Fig. 13 Response of generator for speed deviation at nominal load (a) for λ based damping controller, (b) for r based damping controller
(a)
(b)
Fig. 14 Response of generator for speed deviation at light load (a) for λ based damping controller, (b) for r based damping controller
(b)
Fig. 15 Response of generator for speed deviation at heavy loading (a) for λ based damping controller, (b) for r based damping controller
Fig.13, 14, 15 shows the response of generator for speed deviation at nominal load, light load and heavy load for λ and r based controller, concluding that system response is improved by using DE algorithm as compared to PSO algorithm.
X.CONCLUSION
In this paper, mathematical analysis, modelling, simulation study of DPFC is done. It controls the line flow and provides reliable operation of system with low cost. PSO and DE optimization techniques are used to optimize the controller parameters which is designed using r and λ control parameters. Results demonstrate that DE based controller improves the system stability more effectively as compared with PSO algorithm by damping out the system oscillations more efficiently.
REFERENCES
[1] H. Shayeghi, H. A. Shayanfar, S. Jalilzadeh, A. Safari, “A PSO based unified power flow controller for damping of power system oscillations,” Energy Convers Manage, 50:2583-92;2009.
[2] P. M. Anderson, A. A. Fouad, “Power System Control And Stability,” Aimes, IA: Iowa State Univ Press; 1977.
[3] A. J. F. Keri, X. Lombard, A. A. Edris, “Unified power flow controller: modeling and analysis” IEEE Trans Power Deliver,14(2):648-54;1999.
[4] J. N. G. Hingorani, L. Gyugyi, “Understanding FACTS: Concepts and technology of flexible AC transmission system,” New York: IEEE Press; 2000.
[5] Z. Yuan, S.W.H. de Haan, B. Ferreira, “A FACTS device: distributed power flow controller (DPFC),” IEEE Trans Power Deliver 25(2):2564-72;2010.
[6] Z. Yuan, S.W.H. de Haan, B. Ferreira, “A new facts component: distributed power flow controller (DPFC),” In: Eur conf power elctron appl; pp.1-4;2007.
[7] L. Gyugyi, C.D. Schauder, S.L. Williams, T.R. Rietman, D.R. Torgersonand, A. Edris, “The unified power flow controller: a new approach to power transmission control,” IEEE Trans Power Deliver 10(2):1085-97’1995.
[8] L. Gyugyi, “Unified power-flow control concept for flexible ac transmission systems,” IEE Proc Gen Transm Distrib, 139 (4), pp. 323–331. [9] D. Divan and H. Johal, “Distributed facts-A new concept for realizing grid power flow control,” in Proc. IEEE 36th Power Electron. Spec.
Conf. (PESC), 2005, pp. 8-14; 1992.
[10] D. Divan, “Improving Power Line Utilization and Performance With D-FACTS Devices,” IEEE PES General Meeting,;p241–2424,June 2005. [11] O. Sushma, Dr. K. S. R. Anjanyulu, “Modelling of Distributed Power Flow Controller (DPFC) Using Matlab/Simulation,” International
Journal of Engineering Research & Technology (IJERT), ISSN: 2278-0181, Vol.2 Issue 1, January-2013.
[12] A.T. Al-Awami, Y.L. Abdel-Magid, M.A. Abido, “ A particle-swarm based approach of power system stability enhancement with unified power flow controller,” Elect Power Energy Syst,29:251-9;2007.
[13] R. Poli, J. Kennedy, T. Blackwell, “Particle swarm optimization”: an overview. Swarm Intell, 1:33–57;2007.
[14] R. Storn and K. Price, “Differential Evolution – A Simple and Efficient Heuristic for Global Optimization over Continuous Spaces,” Journal of Global Optimization, 11, pp. 341-359;1997.
[15] Y. Zhihui, S.W.H. de Haan, B. Ferreira, “Utilizing distributed power flow controller for power oscillation damping” In: Proc IEEE power energy soc gen meet (PES),p. 1–5;2009.
[16] J. Kennedy, R. Eberhart, Y. Shi, “Swarm intelligence,” Morgan Kaufman Publishers, San Francisco (2001).