Research on SWeamlining Seismic Safety Evaluation of Underground Reinforced Concrete
Duct-Type Structures in Nuclear Power Stations
-Part-6. Verification of Ultimate Load and Ductility Capacities of RC Ducts
Yoshinori Miyagawa 1), Toshikatsu Matsumoto 1), Yukio Aoyagi 1) and Kensei Kanaya 2) 1) Central Institute of Electric Power Industry, Abiko, Japan
2) Kansai Electric Power Co., Inc., Osaka, Japan
ABSTRACT
A static horizontal loading test was conducted to identify the structural properties of the RC duct models tested in the laminar shear box as descn'bed in partsl-5. As a result, it was confirmed that the RC models had enough deformation capacity as high as 20% in terms of shear deformation angle.
Then, based on the parameter study and statistical fitting the formulae were developed for evaluation of the structural shear deformation angle in the states when the critical member section suffers some levels of charactersitic damage such as "tensile rebar yielding", "concrete crushing", "concrete spaUing", "compressive rebar yielding" and so on. These formulae are able to estimate the angles when the following parameters are given; wall height, wall thickness, concrete compressive strength, rebar yield strength, tensile rebar ratio and axial stress. Validity of the formulae was confirmed in the light of experimental evidences.
INTRODUCTION
The seismic design and verification system of a structure is shifting from load-based[i] to deformation-based one. The basic concept is that deformation response should always be less than its deformation capacity. One of the benefits of this assessment system is the possbility of rationalization in the design by incorporating material and stmcawal non-linearity. Therefore, we have been conducting a research with a view to establishing a rationalized design system for underground RC structures in nuclear power plants from a variety of approaches.
After the shake table test[2], we retrieved the RC duct models from the laminar shear box and loaded them up to failure by applying reversed static horizontal forces. This test had two objectives. One was to make clear deformation capacity of RC model subjected to excitation in the laminar box. The other was to collect data to verify the evaluation formulae for deformation capacity. In chapter 2 test conditions and experimental results are presented.
In line with the sophistication of FEM[3], a study is also needed to grasp the overall tendencies of structural behaviors, changing the parameters involved. In chapter 3, the formulae were proposed based on parameter fitting and its verification was made with respect to experimental results.
STATIC LOADING TF_~T
Experimental Procedures
The test models are two duct-type RC structures, which have identical dimensions of 1.75m in height, 3m in length and 0.97m in width (Fig.l). They are composed of three vertical walls, top and bottom slabs. Although this type of structure is used for accomodating emergency cooling water pipes in nuclear power plants, the test models were constructed rather slenderer than the actual ones to give rize to flexural failure mode. During the excitation tests the models had already experienced a large deformation of 50mm at the top slab with respect to the bottom slab, which was equivalent to shear deformation angle of about 3%.
Different amounts of steel ingots were placed on the top slab to simulate the weight of soil acting on the structures; to model A, 64kN (corresponding to 1.5m of cover soil) and to model B, 133kN (corresponding to 3.0m of cover soil). The bottom slab was connected firmly to the strong floor with high-strength steel bolts.
The models were subjected to statically simulated earthquake loading from the edge of the top slab with hydraulic jacks. Loading was
SMiRT 16, Washington DC, August 2001 Paper # 1307
t 3000
"7",,,,,,,,,,,,,,,,,,,,.-
-
i
_ _
1 750 wiau~ 97o __
i
_
II I I I I I
II11111 I I I I I IIIIIII [ S l a b ] 2 - D ( : @ 6 2 . ~
[ Wall ]
2 - D 6 ~ 6 2 . 5
I l l l l l l
--'i- v
1 O0
~ 3 0 C
Fig.-1 Section of the Models used for Excitation Test
Weight
Fig.-2 Experimental Method
sucheduled so that incremental reversed displacements of _+6y,+__26y,+__46y,___66y,+__86y,___106y,+_.156y,+_.306y, and+506y (where 6y denotes first yield displacement) were applied; being followed by pushing-over scheme. The ultimate top displacements of A and B models
were +606y and +706y, respectively.
Experimental Results
The main test results are listed in Table-1 and load-displacement relationships are shown in Fig.-3. Both models exhibited almost the same behaviors, from which it was concluded that the difference of the soil overburdening on the structures had no influence on the
deformation behaviors. Looking at the hysteresis loops up to the levels of-+- 156),, the pattems are spindle-shaped, which is predominantly of flemwal nature. They started to lose their load capacity due to the successive breaking of rebars at the shear deformation angle of around 10%. They withstood the maximum deformation as high as about 20%. Then, the load capacity fell to 30% of the maximum load, causing the half
number of rebars to break at the ultimate stage. Fig.-4 illustrates a deformation mode visualized by FEM analysis.
EVALUATION FORMULAE F O R DEFORMATION CAPACITY
Deformation
Capacity
Permissible deformations of structures due to earthquakes are dependent on the judgement of designers and/or code writers. Therefore,
it is of importance to specify deformation in accordance with various damage levels. Here, we call such states as "limit states" and define the
deformation in each limit state as "deformation capacity". That is, it does not necessarily mean structural collapse. We deal with "shear deformation
angle" as an index to evaluate the overall deformation capacity.
Parametric
Study
A parametric study was conducted to investigate the effect of
stmcttwal dimensions, material properties and axial force in the vertical members on deformation capacity. In this study the RC ducts were simplified as sketched in Fig.-5 and following assumptions were made.
• The tensile reinforcement indices (amount and diameter) are the same as
those of the compressive steels in vertical members.
Table-1 Experimental Results of RC Duct Models
Maximum Load Maximum Displacement
Load(kN) Displacement(mm) Load(kN) Displacement(mm)
66.5 179 22.1 349
Model A
Model B 64.5 139 28.7 301
80 !
z 4 0
-~ o
- 4 0
-80 i . . . .
-0.1 0 0.1 0.2 0.3
S h e a r D e f o r m a t i o n A n g l e
Fig.-3 Load-Deformation Loops for Models A and B
/.:: .,,, .... ~~]~]i!i~iii~ii{~i~:~::-':}~:i~ii~ii~i{;i~Ji: . . . . . . . . !~!ii~!~;~i~ ~!-~iii{i~.:i~~i~i~i{:ii:i i~:~;~i~i~-~i~:%#i}~:ii~i~i~--~i{::~ iiii%~:: ,. ~$::..
~ ~ ! .. , .. ... ,. - - ~ . . . ~ ... ~ ""
Shear Stress by Upper Soil
in Ground Shaking
Pressure by Overburden Soil /
'
!
!
I n t e r f a c e S h e a r S t r e s s
c a u s e d b y G r o u n d S h a k i n g
..:::::: ... ... :::::::::~.-ii'i ...
h
N o r m a l E a r t h P r e s s u r e N o m a a l E a r t h P r e s s u r e
a t R e s t c a u s e d b y G r o u n d S h a k i n g
A x i a l S t r e s s to W a l l s
~0 ~0 ~0 ~C
I
... t ... ]
k / l b .J
V" t: -1
I
Shear Deformation Angle R
/
Fig.-5 Modeling of RC Ducts for Parametric Study
• The top and bottom slabs are so strong that they do not yield before the vertical members reach the limit state. • Each member of the structure is guaranteed not to fail in shear mode.
• Compressive rebars remain elastic until the ultimate stage.
The second assumption implies that the model consists of rigid floor and flexible walls. We considered the inner measurement values between top and bottom slabs as the height to calculate shear deformation angle. For the sake of simplicity, haunches were neglected.
Calculation of load-displacement relationship was executed according to the usual procedure in which bending moment-curvature (M- 0 relationship was derived from cross sectional analysis and load-displacement (Q-~,) relationship was calculated besed on the concept of equivalent plastic hinge length. The weight of soil on the structure was assumed to be equally distributed to each vertical member, whose axial stress is expressed by the following equation.
pg~bD
o 0 - 0.0098. (1)
nt
The standard stress-strain relationship of concrete specified in JSCE Code[4] was used, which is expressed as a parabola up to 0.2%, keeping constant stress up to the ultimate strain of 0.35%. The steel constitutive law was assumed to be bi-linear reaching 15 times yield strength at 20% strain. Young's modulus of steel was taken as 2.08N/mm 2 . For equivalent plastic hinge length, Park's formula was adopted[5], fixing the reinforcement diameter to 10mm and concrete cover to 1/8 of wall thickness.
Table-2 Parameters in Parametric Study Series
Wall Thickness [m]
Aspect Ratio
Case1 C a s e 2 C a s e 3 C a s e 4 C a s e 5 C a s e 6
0.6 0.6 0.6 0.2 - 2 0.6 0.1 - 3
8 8 3 - 15 3 - 15 8 3 - 15
Concrete Compressive
Strength [N/mm 2] 20 - 50 20 - 50 20 - 50 30 30 20 - 50
Rebar Yield Strength
[N/mm2 ] 200 - 500 200 - 500 200 - 500 300 300 200 - 500
Tensile Reinforcement
0.25 - 2.5 0.25 - 2.5 0.25 - 2.5 0.5 0.5 0.25 - 2.5
Ratio [%]
Axial Stress Ratio 0 0 . 2 0 - 0 . 2 0 - 0 . 2 0 - 0 . 2 0 - 0.2
Figure No. Fig.-6 Fig.-7 Fig.-8 Fig.-9 Fig.-10 Fig.-11
gp - 0.08" h/2 + 0.022dbfy
(2)
Following five damage levels were designated as limit states.
(a) Tensile rebar yielding ? ty
(b) Tensile rebar strain Est ~ ~st
(c) Concrete crushing (compressive fiber strain equals to 0.35%) ~'cc (d) Concrete spaUing (compressive fiber strain equals to 1.0%) 7
(e) Compressive rebar yielding 7 cy
o oo 0 . 0 0 6 <
.,..,
m 0 . 0 0 4
0 . 0 0 2
t~
( a ) T e n s i l e R e b a r Y i e l d i n g
0 . 0 0 8 . . . . , . . . . , . . . . , . . . . ~ . . . . , . . . . fitting
y=0.0017*fy/200+0.0036*x o
o o o o o
o ° c ° C ~ ~
o o
\ ' 4 0 0 N / m m 2 -
\ 3 0 0 N / m m 2
2 0 0 N / m m 2
0 . . . . i . . . . i . . . . i . . . . i , , , , i , , , ,
0 0 . 2 0 . 4 0 . 6
R e i n f o r c e m e n t F a c t o r
( b - l ) T e n s i l e R e b a r S t r a i n 3 % 0 . 0 3 . . . . ~ . . . . , . . . . , . . . . , . . . . , . . . .
i- c o o o o ,.~ o o o c]~]
I-L ° ° o o _ ~ o o o L ~ o o o ~ + \
0 . 0 2 ~ o C ~ ~ o ~\ o
I~
~ o o o \\\0 . 0 1 I / f Y = 5 0 0 N / m m 2
2 0 0 N / m m 2
fitting
y=(0.0079+0.0021*fy/200)*0.03/0.02 0 . . . . i . . . . i . . . . t . . . . i . . . . i . . . .
0 0 . 2 0 . 4 0 . 6
R e i n f o r c e m e n t F a c t o r
~o 0 . 0 6 <
. , .
0 . 0 4
~ 0.02
r~
( b - 2 ) T e n s i l e R e b a r S t r a i n 0 . 0 8 . . . . , . . . . , . . . . , . . . . , . . . . , . . . .
~ z o c o o o o o o c ~ \ c o o o o o ~ooo o ooo~ (~o~ o o o
~ o ~ ~ o o \ o
. . . . \ \
f y = 5 0 0 N / m m 2
2 0 0 N / m m 2
fitting
y=(0.0079+0.0021 *fy/200)*o.10/0.02
. . . . ~ . . . . i . . . . + . . . . i . . . . ~ . . . .
0 . 2 0 . 4 0 . 6
R e i n f o r c e m e n t F a c t o r 0 %
0 . 0 4
o , m 0 . 0 3 <
0 . 0 2
~ 0.01
( c ) C o n c r e t e C r u s h i n g
f ... ...
y= (0.0063+ 0.0012. fy/200)*x ^-0.25
o
0 0 N / r a m
2 0 0 N / m m 2
. . . . i . . . . i . . . . t , , ; , l , , , , I , , , ,
0 0 . 2 0 . 4 0 . 6
R e i n f o r c e m e n t F a c t o r
0 . 0 6
o ~a 0 . 0 4 5
<
o
~ 0 . 0 3
~- 0 . 0 1 5
( d ) C o n c r e t e S p a l l i n g
t+ . . . ,,;.d . . .
y=0.026+ 0.003*fy/200+0.00005*x ^-1
f y = 5 0 0 N / m m 2
\
2 0 0 N / m m 2
, , , , i . . . . i . . . . + . . . . i . . . . i . . . .
0 0 . 2 0 . 4 0 . 6
R e i n f o r c e m e n t F a c t o r
( e ) C o m p r e s s i v e R e b a r Y i e l d i n g . . . . i . . . . i . . . . i . . . . i . . . . i . . . .
0 . 2 t l fitting
0 . 1 5 ~ y= (0.012+O.O046*fy/200)*x"-0.45
0 . 1
0 . 0 5
0
0 0 . 2 0 . 4 0 . 6
R e i n f o r c e m e n t F a c t o r
Fig.-6 Results of Parametric Study
- Effect of Material Properties in the Case without Axial Stress -
O 0 . 0 0 6 <
.,..,
0 . 0 0 4
~- 0 . 0 0 2 o .m
( a ) T e n s i l e R e b a r Y i e l d i n g
°,°°' t . . . . . . o
t+ o o °°
- \ °
t ~ o c ~ ° ° ~ f v = 5 0 0 N / m m 2
t o%
o o 4 0 0 N / m m'
2t \ '
3 0 0 N / m m 2t
2 0 0 N / m m 2 J
r fitting 1
r y=0.001+0.002*fy/200 J
0 I . . . . I . . . . I . . . . I i + i i j i i i i I i i i i |
0 0 . 2 0 . 4 0 . 6
R e i n f o r c e m e n t F a c t o r
( b - l ) T e n s i l e R e b a r S t r a i n 3 %
0 . 0 4 , . . . . , . . . . , . . . . , . . . . , . . . . , . . . .
O 0 . 0 3 <
.,.
0 . 0 2
0 . 0 1 r~
o f y = 5 0 0 N / m m 2
~o~ . . .
~°n ° ° o c o c l ~ ~ o o o o ~9.~q~°~.~., rs~r.-;',o b " % o
~ ' ~ ~ o n \ n \
\ \ 4 0 0 N / m m 2
\ 3 0 0 N / m m 2
2 0 0 N / m m 2
fitting
. . . y7 !0 ]0p84+,0 ;0924.* fy {2p0, )~0,.03(0,.72, ,
0 . 2 0 . 4 0 . 6
R e i n f o r c e m e n t F a c t o r
( b - 2 ) T e n s i l e R e b a r S t r a i n 1 0 %
0 . I . . . . , . . . . i . . . . i . . . . + . . . . i . . . .
O 0 . 0 7 5 <
0 . 0 5
~ 0.025
f y = 5 0 0 N / m m 2
. . .
/ o o
ftDO~,'...,.uta.~ u ~ . { o o o0 ~ o
. . . . \ o ',,\
/ \ 4 0 0 N / m m 2
\ 3 0 0 N / m m 2
2 0 0 N / r a m 2
fitting
y= (0.0084+0.0024" fy/200)*0.10/0.02 0 , , , , i , , , , t . . . . ~ . . . . t . . . . i . . . .
0 0 . 2 0 . 4 0 . 6
R e i n f o r c e m e n t F a c t o r
( c ) C o n c r e t e C r u s h i n g 0 . 0 1 2 . . . . , . . . . , . . . . , . . . . , . . . . ~ . . . .
f ~ O c o o o o c o ~ c o o o o o I ~ m c o o o o c ~ c ~ COO^ o o o o
" ~ 0 . 0 0 9
< \
"~ t \ f Y = 5 0 O N / m m 2
0 . 0 0 6
2 0 0 N / m m 2
~, 0.003
r.~ ~ fitting
. . . . y=o;oo+
0 . . .
0 0 . 2 0 . 4 0 . 6
R e i n f o r c e m e n t F a c t o r
0 . 0 4
o 0 . 0 3 <
.,.
0 . 0 2
0 . 0 1
r~
( d ) C o n c r e t e S p a l l i n g . . . . i . . . . i . . . . i . . . . i . . . . i . . . .
o
P
fitting y=0.037+0.014*log(x) , , , . i . . . . , . . . . i . . . . i . . . . + . . . .
0 . 2 0 . 4 0 . 6
R e i n f o r c e m e n t F a c t o r
0 . 0 1 2
O 0 . 0 0 9 <
0 . 0 0 6
0.003
( e ) C o m p r e s s i v e R e b a r Y i e l d i n g
t i i ~ t i
( ~ o c o O o o o o c l ~ c o o \ o o o . . . . , - , , - ~ c~o o ~ o
. . . .
\ \
. . . \ o \
\ \ f y = S 0 0 N / m m 2
\ '
4 0 0 N / m m 2 ~ . ~ . ~ ~ u u 3 O O N / m m 22 0 0 N / m m 2
fitting y=0.004*fy/200 0 . . . . I . . . . I . . . . I . . . . I . . . . I . . . .
0 0 . 2 0 . 4 0 . 6
R e i n f o r c e m e n t F a c t o r
Fig.-7 Results of Parametric Study
ratio of height to thickness), concrete compressive strength, rebar yielding strength,
tensile reinforcement ratio and axial stress in vertical member. However, the last factor was normalized by concrete compressive strength in the form of axial stress ratio. The
study was conducted dividing into a series of some cases such as given in Table-2. Case 1 was to investigate the effect of material properties in the case of no axial
stress and the results are depicted in Fig.-6, taking reinforcement factor (Pfy/fc) as horizontal axis. Concrete compressive strength ranged from 20N/mm 2 to 50N/mm 2, rebar yield strength from 200N/mm 2 to 500N/mm 2, tensile reinforcement ratio from
0.25% to 2.5%. In the figure calculated results are shown with respect to the states(a)-(e) with 2 cases (tensile rebar swain 3% and 10%) for state0~ ). Calculations
were performed on four different levels of yield strength (200,300,400,500 N/mm2). For each state, consistent relationships are found between shear deformation angle and reinforcement factor. For the states(a) and (b), the increment in reinforcement factor
accompanies the increase in shear deformation angle and for the states(c)-(e) vice versa.
This result means that we can express the effect of material properties by two factors; rebar yield strength and reinforcement factor.
Likewise, the results in the case of axial stress ratio equal to 0.2 are depicted in Fig.-7. As regard to the state (a), gradual increase in shear deformation angle with the increase of reinforcement factor can be seen. For the states (b)-(e) almost constant values were calculated except for the region of the very small reinforcement factor.
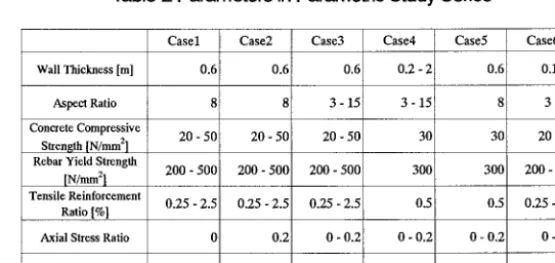
Fig.-8 presents the results of Case 3, which investigated the influence by aspect ratio of vertical walls. In the figure the deformation in the vertical axis is normalized
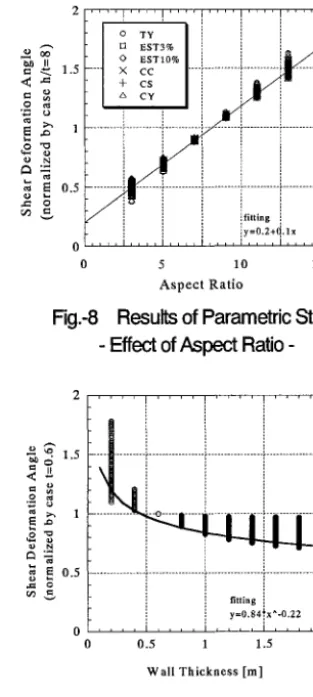
with that for aspect ratio of 8.0 and all states (a)-(e) are plotted. A linear relationships is recognized between normalized deformation and aspect ratio. Fig.-9 illustrates the results of Case 4, which was intended for the study of effect by wall thickness. In the figure the deformation in the vertical axis is normalized with that of wall thickness of
0.6m and aspect ratio of 8.0 and the calculated values for all states (a)-(e) are plotted. The effect of wall thickness on the deformation capacity seems pronounced in the
range of thinner thickness. It is noted that these effects of structural dimensions mainly
are mostly attributable to the variables of Park's equation.
The effect of axial stress ratio is shown in Fig.-10. From this it is seen that for the states (a) and (b) the effect of axial stress ratio is negligible. To the contrary, the influence
is substantial for the states (c)-(e), the state (e) in particular.
Derivation of Formulae
As the formulae were developed aiming at estimating average values rather than the value with safety margins, they were derived through regression analysis when consistent relationships between parameters and shear deformation angles were found.
For other cases we adopted the lower limit values on the conservative side. Formulae are composed of three parts Eqs.(3)-(7), Eqs. (8)-(12) and Eqs. (13)-(17) as depicted in Fig.-ll. First, the deformation capacity under axial stress ratio 0.0, wall thickness 0.6m
and aspect ratio 8.0 is calculated with the following five formulae.
o
1.5 < ~.
~ 0.5
2 . . . . [ ' ' ' ' 1 . . .
o TY
I rl EST3%
/ o EST10%
---1 x cc .... r ... [ ... ~ll ...
J + cs i ! J - " i -
/:cJL._
, ::,J it
, , , ,y=0.2+d.lx
0 t i i ! . . . ~ i
0 5 10 15
A s p e c t R a t i o
Fig.-8 Results of Parametric S t u d y
- Effect of A s p e c t R a t i o -
~, G" 1. 5 <
~ 0 . 5
2 . . . .
... i ... i ... i ... : i
fitting i y=0.84~x^-0.22
i , , i , , i , .... } . . . .
0 0.5 1 1.5 2
W a l l T h i c k n e s s [m]
Fig.-9 Results of Parametric
Study
- Effect of Wall T h i c k n e s s -
0 . 0 8 . . . ! . . . .
o TY
El EST3% EST10% m 0.06-=--;.--x--;<-:,L--~5--<FW-~-6"O"~
< • ~ , . > , , v v ' X c c
+ c s
o
"-" • cY
E~ 0 . 0 4 . . . ; . . .
~o • ,,
+ ++_,_ ~
0
~I++++;++.
~ 0 . 0 2 -~--~-ta-=-~-~-~-~a--m-+ -~-~a-~-~'~''~'a'~*-u
o
o o o o t . . . . + o o o o + . . . .
0 i , i i i , , , , , , , , , , ,
0 0 . 0 5 0.1 0 . 1 5 0.2
A x i a l S t r e s s R a t i o
Fig.-10 Results of Parametric S t u d y
- Effect of Axial Stress Ratio -
fy Pfy
R t y air -- 0.0017 + 0.0036
' 200 fc
0)
f y ) Est
t~st,air -- 0.0079 + 0.0021"
200 0.02
R a, (0006,+0001, )(,)o
-1
fY ( p l y )
R~ air = 0.026 + 0.003 + 0.00005
' 200 f~ )
(
fy)
R~y air = 0.012 + 0.0046-
' 200
(5)
(6)
(7)
Sezond, that under axial stress ratio 0.2, wall thickness 0.6m and aspect ratio 8.0 is calculated with the following five formulae.
Rty,g r = 0 . 0 0 1 0 + 0.0020. fy
200
Rl~st,gr - ( 0.0084+ 0.0024" fy /" Est 200 ) - 0 ~
R~c,g, = 0.008
R~s,v = 0-037 + 0.0141Oglo (-~~ y )
Rcy,g r =0.0040" fy
200
(8)
(9)
(10)
(11)
(12)
Third, corrections are made in regard to the structural dimensions through interpolation about axial stress ratios.
Cro/f ~ - 0 . 2 ) (13)
Rty = Kl" Rty gr + (Rty,air - Rty gr)
' - 0 . 2
R~s t = K 1 - K 2 "( REst,gr + Oo/f c - 0 . 2 (R -0.2 est,air -
R,,t ~
, ) ) (14)( o°/fc -0"2 ( R .... ir ) ) (15) R~ = K l " K 2 • R + - R ~ r "
~,v -0.2
Oo/f c - 0 . 2 (R .... ir Rcsgr )) (16)
R . = K I ' K 2" R ~ v +
' - 0 . 2
( oojfc o2 ,,
)
Rcy= Kl "K2" Roy gr + ' -0.2 (Rcy,air-R cy,gr
)
(17)
where
K, = 0.2 + 0.1h (18) K 2 = 0.84 x t -°'22 (19)
t
Applicable ranges of the formulae are limitted as follows.
(3),(4),(5),(6),(7) (8),(9),(10),(11),(12)
Interpolation regarding Axial Stress Corrections in regard to the Structural Dimension
(13),(14),(15),(16),(17) ]
(13) - (16) are valid only when they are less than (17)
Fig.-11 composition of formulae
0.3
025
'~, "~' 02
a N
~ 0 , 1 S O
v ,,!/
0,05
Fig.-12
0 0.05 0.1 0.15 0.2 0.25 0.3 Shear Deformation ..MI#e ~:Iodel used for Paranleh'ic Study)
3 < h/t ~ 15,100 < t < 3000[ram], 200 < fy < 500[N / m m 2 ] , 0.25 < p < 2.5[%]
2 0 < f c <50[N/ram2], 0 < Oo/fc < 0 . 2 , 1 / 6 <d¢/t <1/8
It should be noted that the values by Eq.(13)-(16) are effective only when they are less than that by Eq.(17) because these formulae are based on the assumption that compressive rebar remains elastic.
Verification
Whether the formulation above was appropriate or not was checked through the comparison with all cases where all 6 parameters were varied;
wall thickness (0.1m to 3.0m), aspect ratio (3.0 to 15.0), concrete compressive strength (20N/ram 2 to 50N/ram2), rebar yield strength (200N/ram 2 to 500N/ram2), tensile reinforcement ratio (0.25% to 2.5%) and
axial stress ratio (0.0 to 0.2). As shown in Fig.-12, resulting plots centered
around the coincidence line, which gives a basis to judge that the formulation was appropriate.
The proposed formulae were also verified through comparison with
some static loading tests. First, the test results of the two RC duct models mentioned in Chap.2 were used to be compared to the correponding
estimates (Fig.-13). Each estimated state in terms of shear deformation angle is indicated with a triangular mark in the figure.The corresponding experimental state is plotted on the loops with a circular mark. As is seen in
experimental results, there is no appreciable difference between the two models and the effect of axial stress ratio is found negligible in the estimate as well as in the experiment. Reference to the procedures mentioned above
makes it easier to understand the progressive change of states, tensile rebar yielding ~ tensile rebar strain 2% ~ concrete crushing ~ concrete
spalling ~ compressive rebar yielding. The shear deformation angle in state (a) is rather underestimated. This is due to the derivation process of
deformation in parametric study, where the equivalent plastic hinge length is reduced to zero when tensile rebar yields without consideration of its pulling out. The value corresponding to state (e) agrees well with the maximum load
point in experiment.
Further comparisons were attempted on the RC specimens named $2
and $3 in Fig.-14[6], which had 1.08m in height, 2.54m in length and 0.4m in width. The side walls and the middle wall had thicknesses of 0.2m and 0.14m, respectively. Concrete compressive strength of 30N/mm 2 and rebars with yield strength of 350N/mm2were u "ttlized. The vertical load simulating
the soil supposed to act on the structure was added, the weight of which corresponded to the overburden of 20m and 5m for $2 and $3, respectively. A noticeable difference in stmctmal characteristics between S2 and S3 was
that the former was less ductile than the latter in the post-peak descending portions due to the effect of larger axial force acting to $2 as shown in
Fig.-15and 16. In the case like this when the vertical walls have different structural properties, the calculation should be conducted based on the wall with the least deformation capacity. Fairly good correlations between the
comparable positions of states assure the applicability of the formulae
proposed.
I
8 0
Z ,~, 4 0
o ,-a
- - 0
- 4 0
Concrete C r u s h ( E x p . )
l Tensile Rebar Break ( E x p . )
, , , ,
. . . i._ ~ . . .
/ I / / I g \ \ ~..--~,.,.b..~,~,.
~ ! \ uoncretec:rusn
i Tensile Rebar Yield
- 8 0 . .. . I . .. . I , , , , , , , ,
- 0 . 1 0 0.1 0 . 2 0.3
S h e a r D e f o m a t i o n A n g l e
Fig.-13 Comparison of the Estimate Results with Experimantal l o o p of Model A
2 5 4 0
f f
M 20o M 14o
1 4 8 0
IZ1 I I I I I I IXkl
90
i W i d t h 4 0 0 -
Z
I
I Y l l l l l l l H , I x~ L S , d e Wall " ~
D l 0 x 5
[ C e n t e r W a l l ]
D 1 0 X 3
t ~ i l ; m m
Fig.-14 Sections of $2 and $3 Models
1 6 0
z 8 0
o ,-a
-- e~ 0
o =
N .,..,
- s o
- 1 6 0 -0
Tensile Rebar Yield (Exp.) Concrete C r u s h ( E x p . )
... i ...
i-
:
.......... TM ~ ' ~ ' '
.... i .... ,>.,,o..oba...,J,d ....
1 - 0 . 0 5 0 0 . 0 5 0.1
S h e a r D e f o m a t i o n A n g l e
Fig.-15 Comparison of the Estimate Results with Experimantal Loops of Model $2
Tensile Rebar Yield ( E x p . )
Concrete Crush ( E x p . )
1 6 0 . . . . .
2;
o . . .
... iiiiiiii
-~ o
° ,v i
.o / / / / / / / / / ~ \ C topless e RebarYield ~ E - o n e t e . . S - p a l l i n g
- 1 6 0 . . . . I . . . . I . . . . I . . . .
-0 1 - 0 . 0 5 0 0 . 0 5 0.1
S h e a r D e f o m a t i o n A n g l e
Fig.-16 Comparison of the Estimate Results
CONCLUDING REMARKS
Based on the experimental results of horizontal static loading test on duct-type RC models as well as parametric numerical studies on shear deformation angles of the above structures, we proposed as estimate methods of the deformation capacity of the RC structures. The proposed formulae were confirmed applicable to assess the various damage levels of flexural behaviors appearing in the RC duct-type structures including tensile rebar yielding, concrete cover spalling etc. The validity of the formulae was also verified in the light of experimental evidences. Further research is needed to broaden the applicability of the proposed formuae beyond the range of parameters investigated in the present study.
NOMENCLATURE
h ._
H =
H =
t =
B =
n =
f y =
P =
O- 0 ----
Pgr =
R some suffix =
d c =
inside distance between top and bottom slabs (wall height) [m] height measured between top slab axis and bottom slab axis [m] outside distance between top and bottom slabs (structural height) [m] vertical member (wall) thickness [m]
outside width of structure [m] number of walls
concrete compressive strength [N/mm 2] rebar yielding strength
[N/mm 2]
tensile rebar ratio
axial stress to vertical member [N/mm 2] density of soil [k~cm 3]
shear deformation angle of structure concrete cover[m]
ACKNOWLEDGEMENT
The forgoing study is a part of the common study entitled" Development Study on the Verification Method of Seismic Performance of Underground Reinforced Concrete Structures in Nuclear Power Plants (Part2) "which is now being carded out jointly by Kansai Electric Power Co. Inc., Tokyo Electric Power Co. Inc., Chubu Electric Power Co. Inc., Hokkaido Electric Power Co. Inc., Tohoku Electric Power Co. Inc., Hohlfiku Electric Power Co. Inc., Chugoku Electric Power Co. Inc., Shikoku Electric Power Co. Inc., Kyusyu Electric Power Co. Inc., and Japan Atomic Power Co. Inc.
The authors are very grateful to the concemed of the above power companies and also to the members of the evaluation committee, which is organized in the Japan Society of Civil Engineers and chaired by Professor H. Okamura of Kochi Institute of Technology, for their advice and permission to present this report. The authors would like to thank Mr. T. Matsuo for his invaluable contn"outions in experimental works.
REFERENCES
1. Aoyagi,
Y.,
Endoh, T., and Katahira, E, "Experimental Study on Soil-Structure Interaction of Underground Reinforced Concrete Ducts Subjected to Earthquake Loading", Transactions of the llth SMiRT, Vol.K, 1991, pp.387-392.2. Ohtomo, IC, Suehiro, T., Kawai, T., and Kanaya, K.., "Research on Streamlining Seismic Safety Evaluation of Underground Reinforced Concrete Duct-Type Structures in Nuclear Power Stations-Part-2. Experimental Aspects of laminar Shear Sand Box Excitation Tests with Embedded RC Models" To be published on Transactions of the 16th SMiRT, Vol.K, 2001.
3. Minh, N.N., Aoyagi, Y., Ohtomo, K., and Matsumoto, Y., "An Idea of Modeling Soil-RC Duct-Type Structure Interface Under Seismic Loads", Proceedings of Japan Concrete Institute, Vol.22, No.3, 2000, pp.61-66.
4. Japan Society for Civil Engineers, Standard Specifications for Design and Construction of Concrete Structures, 1996. 5. Paulay, T., Priestly, M.J.N., Seismic Design of Reinforced Concrete And Masonry Buildings, Jonh Wiley & Sons. Inc., 1992.