Orbital-free ab initio molecular dynamics study of the
static structure and dynamic properties of the free
liq-uid surface of Sn.
B. G. del Rio1; and L. E. González1
1Departamento de Fisica Teórica, Facultad de Ciencias, Universidad de Valladolid,
Val-ladolid, SPAIN
Abstract. We report results of an orbital-free ab initio molecular dy-namics (OF-AIMD) study of the free liquid surface (FLS) of Sn at 1000 K and 600 K. A key ingredient in the OF-AIMD method is the local pseudopotential describing the ions-valence electrons interaction. We have used a force-matching method to derive a local pseudopoten-tial suitable to account for the variation of the forces from the bulk to the FLS. We obtain very good results for structural properties, such as the reectivity, including the characteristic shoulder it presents in x-ray experiments. Moreover we have been able to study ab initio for the rst time the evolution in some dynamical properties as we move from the central region, where the system behaves like the bulk liquid, to the FLS.
1 Introduction.
Molecular dynamics (MD) simulations have become an essential technique in the study of a wide variety of condensed matter systems, and during the last three decades there has been an increasing amount of systems studied by using ab initio molecular dynamics (AIMD) methods based on density functional theory (DFT) [1]. Most AIMD methods are based on the Kohn-Sham (KS) orbital representation of DFT (KS-AIMD methods) which, although very accurate, imposes high computational demands that severely limit the size of the systems to be studied as well as the extent of the simulation times. Nevertheless, these constraints may be drastically reduced by the orbital-free ab-initio molecular dynamics (OF-AIMD) simulation method [2], whose basic variable is the total valence electronic density instead of the electronic orbitals of the KS-AIMD formulation. The OF-AIMD method substantially reduces the number of variables needed to describe the electronic state and therefore allows to study larger systems for longer simulation times. However, this improvement is achieved at the price of resorting to an approximate description of the electronic kinetic energy, and then, in principle, the OF-AIMD approach is less accurate than the KS-AIMD method. Nevertheless, despite this caveat, the OF-AIMD has provided good descriptions for several static and dynamic properties of a variety of bulk simple liquid metals [3, 4] and free liquid surfaces (FLS) [5].
In 1981 Rice and co-workers predicted, from theoretical considerations and Monte Carlo simulations, that the atomic density near the free surface of a metallic liquid would change in a nonmonotonic way, showing a stratication in layers parallel to the interface [6]. The experimental conrmation of surface layering was rst observed, several years later, in the x-ray reectivity of liquid Hg [7]. Since then, the reectivities of other ve elemental liquid metal surfaces have been measured, namely, Ga, In, K, Sn and Bi [8], all of them displaying (or suggesting, in the case of K) the expected layering peak. Moreover, Sn and Bi have shown a weak wide shoulder at a lower qz that is not present in the other systems. The data obtained for these liquid metals and several binary alloys [9] have shown that the FLS exhibits an oscillatory surface-normal density prole (DP) which extends several atomic diameters into the bulk liquid. In these works the shape of the DPs were deduced by tting the measured reectivities to those predicted within a specic prole model, namely, the distorted crystal model, or variations thereof [8]. Although it would be desirable to obtain the DP in a model-independent way, the lack of phase information in the measurements renders this impossible.
In this paper we report a study of the surface structure of liquid Sn (l-Sn), per-formed through OF-AIMD simulations. Moreover, we have also analyzed the collective dynamics of the system at dierent depths from the FLS. To date, we are awere of only one experimental study of this topic using inelastic x-ray scattering in the FLS of indium [10]. This study showed that the eect of capillary waves is not only present on the surface, but also at very deep regions below the FLS. To our knowledge, the present paper reports the rst ab initio study on the collective dynamics of a free liquid surface.
2 Computational method.
The total potential energy of N ions with valence Z, enclosed in a volume , and interacting with Ne= NZ valence electrons is written, within the Born-Oppenheimer approximation, as the sum of the direct ion-ion coulombic interaction energy and the ground state energy of the electronic system under the external potential created by the ions.
According to DFT, the ground state electronic density, ng(r), minimizes an en-ergy functional given by the sum of the non-interacting electronic kinetic enen-ergy, Ts[n], the electron-ion interaction energy, Eext[n], the classical electrostatic Hartree energy, EH[n], and the exchange-correlation energy, Exc[n], for which we have used the local density approximation, as parametrized by Perdew and Zunger [11]. Dierent expres-sions have been proposed for Ts[n] and in this work we have used an average density model [3, 4].
the force it feels. For this purpose, we have used a force matching method developed recently [13] to obtain a more accurate LPS. In gure 1 we have plotted the local pseudopotential before and after the force-matching process. We can observe how, in order to better represent the interactions, the pseudopotential has to adopt a higher value in reciprocal space near q = 0. Using as benchmark the results of a KS-AIMD calculation for l-Sn [14], in gure 2 we have plotted the dierences in the x and z components of the forces felt by the atoms as obtained in the OF and in the KS calculations at a particular liquid conguration before and after the force matching process. We can observe how with the initial local pseudopotential we can recover reasonably well the forces in the bulk region, but not at the surface (particles are sorted according to their z coordinate). However, after the force matching process, these forces are recovered and the ones in the bulk are improved.
0 5 10
q (a.u.) 0
5 10 15
Vps
nc (q)
Figure 1. Non coulombic part of the local pseudopotential be-fore (full curve) and after (dashed curve) force-matching.
0 50 100 150 200
-0.02 0 0.02
Δ
Fx
(a.u.)
0 50 100 150 200
N particle -0.04
-0.02 0 0.02 0.04
Δ
Fz
(a.u.)
Figure 2. Dierence between the x and z com-ponents of the forces as computed with KS-AIMD simulations [14] and OF-AIMD calculations, before (solid line) and after (dashed line) force-matching.
3 Results and discussion.
3.1 Static structure
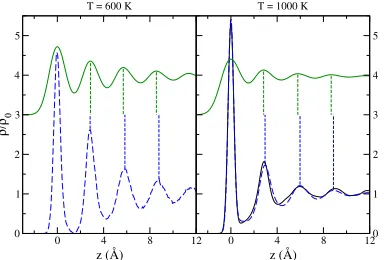
The averange ionic DP was computed from a histogram of the particle positions relative to the slab's center of mass, so that both halves of the slab are being averaged. The obtained results are shown in gure 3, where we observe stratication for at least four layers into the bulk liquid. The spacing between the outermost layer and the rst inner one is out= 2:83 Å, whereas the inner interlayer distances are somewhat larger, namely, in = 2:97 Åat 1000 K. It should be noted that the average DP obtained through the KS-AIMD [14] led to equal interlayer distances of 3:1 Å, which highlights the dependence of the average DP on the conditions of the simulation, in particular the lateral size of the box. At the lower temperature of 600 K the interlayer distances obtained are essentially all equal, with out in= 2:86 Å.
In order to compute the reectivity and compare with the experimental reported results, capillary waves have to be substracted from the system. The most conve-nient method is to obtain the intrinsic density prole through the calculation of the separation surface between the liquid and vapour phases, which is smoothed after-wards, following the procedure of Chacon and Tarazona [17]. In gure 3 we show the intrinsic DP along with the average DP for the two temperatures studied. The layered structure of the interface is more marked in the intrinsic proles. Moreover, the obtained interlayer distances are modied from those in the average DP. The out-ermost interlayer distance is out= 2:96 Å, with the inner interlayer distances being in = 3:02 Åat 1000 K. At the lower temperature of 600 K the dierence between the outermost and inner interlayer distances is more emphasized, with out= 2:83 Å and in = 3:01 Å. It is important to note that, despite the dierences between the average DPs obtained in this work and the one obtained in the KS-AIMD study, the corresponding intrinsic DPs practically coincide (see gure 3).
0 4 8 12
z (Å) 0 1 2 3 4 5 ρ/ρ 0
T = 600 K
0 4 8 12
z (Å) 0 1 2 3 4 5 T = 1000 K
Figure 3. Average ionic DP (full curve, shifted upwards by 3 units) and intrinsic ionic DP (dashed curve) at T=600 Kand 1000 K. At 1000 Kthe lower full curve corresponds to the intrinsic ionic DP obtained using the simulation data from [14].
0 5 10 15 20
z (Å) 0 1 2 3 4 5 6 ρ/ρ 0
0 0.5 1 1.5 2
q (Å-1)
1 10 100 | Φint (qz )| 2
T = 600 K T = 1000 K Exp. 573 K
Figure 4. Comparison of the in-trinsic electronic density proles at 600 K(full line) and 1000 K(dashed line). Inset: comparison of reectiv-ities at 600 K(full line) and 1000 K (dashed line) with the experimental reectivity (circles) [18].
po-sition, using the smoothed separation surface. The intrinsic reectivity is calculated as Rint(qz) = jint(qz)j2, where
int(qz) = 1 e0
Z 1
0 dz exp[ iqzz]
de;int(z)
dz (1)
where e0 is the average bulk electron density. The results obtained are shown in gure 4, where we see a characteristic peak located around qz ' 2:2 Å 1, which is close to 2=in;600K ' 2:1 Å 1, and is related to the layering of the DP. Morever, at around qz ' 0:8 Å 1 we obtain a shoulder, more emphasized at 600 K than at 1000 K, which also appears in the experimental measurements perfomed by Shpyrko et al [18]. The experimentalists ascribed the origin of the shoulder to an increased density in the outermost layer related to its smaller interlayer distance. However this interpretation may be biased by the model that was used and a deeper analysis would be valuable. This will be reported elsewhere.
3.2 Dynamic properties
We want to study the collective dynamics in the slab for dierent regions at dierent depths from the interface. To this end we dene the collective properties (number of atoms, particle density, particle current) corresponding to a given region by multiply-ing the usual denition by a window function that is one inside the region and falls smoothly to zero outside.
From these we compute the corresponding time correlation functions. For instance, the intermediate scattering function, F (q; t) is obtained as
F (~q; t) = h( ~q; t + t0)(~q; t0)i ; (2) and its FT into the frequency domain is the dynamic structure factor, S(q; !).
The symmetry of the system denes a special direction, the z-axis, around which the properties must show cylindrical symmetry. We are particularly interested in waves that propagate parallel to the interface, and therefore among the ~q vectors allowed by the periodic boundary conditions, only those that are perperdicular to the z-axis have been used. In the averages like those of equation 2 we consider all vector orientations that fulll this condition.
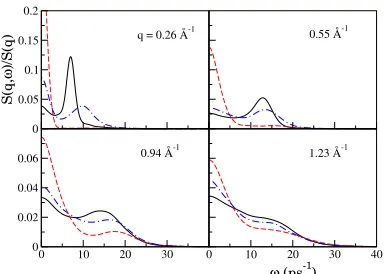
The calculated S(q; !) presented in gure 5 at dierent depths in the slab show side-peaks, indicative of collective density excitations, up to q 1:23 Å 1. Moreover, as one approaches the interface region coming from the bulk, the frequency of the side peaks increases, while the corresponding widths also increase, making the peaks less marked. From the position of the side peaks with respect to q we can obtain the dispersion relation (DR) of the dynamic structure factor, depicted in gure 6. Evaluating the slope of the curve for small q it is possible to obtain an estimate of the adiabatic sound velocity at the corresponding layer. In this case we obtain an increase in the sound velocity from 2700 150 m/s at the bulk region to 3600 200 m/s in the outermost layer. This increase suggests a higher ionic density and a lower compressibility in the outermost layer with respect to the bulk region.
0 0.05 0.1 0.15 0.2
S(q,
ω
)/S(q)
0 10 20 30
0 0.02 0.04 0.06
0 10 20 30 40
ω (ps-1)
q = 0.26 Å-1 0.55 Å-1
0.94 Å-1 1.23 Å-1
Figure 5. Dynamic structure factor at dier-ent q values and depths: outmost layer (dashed curve), rst inner layer (dot-dashed curve) and bulk region (full curve).
0 0.5 1 1.5
q (Å-1)
0 5 10 15 20
ωs
(q) (ps
-1 )
Figure 6. Dispersion relation of S(q; !) at dierent depths: out-most layer (diamonds), rst inner layer (squares), second inner layer (triangles), and bulk region (dots). Dashed curve: Experimental value of the adiabatic sound velocity at 1273 K [19] (2461 m/s).
observe, apart from the usual sound propagation mode, a second contribution at lower frequencies that only appear at small q. This second contribution relates to the DR of capillary waves described by [8], ! =p= q3=2. Note that the eect of the capillary waves not only appears in the rst layers of the slab but extends very deep under the surface. This behaviour was previously observed in an experimental study of a liquid slab of In [10]. The transverse current in the z direction in principle should contain contributions from capillary waves and from shear waves. The latter are only supported starting from a non-zero value of q, whereas the former should disperse as commented above in the small q region. The results shown in gure 8 follow this behaviour for q ! 0, while for larger wavevectors it is not directly possible to disentangle the contribution of each type of waves. However, comparison with the bulk transverse DR, which has lower energy, suggests that we are observing the dispersion of the capillary waves moving from the hydrodynamic into the kinetic regime.
4 Conclusions.
0 0.5 1 1.5
q (Å-1)
0 5 10 15 20
ωL
(q) (ps
-1 )
Figure 7. DRs of CL(q; !) at
dier-ent depths: the symbols have the same meaning as in gure 6. The higher fre-quencies correspond to sound propagation while the lower ones are related to capil-lary waves. Full curve: theoretical DR of capillary waves.
0 0.5 1 1.5 2 2.5
q (Å-1)
0 2 4 6 8
ωz
(q) (ps
-1 )
Figure 8. DR of CT z(q; !) at dierent
depths: the symbols have the same mean-ing as in gure 6. Full curve: theoreti-cal DR of capillary waves. Full curve with open triangles: DR from bulk l-Sn.
We acknowledge the support of the MEC (FIS2014-59279-P) and JCyL (VA104A11-2). BGR acknowledges the nancial support of Universidad de Valladolid.
References
[1] W. Kohn and L. J. Sham, Phys. Rev. 140, A1133 (1965). [2] P. Hohenberg and W. Kohn, Phys. Rev. 136, B864 (1964). [3] D. J. González et al, Phys. Rev. B 65, 184201 (2002).
[4] D. J. González et al, J. Chem. Phys. 115, 2373 (2001); L. E. González, D. J. González and J. M. López, J. Phys.: Condens. Matter 13, 7801 (2001); A. Delisle, D. J. González and M. J. Stott, Phys. Rev. B 73, 064202 (2006); L. E. González and D. J. González, Phys. Rev. E 77, 064202 (2008).
[5] D. J. González, L. E. González and M J Stott, Phys. Rev. Lett. 92, 085501 (2004); 94, 077801 (2005); Phys. Rev. B 74, 014207 (2006).
[6] M. P. D'Evelyn and S. A. Rice, Phys. Rev. Lett. 47, 1844 (1981).
[7] O. M. Magnussen et al, Phys. Rev. Lett. 74, 4444 (1995); E. DiMasi et al, Phys. Rev. B 58, R13419 (1998)
[8] P. S. Pershan and M. L. Schlossman, Liquid Surfaces and Interfaces. Synchrotron X-ray Methods (New York: Cambridge University Press, 2012).
[9] P. S. Pershan, Eur. Phys. J. - Special Topics, 196, 109 (2011).
[10] B. Wehinger, M. Krisch and H. Reichert, New J. Phys. 13, 023021 (2011). [11] J. P. Perdew and A. Zunger, Phys. Rev. B 23, 5048 (1981).
[12] G. M. Bhuiyan, L. E. Gonzalez and D. J. Gonzalez, Eur. Phys. J. - Webof Conferences 15, 01011 (2011).
[15] D. J. González, L. E. González and M. J. Stott, Phys. Rev. Lett. 94, 077801 (2005).
[16] L. E. González, D. J. González and M. J. Stott, J. Chem. Phys. 123, 201101 (2005).
[17] E. Chacon and P. Tarazona, Phys. Rev. Lett. 91, 166103 (2003). [18] O. G. Shpyrko et al, Phys. Rev. B 70, 224206 (2004).