University of South Carolina
Scholar Commons
Theses and Dissertations
2016
Mass Spectrometry-Based Protein Profiling And
Investigations of TGF-ß1-Induced
Epithelial-Mesenchymal Transition Signatures In Namru
Murine Mammary Gland Epithelial Cells
Matsepo Ramaboli University of South Carolina
Follow this and additional works at:https://scholarcommons.sc.edu/etd Part of theChemistry Commons
This Open Access Dissertation is brought to you by Scholar Commons. It has been accepted for inclusion in Theses and Dissertations by an authorized administrator of Scholar Commons. For more information, please [email protected].
Recommended Citation
M
ASSS
PECTROMETRY-B
ASEDP
ROTEINP
ROFILING ANDI
NVESTIGATIONS OFTGF-
1-I
NDUCEDE
PITHELIAL-M
ESENCHYMALT
RANSITIONS
IGNATURES INN
AMRUM
URINEM
AMMARYG
LANDE
PITHELIALC
ELLSby
Matsepo Ramaboli
Bachelor of Science
National University of Lesotho, 1997
Master of Science University of Free State, 2002
Submitted in Partial Fulfillment of the Requirements
For the Degree of Doctor of Philosophy in
Chemistry
College of Arts and Sciences
University of South Carolina
2016
Accepted by:
Qian Wang, Major Professor
Caryn Outten, Committee Member
Guoan Wang, Committee Member
Stephen Morgan, Committee Member
ii
iii
D
EDICATIONThe work in this PhD thesis is dedicated to my late parents Mr. Shesha Booi Hlena and
Mrs ‘Masekete Hlena who taught me the value of good education. They spent most of
their meager resources paying for quality education of their children in prestigious
schools. They were known in our village community of Khanyane in the Leribe disctrict
in Lesotho for their dedication in investing in their children’s future. They themselves
hardly completed high school but they made sure their children acquired college and
graduate education.
Mom and dad, I would not be where I am if it were not for your commitment and
the vision you had for our family.
iv
A
CKNOWLEDGEMENTSI would like to express my sincere gratitude to my academic advisor Professor Qian
Wang who accepted me as a graduate student in his lab. Without his scholarly guidance,
supervision and persistent help, this dissertation would not have been possible.
I am deeply indebted to my committee members, Professor Stephen Morgan,
Professor Caryn Outten and Professor Guoan Wang, for their mentorship and great
contributions towards my candidacy and dissertation defense.
I thank all Wang lab members past and present for their support throughout this
study. Among them, Dr. Gary Horvath, Dr. Yi Chen, Dr. Elizabeth Balizan, Dr. Xinrui
Duan, Dr. Nikki Sitasuwan, Dr. Honglin Li, Dr. Jittima Luckanagul, Dr. Hong Guan,
Enoch Adogla, and Napat Tandikul stand out as people from whom I learned various
research and leadership skills.
My hearty regards go to the faculty and staff of the department of chemistry and
biochemistry, staff of the international student services, and various on-, and off-campus
organizations, and all my friends and family for their empowerment and support.
I am also indebted to various organizations for their financial support; the foreign
Fulbright scholarship under the administration of the Institute of International Education;
Graduate assistantship through a grant in Professor Wang’s lab, and Graduate
v
A
BSTRACTBreast cancer is the second-most common cancer and the second-leading cause of
cancer-related deaths in women. Despite advances in cancer early detection, prevention and
treatment, breast cancer is still a major health challenge due to low survival caused by
breast cancer metastasis. This warrants critical attention and intervention. From the
proteomic standpoint, a protein-based multiplex system that provides large array of informative signals for cancer identification and prognosis is still limited. In this dissertation work, we developed two mass spectrometry-based strategies involving
chemical biology tools for rapid protein fingerprinting of breast cancer cell lines, and for
probing the O-linked N-acetylglucosamine (O-GlcNAc) proteome in transforming growth
factor-beta (TGF-) induced epithelial-mesenchymal transition (EMT), a process that
initiates metastasis. Investigation of O-GlcNAc EMT proteomics is critical in
understanding how aberrant O-GlcNAc post-translational modification (PTM) promotes
cancer invasion and metastasis, as well as in the identification of early stage therapeutic
targets. Until now the role of O-GlcNAc PTM in TGF--induced EMT is unknown.
In Chapter 2, a novel ‘one-step cell processing’ method was developed as a
prerequisite to rapid spectral profiling of mammalian cells using Matrix-Assisted Laser
vi
accomplished, demonstrating the potential of MALDI-MS profiling in breast cancer diagnosis.
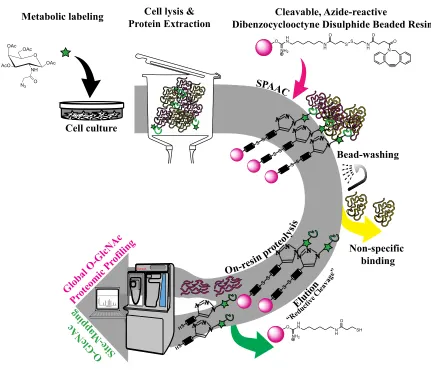
Chapter 3 reports a cleavable azide-reactive dibenzocyclooctyne-disulphide agarose-based beaded resin in Copper-free Click chemistry-based affinity enrichment of
O-GlcNAc proteome from azido-GlcNAc labeled cellular extracts, that enabled the
global O-GlcNAc proteomic profiling by shortgun proteomics with liquid
chromatography-tandem mass spectrometry identification and label-free quantification.
From TGF--induced EMT in MNuMG cells 196 proteins were identified. 125 of these
were putative O-GlcNAc proteins, 75% of which have been previously identified among
GlcNAc affinity enrichment samples. Downstream bioinformatics analyses of the
O-GlcNAc proteome data were performed using Ingenuity Pathway Analysis (IPA)
software. In silico protein-protein interactions revealed a regulatory network for metastasis, while the most significantly represented metabolic and signaling pathways
included glycolysis and several TGF- non-canonical pathways, respectively. A
metastatic regulatory network that features core regulators β-catenin and cyclin-D1 both
of which are regulated by O-GlcNAc transferase supports published study that shows that
“O-GlcNAcylation Plays Essential Role in Breast Cancer Metastasis,”has led us to
hypothesize that TGF- signaling cooperates with O-GlcNAc signaling in promoting
EMT, invasion and metastasis, pending O-GlcNAc site-mapping and validation of the
vii
T
ABLE OFC
ONTENTSDEDICATION ... iii
ACKNOWLEDGEMENTS ... iv
ABSTRACT ...v
LIST OF TABLES ... ix
LIST OF FIGURES ...x
LIST OF ABBREVIATIONS ... xiv
CHAPTER 1:LITERATURE REVIEW ...1
1.1BACKGROUND ...1
1.2EMT AND CANCER ...5
1.3EMT AND TGF- ...7
1.4N-ACETYLGLUCOSAMINE POST-TRANSLATIONAL MODIFICATION ...11
1.5O-GLCNACYLATION AND METABOLISM IN BREAST CANCER ...14
1.6MS-BASED PROTEOMICS ...19
1.7MSINSTRUMENTATION FOR PROTEOMIC PROFILING ...25
1.8SPECIFIC AIMS AND RESEARCH QUESTIONS ...30
REFERENCES ...33
CHAPTER 2:ACOMPREHENSIVE AND INFORMATIVE METHODOLOGY FOR MALDI-TOFMS PROFILING AND DISCRIMINATION OF BREAST CANCER CELLS ...48
2.1ABSTRACT ...48
viii
2.3EXPERIMENTAL SECTION ...53
2.4RESULTS AND DISCUSSION ...59
2.5CONCLUSIONS ...97
REFERENCES ...99
CHAPTER 3:AFFINITY ENRICHMENT AND LC-MS/MSANALYSES OF O-LINKED N-ACETYLGLUCOSAMINYL PROTEOME ...105
3.1ABSTRACT ...105
3.2INTRODUCTION ...106
3.3EXPERIMENTAL SECTION ...114
3.4RESULTS AND DISCUSSION ...131
3.5CONCLUSIONS ...169
REFERENCES ...172
ix
L
IST OFT
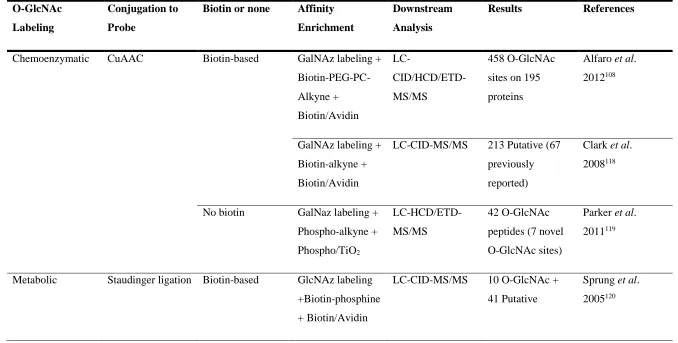
ABLESTable 1.1 Click chemistry-based O-GlcNAc affinity enrichment strategies ...23
Table 2.1 Previously used and currently proposed MALDI-TOF MS profiling strategies for mammalian cells ...68
Table 2.2 The clinicopathological features and the number of spectral profiles of the six breast cancer cell lines ...79
Table 2.3 A binary representation showing presence and absence of protein peaks in the spectra of each of the 73 samples ...89
Table 3.1 Relative Amounts of DBCO Residues Cleaved from the DBCO-functionalized Resin under Different Conditions ...135
Table 3.2 Evaluation of Coupling of DBCO-SS-NHS ester to EAH Sepharose resin ....136
Table A.1 SPAAC enriched O-GlcNAc putative IPA-identified proteins ...179
Table A.2 SPAAC enriched O-GlcNAc putative proteins not identified and not used in IPA ...183
x
L
IST OFF
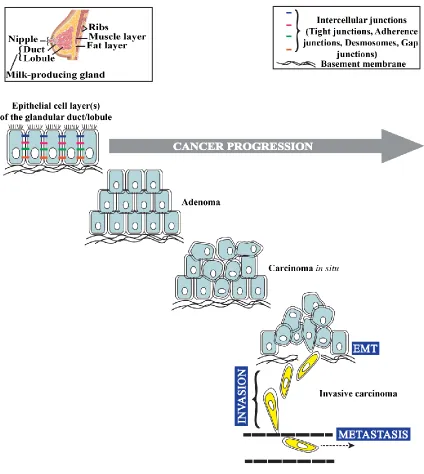
IGURESFigure 1.1 Illustration of different stages of cancer progression in the breast, showing that
primary tumor cells acquire invasive behavior and become migratory through EMT ...2
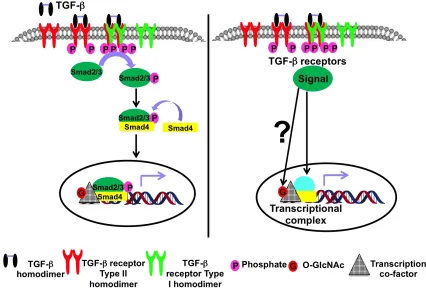
Figure 1.2 Schematic illustration of the canonical TGF-/Smad signaling showing that the effect of TGF-, if any, on the O-GlcNAc modification is unknown ...9
Figure 1.3 Schematic illustration of the hexose biosynthetic pathway showing flow of metabolites from other pathways especially glycolysis and the salvage pathways ...13
Figure 1.4 Illustration of the relationship between O-GlcNAcylation and TGF- signaling, constructed from connections made from findings and reviews ...17
Figure 1.5 Diagram showing the route of ions and signal in the LTQ Orbitrap MS ...28
Figure 1.6 Schematic of the MALDI-TOF-MS analysis ...31
Figure 2.1 A Schematic workflow in MALDI-MS profiling ...52
Figure 2.2 Figure 2.2 The intial spectra of the cell lines NIH3T3 (blue), BHK (red) and HeLa (green) ...62
Figure 2.3 Spectra of NIH3T3 cells generated after rinsing cells with a mixture of chloroform and water (1:1, v/v) ...63
Figure 2.4 Spectra of needle- and syringe-homogenized, DHB-rinsed and DHAP-spotted NIH3T3 samples showing peaks above m/z 16000 ...65
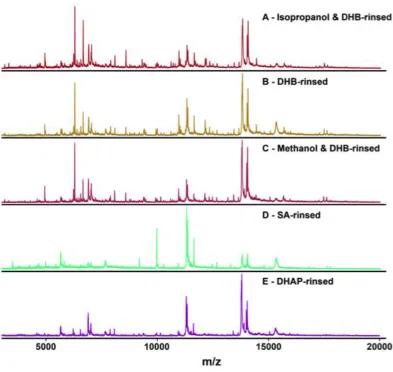
Figure 2.5 Effect on the cell spectra of the five different cell-rinsing matrix solutions ....66
xi
Figure 2.7 Mass spectra showing no effect from treatment of NIH3T3 with PMSF
protease inhibitor ...74
Figure 2.8 Spectra showing effect of short-term stability when incubated on ice prior to MALDI analysis...75
Figure 2.9 Light microscope images of MCF-7 (A, B and C) and MDA-MB231 (D, E and F) cells from three consecutive passages ...81
Figure 2.10 Effect of the time of rinsing cells with extraction/lysis matrix solution on the spectra of MCF-7 and MDA-MB231 ...82
Figure 2.11 The 73 MALDI-TOF MS spectra (replicates) of six human breast cancer cell lines ...84
Figure 2.12 Principal component analyses and classification of 3 sets of data using the in-house data analytic pipeline ...87
Figure 2.13 Projection of the PC scores for the 73 samples following PCA using
BioNumerics software ...95
Figure 2.14 Protein expression profiling and hierarchical clustering of breast cancer cell lines ...96
Figure 3.1Schematic representation of the combined Cu-free Click chemistry-based O-GlcNAc affinity enrichment and shotgun proteomics approach for O-O-GlcNAc
LC-MS/MS glycoproteomic profiling ...112
Figure 3.2 Reaction scheme for the O-GlcNAc glycoproteomic profiling showing the preparation of the “click-able” and cleavable bead probe and its application in affinity enrichment of O-GlcNAc PTM ...113
xii
Figure 3.4 Reaction scheme for bioorthorgonal dye labeling of azido- and
alkyne-modified proteins employing a given panel of fluorophores A-D ...121
Figure 3.5 MALDI evaluation of the “click-able” and cleavable bead probe ...133
Figure 3.6 UV-Vis spectrophotometric evaluation of the coupling of the DBCO-SS-NHS ester to raw beads to produce the affinity bead probe ...138
Figure 3.7 Fluorescence imaging of O-GlcNAc proteins (green) and newly synthesized proteins (blue) in double-metabolically-labeled fixed NMuMG cells ...139
Figure 3.8 Fluorescence imaging of O-GlcNAc proteins (green) in metabolically-labeled fixed NIH3T3 cells ...141
Figure 3.9 Morphological changes and detection of Snail ...143
Figure 3.10 In-gel fluorescence detection of O-GlcNAz-modified proteins ...145
Figure 3.11 Evaluation of the RIPA wash buffer against an in-house bead-washing
protocol ...148
Figure 3.12 Evaluation and comparison of effectiveness of the two bead-washing
protocols ...150
Figure 3.13 SDS-PAGE analysis following O-GlcNAc affinity enrichment ...151
Figure 3.14 Summed intensities of identified proteins from raw and “contaminats-filtered” data generated from five samples with modified or unmodified beads, with or without metabolic labeling in NMuMG cells induced or non-induced with TGF-β1 ...153
Figure 3.15 Global identification of potentially O-GlcNAc proteins in TGF-β1-induced EMT ...155
xiii
Figure 3.17 Cellular metabolic and signaling pathways responding to TGF-β1 induction in NMuMG cells ...159
Figure 3.18 Ingenuity Pathway Analysis was used to extract and display nodes overlaid with expression levels for proteins belonging to the top regulatory network enriched in the experimental data ...161
xiv
L
IST OFA
BBREVIATIONSAC4GalNAz ... Peracetylated N-azidoacetylgalactosamine
Acetyl CoA ... Acetyl coenzyme A
ACN ... Acetonitrile
ACTB ... Beta-actin
ADP... Adenosine diphosphate
BRCA1 ... Breast cancer 1, early onset
BSA ... Bovine serum albumin
BTF3 ... Basic transcription factor 3
CAV1 ... Caveolin1
CCNN1 ... Cyclin D1
CCT ... Chaperonin-containing TCP1
CD44 ... Cluster of differentiation 44
CTNNB1 ... Beta-catenin
CuAAC ... Copper-catalyzed Azide Alkyne Cycloaddition
DBCO ... Dibenzocyclooctyne
DBCO-SS-NHS ...Dibenzocyclooctyne disulphide-N-succinimide ester
dH2O ... Deionized water
DHAP ... Dihydroxyacetophenone
DNA ... Deoxyribonucleic acid
DTT ... Dithiothreitol
xv
EEF2 ... Eukaryotic Translation Elongation Factor 2
EGFR ... Epidermal Growth Factor Receptor
eIF3 ... Eukaryotic Translation Initiation Factor 3
EMT ...Epithelial-mesenchymal transition
ER ... Estrogen Receptor
ERBB2/HER2 ... Human Epidermal Growth Factor Receptor 2
EZR ... Ezrin
FITC ... Fluorescein isothiocyanate
Fruc-6-P ... Fructose-6-phosphate
GalNAc ... O-linked-N-acetyl-D-galactosamine
GalNAz ... O-linked-N-azidoacetylgalactosamine
GAP... Glyceraldehyde-6-phosphate
Glc ... Glucose
Glc-6-P ... D-Glucose-6-phosphate
GlcN-6-P ... D-Glucosamine-6-phosphate
GlcNAc-1-P ... N-acetyl-D-glucosamine-1-phosphate
GlcNAc-6-P ... N-acetyl-D-glucosamine-6-phosphate
Gln... D-Glucosamine
GO ... Gene ontology
HBP ...Hexose Biosynthetic Pathway
HMGB1... High Mobility Group Box 1
HNRNP ... Heterogenous ribonucleoprotein
HSP ... Heat Shock Protein
IgG ... Immunoglobulin G
xvi
K-Rasv12- ...K-Ras glycine to valine mutant
KRT...Keratin
LC-MS/MS ... Liquid chromatography tandem mass spectrometry
LTQ ... Linear trap quadrupole
MALDI-TOF MS ...
... Matrix-assisted laser desorption/ionization-time of flight mass spectrometry
MMP-9 ...Matrix metallopeptidase 9
MST1R ... Macrophage-stimulating 1 receptor
NADPH ... Reduced nicotinamide adenine dinucleotide phosphate
NMuMG ... Namru Murine Mammary Gland Epithelial
OGA ... O-linked-beta-N-acetyl-D-glucosaminidase
O-GlcNAc ... O-linked-N-acetyl-D-glucosamine
OGT ... UDP-GlcNAc:protein-O-linked-beta-N-acetyl-D-glucosaminyl transferase
P120 ... Delta-catenin
PEP ... Phosphoenolpyruvate
PGR ...Progesterone receptor
PIK3CA...Phosphatidylinositol-4,5-bisphosphate 3-kinase
PRKAA2 ... 5’-AMP-activated protein kinase catalytic subunit alpha 2
PSAP ... Prosaposin
RIPA ... Radioimmunoprecipitation assay
SDS ... Sodium dodecyl sulfate
SEER ... Surveillance, Epidemiology and End Results
Smad ... Sma and Mad related protein
SPAAC ... Strain-promoted Azide Alkyne Cycloaddition
xvii
TRII ... TGF- Receptor Type II
TBST ... Tris-buffered saline and Tween 20
TBTA ... Tris[(1-benzyl-1H-1,2,3-triazol-4-yl)mthyl]amine
TFA ... Trifluoroacetic acid
TGF- ... Transforming Growth Factor Beta
UDP-GalNAc ... Uridine diphosphate N-acetyl-D-galactosamine
UDP-GlcNAc ... Uridine diphosphate N-acetyl-D-glucosamine
UPGMA ... Unweighted pair group method with arithmetic mean
UTP ...Uridine triphosphate
UV-Vis ... Ultraviolet-visible
VIM ... Vimentin
1
CHAPTER
1
L
ITERATURER
EVIEW1.1 BACKGROUND
1.1.1 Significance and Rationale
Breast cancer is the second-most common cancer and the second leading cause of
cancer-related deaths in women, with over 200,000 new cases and over 40,000 deaths estimated
in USA in 20151. The current USA SEER records show that survival from cancer has
improved a great deal in the last 20 years due partly to advances in cancer prevention,
early detection and treatment1. However, the 5-year relative survival during 2005-2011
was still remarkably low for metastatic (25%) breast tumors and high for localized (98%)
and regional (84%) tumors2. This difference could be attributed to the fact that primary
tumors can be controlled by early detection and adjuvant treatment while control of
metastatic tumors, as accomplished by chemotherapy, is associated with complications3.
These alarming records suggest that breast cancer is not only a public health problem, but
that breast cancer metastasis is the prominent cause of breast cancer mortality and thus
necessitates critical attention and intervention4.
Breast cancer arises primarily from genetic alterations in the epithelium of the
mammary gland ducts and lobules.5 Breast cancer lesions in these glandular regions may
start as benign and progress through in situ and invasive and ultimately become metastatic if not diagnosed accurately and treated efficiently3, 6-7 (Figure 1.1). Breast
2
Figure 1.1 Illustration of different stages of progression of breast cancers of epithelial origin, showing that primary tumor cells acquire invasive behavior and become migratory through EMT. If cancer is not detected and treated effectively the migratory cells invade the surrounding stroma and gain access to the blood vessels by intravasation, and
3
the primary tumors to migratory and invasive forms that are able to invade the local
tumor stroma and the lymphatic system. These motile cancer cells then enter the blood
and get transported to distant sites where they switch back to epithelial and undergo
survival and proliferation6. Gene expression profiling studies have shown that the
metastatic potential of cancer is revealed very early at clonal stage, and that the
expression signature for metastatic recurrence resembles that of epithelial-mesenchymal
transition (EMT).9 This suggests that early diagnosis is invaluable and that deciphering of
EMT signatures could lead to discovery of efficient drug targets for breast cancer.
1.1.2 Breast Cancer and Molecular Profiling
Breast cancer is a collection of distinct neoplastic diseases that are complex and diverse
in their pathological, clinical and molecular features10. The heterogeneous behavior of
breast cancer has been characterized through molecular profiling using complementary
DNA microarrays.11 On the basis of patterns of gene expression and chromosomal
aberrations, breast cancer has been classified into five molecularly and clinically distinct
subtypes12. These are luminal A, luminal B, HER2-overexpressing, basal-like and normal
breast tissue-like. Luminal A and B tumors are estrogen receptor-positive (ER+) and are
associated with good prognosis. HER2-overexpressing and basal-like tumors have worst
clinical outcome. HER2-overexpressing tumors are ER+ while basal-like ones are
negative to ER, PR and HER213. The gene expression pattern defining each subtype is the
same for the in situ carcinoma and its concomitant invasive form while the
aggressiveness due to chromosomal alterations changes with disease progression towards
metastatic14-15. These insights about breast cancer have been unraveled through molecular
4
Molecular profiling involves high-throughput analysis of gene expression and
chromosomal aberrations on a global scale. It produces massive high dimensional data
that requires further analysis by multivariate statistics and advanced computational
methods16. Compared to the routine histological and immunological techniques that
measure few variables known apriori, molecular profiling analyzes many previously unknown variables17, thus it can reveal new information about breast cancer18. Through
molecular profiling, combinations of gene alterations in the form of gene signatures with
specificity regarding diagnosis, prognosis and prediction to therapeutic response have
been deduced.19 Some representative examples include MammaPrint prognostic test
(70-gene signature),20-21 CINSARC prognostic signature for sarcomas (67-gene
signature), Oncotype DX prognostic kit (16-gene signature),22 and Baylor College
92-gene signature predictive of response to Docetaxel in breast cancer. Among them,
MammaPrint and Oncotype DX are the only ones that have been clinically validated.
Several benefits of the gene signatures that include the understanding of tumor
biology and pathology, subtyping of cancer and development of clinical diagnostic,
prognostic, and predictive tests have been recognized.11 Of importance is the fact that
while the propensity for metastasis and its recurrence could be predetermined and
progressively acquired, respectively23, as well as assessed using genetic tests, the
therapeutic response is the result of interaction of cancer cells with the stroma and other
underlying tissues, and would be best predicted using functional analyses24-25. Therefore,
with the intent to develop molecular personalized treatments, proteins rather than DNA or
RNA are the suitable targets for therapeutic response17. Proteomic profiling of breast
5
expression of different genes, from which proteomic signatures and disease biomarkers
can be deduced. Specifically, proteomic profiling of EMT, a process that resembles
metastatic recurrence by gene expression9, could impact early diagnosis strategies and
development of efficient therapeutic targets for metastatic breast cancer.
1.2 EMT AND CANCER
EMT is a developmental process in which epithelial cells are transformed biochemically
and phenotypically to a migratory form that detaches from the basement membrane26.
EMT plays a role in cellular changes occurring in embryogenesis, tissue fibrosis and
tumorigenesis27. One the one hand EMT contributes to tissue development, wound
healing and homeostasis26, while on the under hand, under certain conditions it promotes
malignancy6. In cancer, specifically, EMT is responsible for dissociation and migration of
tumor cells from primary tumors, and invasion of surrounding tissues leading to
metastasis27. EMT is highly regulated transcriptionally, post-transcriptionally,
translationally, and post-translationally28. The transcriptional program that drives EMT
involves activities of several transcription factors of different families29. Evidence of
regulation by PTMs other than phosphorylation, such as O-GlcNAc that has bearing on
physiological conditions of the cell, is still emerging30. During EMT, a distinct set of
genes is upregulated or down-regulated and the corresponding gene products (RNA,
Protein) may serve as EMT markers or be included in typical EMT signatures31.
Investigation of potential cancer-related EMT protein markers and signatures are the
6
Several studies and reviews have described what happens to cells during EMT.
Briefly, cells disassemble the epithelial intercellular junctions (Figure 1.1) and repress
expression of junctional proteins. Concomitantly, cells upregulate expression of
mesenchymal proteins and ECM metalloproteases, which promote cell invasion.
Predominantly, loss of transmembrane adherence protein of epithelial cells, E-cadherin,
that is often detected during cancer progression, is a characteristic feature of EMT29. This
feature is also a marker for tumor cell invasion6. In addition, the genetic switch from
epithelial to mesenchymal is accompanied by transformation in cellular morphology and
reorganization of the actin cytoskeleton. Specifically, the actin protein changes
structurally from cortical architecture to stress fibers associated with focal adhesion
complex resulting in enhanced ability to migrate32. In some tumors, EMT provides cancer
cells with the ability to dissociate, degrade the ECM, traverse the basal membrane and
invade the surrounding stroma33. Clinically the EMT molecular hallmarks that include
downregulation of E-cadherin, upregulation of mesenchymal genes and remodeling of
extra-cellular matrix are thought to contribute to poor prognosis in many cancers
including breast cancers29.
A holistic view about EMT is that it involves a co-operation between changes in
the cell shape, adherence and migration, resistance to apoptosis-inducing stimuli and
metabolic pathways34. These processes are regulated via signaling pathways that might
have common stimuli or characterized by crosstalk resulting in expression of
characteristic sets of genes31. Thus, systems-based approaches are considered suitable in
understanding molecular dynamics within EMT29. A typical genome-wide gene
7
associated with these changes35. It is envisaged that precise knowledge of such changes in
cancer cells, as revealed by probing the proteome, may lead to characterization of new
candidate biomarkers and therapeutic targets34.
Various researchers have demonstrated that gene ontology and protein-protein
interaction networks enable classification and visualization of distinct features of EMT
from mass spectrometry-identified proteins34, 36-37. Biarc and coworkers observed protein
level structural features of EMT in the form of differentially expressed functional groups
of proteins, where each functional group was referred to as ‘EMT signature’ because of
similarity of expression from two signals, mutant K-Rasv12, and TGF- both of which
induced EMT in the same cell line34. The functional classes of proteins differentially
expressed included ECM proteins, cell adhesion and intercellular junctional proteins,
cytoskeletal proteins, degradation, translation and metabolic machineries. Similarly,
Vergara and co-authors, obtained EMT-associated proteins from proteomic analyses of
non-mesenchymal and mesenchymal breast cancer cellular models37. Protein-protein
interaction networks revealed signaling pathways that regulate EMT including MAPK,
STAT, Src, NF-κB and RhoA. Interestingly, several studies as reviewed elsewhere4, 38,
have shown that TGF- can trigger many of these pathways that regulate EMT, hence our
interest in investigating its possible cooperation with protein O-GlcNAc PTM as
influenced by cellular metabolic changes.
1.3 EMT AND TGF-
TGF- signaling pathway that is triggered by TGF- is recognized as the classical and
8
growth and differentiation cytokines, the TGF- superfamily, whose members regulate a
wide variety of cellular processes in different tissue and cell types40-41. TGF- itself
participates in major cellular processes such as proliferation, differentiation, migration
and apoptosis42. As a potent inducer of EMT, TGF- occurs in high levels in many kinds
of tumors and its levels are often correlated to high invasion and onset of metastasis43. Of
importance, also is the fact that TGF- signaling has antagonistic effects between early
and late tumor stages. Both effects have been demonstrated in vitro in mammary epithelial cellular models and many cancer cell lines44, and confirmed through in vivo
studies, involving TGF- treatment. In early stages of cancer, TGF- acts as a tumor
suppressor by inhibiting cell proliferation and inducing apoptosis, whereas in later stages
of cancer, it promotes tumorigenesis by stimulating EMT, angiogenesis, immune
response escape, stemness, invasion and metastasis45.
TGF-/Smad signaling has been well studied and widely reviewed43, 46-49. Briefly,
TGF- initiates its signals of multifunctional effects by binding to type II
serine-threonine kinase receptor (TRII), thus causing a heteromeric complex formation of this
receptor with type I kinase receptor (TRI), resulting in trans-phosphorylation and
activation of both receptors (Figure 1.2). From TRI, different signaling cascades will be
initiated depending on whether serine-threonine kinase or tyrosine kinase of the receptor
is activated. In canonical TGF- signaling, represented on Figure 1.2, the activated kinase
activity of TRI propagates the signal by phosphorylating serine-threonine residues of
the Receptor-regulated Smads (R-Smads), Smad2 and Smad3. The activated R-Smads
9
10
complex into the nucleus where the Smad proteins modulate the transcription of TGF-
target genes, mainly those encoding Snail proteins and other EMT transcriptional
regulators. In Smad signaling, these EMT regulators aid the heteromeric Smad complex
in DNA promoter recognition and binding.
In non-canonical TGF- signaling, TGF- activates various non-Smad signaling
effectors that produce responses that support EMT program50. These include Ras-Erk
MAP kinase pathway, that mediates growth stimulation; p38 MAP kinase pathway, that
promotes apoptosis; JNK MAP kinase pathway, that modulates phosphorylation of
Smad3 thus enhancing Smad signaling50; mTOR kinase pathway that promotes increase
in cell size and protein synthesis thus supporting cell motility and invasion51; PI3K/Akt
pathway that sequesters Smad3 thus inhibiting antiproliferative effect of Smad352; RhoA
pathway that mediates disassembly of tight junctions53; Integrin-Paxillin, that promotes
focal adhesion formation as adherence junctions disassemble54. In addition, TGF-
signaling can activate other signaling pathways such as Ras and Notch signaling
pathways55. Notch cooperates with hypoxia to regulate Snail transcription factors and
support tumorigenic EMT56.
Mechanistically, TGF- activates complex transcriptional networks to establish
EMT57. The components of the heteromeric Smad complex have low affinity for DNA
and therefore, require interaction with and co-activation by transcriptional co-factors58,
some of which are regulated by O-GlcNAcylation, the PTM under investigation in this
thesis work. The sequential co-activation of the heteromeric co-Smad complex and its
11
the detailed regulation of this co-activation by PTMs such as O-GlcNAcylation in the
EMT literature. Park et al. have demonstrated how the O-GlcNAc modification of Snail1 regulates its transcriptional activities and its phosphorylation59. Certainly, though Snail1
is one of the major regulators of EMT, it is not the only O-GlcNAc regulated
transcriptional co-factor of the heteromeric co-Smad complex. The extent of
O-GlcNAcylation of the heteromeric co-Smad complex transcriptional co-factors and
various TGF- signaling molecules, as well as interplay between the O-GlcNAc and
phosphorylation modifications in this context, have to be explored in order to understand
how aberrant metabolic changes influence EMT, and possibly to demonstrate if inhibition
of such metabolic changes can inhibit EMT, invasion and metastatic spread34.
1.4 N-ACETYLGLUCOSAMINE POSTTRANSLATIONAL MODIFICATION (PTM)
Research on O-GlcNAcylation in breast cancer has gained interest since the discovery
about five years ago that global GlcNAcylation levels are associated with breast cancer
formation and metastasis60. Unlike the classical N-linked and linked glycosylation,
O-GlcNAcylation is a PTM in which a monosaccharide N-acetylglucosamine (GlcNAc) is
attached in -O-linkage to Serine and Threonine hydroxyl groups of nucleocytoplasmic
proteins61-62. It has no consensus motif and it is abundant and reversible and occurs in
multicellular eukaryotes63. It is similar to phosphorylation but different from the
traditional N-, and O-linked glycosylation64-65. Both phosphorylation and
O-GlcNAcylation are dynamic in their response to biological stimulus and widespread
among regulatory and signaling proteins66. Different functional classes of proteins
including transcriptional and translational machinery, degradation proteins, cytoskeletal
O-12
GlcNAcylation67-69. Both PTMs modify same proteins and compete for the same Serine
and Threonine sites of proteins, where their effect is reciprocal and is characterized by a
‘yin-yang’ relationship70-71. Each PTM has two recycling enzymes, one that attaches the
modification (i.e. kinase and OGT), and the other that removes the modification (i.e.
phosphatase and O-GlcNAcase)72-73. These enzymes and their target proteins are in close
proximity since they are colocalized thus allowing for dynamic effect to take place63.
However, the enzymes responsible for N-, and O-linked glycosylation are located in
different cellular compartments (Golgi and ER versus lumen of exocytic and endocytic
organelles), thus making dynamic response unlikely63.
Despite its resemblance of phosphorylation, O-GlcNAcylation is distinct in that it
is directly associated with the nutritional and energy status of the cell74. It is considered a
nutrient sensor because of its responsiveness to the nutrient state of the cell that is
coupled with modulation of function of target proteins making them respond
appropriately to extracellular stimuli75. From the external sources including glucose and
glucosamine, O-GlcNAc is made available for post-translational modification through the
hexosamine biosynthetic pathway (HBP)76 (Figure 1.3). This pathway is linked to
glycolysis during the rate-limiting step in which Fructose-6-phosphate is converted in the
presence of glutamine to Glucosamine-6-phosphate by GFAT77. HBP ultimately produces
UDP-GlcNAc, the substrate for modification of serine and threonine residues of proteins
by OGT enzyme. Aside from glycolysis, several other metabolic pathways are linked to
HBP, hence UDP-GlcNAc is synthesized from several metabolites including glutamine,
13 Glc Glc-6-P Fruc-6-P Gln GlcN-6-P GlcNAc-6-P Acetyl CoA GlcNAc-1-P
UDP-GlcNAc UTP
OGT
OGA
OH O-GlcNAc
H
B
P
f
lu
x GAP PEP
Pyruvate DHAP UDP-GalNAc GalNAc GLYCOLYSIS S A L V A G E P A T H W A Y
14
There are many ways in which glucose uptake and flux through glycolysis are
altered to modulate HBP80. Several signals including those induced by cellular stress,
insulin and many cytokines increase glucose uptake through upregulation of glucose
transporters81. These signals tend to be disease-specific and some are triggered in
response to environmental glucose concentration. In hyperglycaemic conditions, for
instance, high extracellular glucose levels alter cellular function through upregulation of
the HBP leading to elevated levels of UDP-GlcNAc that promote insulin resistance, a
hallmark of type II diabetes77. In cancer, increased glucose flux through HBP is
influenced by abnormal regulation of glycolysis, owing to high energy demands of cancer
cells, regardless of hyperglycaemic conditions82. With regards to TGF- signaling, high
glucose was found to induce endogenous TGF-1 production mediated by HBP in murine
mesangial cells83. The autocrine TGF- stimulation resulted in upregulation of ECM
proteins and reduced proliferation. These observations imply that glycolysis-influenced
glucose flux characteristic to cancer might enhance TGF--induced EMT. However, the
influence of TGF- on glycolysis and HBP to modulate O-GlcNAcylation is not known.
1.5 O-GLCNACYLATION AND METABOLISM IN BREAST CANCER
1.5.1 “Warburg Effect”
Metabolic dysfunction in cancer was first described by O. Warburg in 195684. Now
known as “Warburg effect”, this metabolic shift involves increase in glycolysis under
conditions of high oxygen tension, resulting in enhanced lactate production, as well as
increase in glucose uptake and use of the elevated amounts of glucose as a carbon source
15
UDP-GlcNAc through Hexose Biosynthetic Pathway87. Elevated levels of UDP-GlcNAc
increase the activity of OGT since it is tightly dependent on the concentration of the
substrate UDP-GlcNAc in the cell88. Thus, enhanced glucose uptake and metabolism
result in elevated intracellular (global) O-GlcNAcylation and subsequent modulation of
target proteins to the advantage and support of the cancer phenotypes89. O-GlcNAc levels
are increased in many tumor types89.
O-GlcNAcylation has a role in many biological processes under normal and
diseased states, where in the latter, its effects may be due to faulty metabolic regulation
that contributes to disease pathology60. For instance, in cancer, several tumor-associated
proteins, mostly transcription factors, have been identified as O-GlcNAcylated proteins59,
69, 90. The effects of O-GlcNAcylation on the function of only a few of these proteins, as
well as the roles of their O-GlcNAcylation in cancer progression, have been
investigated59. Snail1, a mediator of TGF- signaling and EMT transcriptional inducer, is
one such protein. The co-regulation of Snail1 through O-GlcNAcylation and TGF-
signaling during cancer progression has not been made clear.
1.5.2 O-GlcNAcylation and Invasion and Metastasis
TGF-- induced EMT is crucial in breast cancer metastasis since many of the breast
carcinomas are of epithelial origin91. It has been established that since loss of E-cadherin
is associated with poor clinical outcome92, the molecule that causes this loss becomes a
marker of malignancy, and a good target for anti-invasive cancer therapy93. Therefore, it
is important to establish E-cadherin repressors during tumor progression. To this end, the
16
clearly understood60, as illustrated in Fig. 1.4. Suppression of E-cadherin was found to be
one way in which the effects of O-GlcNAcylation in breast cancer are mediated60.
Coincidentally, down-regulation of E-cadherin is known to be the key mechanism and
hallmark of EMT, a process that initiates invasion and metastasis6. Therefore, it is
surprising that in investigating the mechanism of how O-GlcNAcylation contributes to
cancer invasion, an upstream process such as EMT nor the signal transduction pathways
associated with it, have not been considered60. Nonetheless, down-regulation of
E-cadherin due to O-GlcNAcylation suggests a crosstalk between O-GlcNAcylation and
signaling pathways leading to EMT, invasion and metastasis, in which, proteins that
regulate and mediate EMT, invasion and metastasis are, in turn regulated by
O-GlcNAcylation. In the context of TGF--induced EMT in breast cancer, Snail1 is the
only regulatory O-GlcNAcylated protein that has been characterized59. The
O-GlcNAcylation of E-cadherin binding partners, p120 and -catenin in breast cancer
suggests that there might be other proteins relevant to breast cancer whose regulation by
O-GlcNAcylation is still unknown. Similar to Snail1, these proteins could be targets for
therapeutic interventions during TGF--mediated EMT, invasion and metastasis. Detailed
knowledge of the critical roles played by O-GlcNAcylation and other modifications on
the function of such proteins is therefore essential.
1.5.3 O-GlcNAcylation and TGF- Signaling
O-GlcNAcylation is known as a link between nutrient sensing and signaling94. Although
this fact is well established in insulin signaling77, few studies provide evidence for the
17 Hexosamine
Biosynthetic
Pathway O-GlcNAcylation TGF-β signaling
Nutrients
Nutrient-sensing
Signaling
Invasion
Metastasis
EMT Sna
il &
other T F’s Snail
?
E-cadherin
E-cadherin
E-cadher in
Glc Gln
Acetyl
CoA UTP
18
glucose and its metabolic sensor (HBP) play in TGF- signaling. On the one hand,
glucose induces phosphorylation of Smad3, and activates Akt-TOR signaling thus
causing increase in protein synthesis and cellular hypertrophy95. Previously, glucose had
been shown to stimulate autocrine activation of TGF- in murine mesangial cells, which
in turn induces collagen gene expression and protein synthesis83, 96. On the other hand,
upregulation of Snail1 by O-GlcNAcylation due to high glucose flux through HBP leads
to tumorigenic EMT, invasion and metastasis59. Although O-GlcNAcylation is not
implicated in the phosphorylation of Smad3, both effects contribute to cancer
malignancy.
Taken together, the previous studies show that TGF- signaling is a well-studied
signal transduction pathway whose role in cancer progression is known but whose
contribution to metabolic dysfunction with regards to Warburg effect of carcinogenesis is
not clear. Therefore study of dynamic regulation of cellular metabolic pathways by
TGF- is critical. Neither the investigation of O-GlcNAcylation of E-cadherin and its binding
partners, p120 and Catenin, nor O-GlcNAcylation of Snail1 alone is sufficient to
demonstrate how TGF- causes metabolic shift and promotes malignancy. Perhaps a
combination of quantitative proteomics and metabolic analysis as reported in Shaw et al. is a suitable approach97. In this thesis, we intend to use mass spectrometry to explore the
O-GlcNAc proteome during TGF--induced EMT, as this proteome can reveal the
19 1.6 MS-BASED PROTEOMICS
1.6.1 Background
The field of proteomics is a collection of various technical disciplines that deal with
large-scale determination of gene and cellular functions directly at the protein level98. A
proteomic approach may take any one of these two routes: 1) MS-based identification of
proteins isolated from cells or tissues, and 2) activity-based biochemical and genomic
analyses that may involve cell imaging, array and chip experiments, and genetic
readouts98-99. In the post-genomic era, rapid identification of proteins using mass
spectrometry is a common proteomic practice100. However, in the traditional sense, this
approach is inadequate for functional proteomics investigations and requires
improvements to be suitable for site-specific mapping of post-translational modifications
and protein-protein interactions25. Recent advancements in MS-based techniques for
protein identification and PTM site-mapping have accelerated functional proteomics and
methodologies are evolving to address inherent challenges posed by the nature of the
biological sample101.
Due to a large dynamic range of proteins in complex biological samples, there is a
bias toward detecting high abundance proteins63. As a result, proteins with low copy
number, many of which are regulatory and post-translationally modified have low
sequence coverage and are unlikely to be detectable102. In addition to being low
abundance proteins, the low stoichiometry of the PTMs and their lability during
collision-induced dissociation (CID) make it more challenging to analyze PTMs103. Hence the
2D-20
PAGE prior to LC-MS/MS is replaced or augmented by affinity enrichment approaches
that selectively isolate sub-population of peptides and proteins bearing the O-GlcNAc
PTM, prior to LC-MS/MS63. By complementing sample pre-fractionation, these
approaches not only effectively reduce sample complexity but also increase proteome
coverage and may be amenable to PTM site mapping.
1.6.2 Affinity Enrichment Approaches for O-GlcNAc PTM
Affinity tags coupled to solid supports such as agarose constitute popular affinity
enrichment strategies for O-GlcNAc-modified peptides and proteins63, 104. Since the
discovery of O-GlcNAc PTM about 30 years ago61, different methodologies involving
covalent and non-covalent attachment to affinity probes have been employed and widely
reviewed105. These include the non-covalent anti-O-GlcNAc antibody-, and lectin-based
strategies, as well as the highly specific chemoenzymatic-, and click-chemistry-based
methodologies. The chemoenzymatic-based method originally involved labeling GlcNAc
sites of proteins with [3H]galactose from UDP-[3H]galactose, with the catalytic action of
-1,4-galactosyltransferase61-62, and subsequent detection of the radiolabeled amino acid
using Edman sequencing106. Khidekel et al. eliminated the use of radiolabeling and modified this method to incorporate keto-galactose using a suitable recombinant
-1,4-galactosyltransferase, followed by biotinylation at its keto moiety, avidin affinity
chromatography and subsequent protein identification by LC-MS/MS107. Wang et al. improved the strategy by using a novel photocleavable biotin probe that improved the
analytical capability of chemoenzymatic labeling103. This strategy was even further
improved by using Click chemistry-based photocleavable biotin probe as described in
21
Prior to the method modification championed by Khidekel and co-workers,
O-GlcNAc sites on only 80 mammalian proteins had been reported109. Using
chemoenzymatic labeling and Orbitrap LC-MS/MS Khidekel et al. then contributed additional 30 proteins110. Although their strategy revolutionized the affinity enrichment
of O-GlcNAc proteins, the analytical performance had low throughput. Due to this
limitation, the improved methodology applied in Alfaro et al.108 is the one considered instead among the highly promising strategies for O-GlcNAc affinity enrichment111.
Alfaro and coworkers performed chemoenzymatic labeling of the O-GlcNAc proteome
from brain tissue using GalNAz, followed by biotinylation using PC-PEG-biotin-alkyne,
and enrichment using avidin affinity chromatograpy. In that study the largest number of
O-GlcNAc sites, 458 from 195 proteins was reported. On the non-covalent front, lectin
weak affinity chromatography strategy as developed by Vosseller et al.112, and applied
later in Trinidad et al.113 and Myers et al.114 is also “high-throughput” proteome-wide, since the latter yielded 142 O-GlcNAc sites from 62 proteins111. Nonetheless, use of
Click chemistry-based strategies involving cleavable reagent as demonstrated in Alfaro et al. and Wang Z. et al. have opened a door to diversity of countless possibilities for
exploiting the CuAAC and SPAAC for affinity enrichment of O-GlcNAc proteins.
Although the CuAAC-based approaches are common, the reagents of the CuAAC
reaction are viewed as toxic and destructive to peptides and to components of the
biotin-avidin system115. Therefore development of SPAAC approaches that exclude
biotin-avidin system is necessary.
In the past few years there has been a growing interest in the application of Click
22
proteins bearing bioorthogonal chemical tags. More than a decade ago Bertozzi and
co-workers established that incorporation of unnatural metabolite provides opportunities for
protein modification and selective labeling of proteins116. In particular these authors
showed that labeling glycoproteins with a unique chemical tag permits their selective
modification from complex mixtures. Such chemical tags eventually facilitate
identification of glycoproteins by proteomic strategies. Various strategies previously
employed in tagging O-GlcNAc modified proteins to form a handle for Click
chemistry-based affinity enrichment are shown in Table 1.2. In general, the enrichment route begins
by attaching the chemical handle to O-GlcNAc proteins through chemoenzymatic or
metabolic labeling, followed by conjugation of the functionalized proteins to the
enrichment probe that may be biotin-, or non-biotin-based. Subsequently the
affinity-enriched proteins are released from the probe and analyzed by LC-MS/MS.
The common practice in click chemistry-based strategies involving metabolic
labeling has been described in the studies of Bertozzi and coworkers117. Treatment of
cells with either azidoacetylglucosamine, azidogalactosamine or
N-alkynylglucosamine results in the metabolic incorporation of the azido sugar into nuclear
and cytoplasmic proteins in place of O-GlcNAc. Briefly, the exogenously added
AC4GlcNAz, AC4GalNAz or AC4GlcNAlk will diffuse into the cells and be deacetylated
by action of intracellular esterases. The deacetylated Azido sugar will then enter the
salvage pathway of the hexosamine biosynthesis where UDP-GlcNAz, a donor substrate
22
23
Table 1.2 Click chemistry-based O-GlcNAc affinity enrichment strategies
O-GlcNAc
Labeling
Conjugation to
Probe
Biotin or none Affinity
Enrichment
Downstream
Analysis
Results References
Chemoenzymatic CuAAC Biotin-based GalNAz labeling +
Biotin-PEG-PC-Alkyne + Biotin/Avidin LC- CID/HCD/ETD-MS/MS 458 O-GlcNAc
sites on 195
proteins
Alfaro et al.
2012108
GalNAz labeling +
Biotin-alkyne +
Biotin/Avidin
LC-CID-MS/MS 213 Putative (67
previously
reported)
Clark et al.
2008118
No biotin GalNaz labeling +
Phospho-alkyne +
Phospho/TiO2
LC-HCD/ETD-MS/MS
42 O-GlcNAc
peptides (7 novel
O-GlcNAc sites)
Parker et al.
2011119
Metabolic Staudinger ligation Biotin-based GlcNAz labeling
+Biotin-phosphine
+ Biotin/Avidin
LC-CID-MS/MS 10 O-GlcNAc +
41 Putative
Sprung et al.
23
24
Table 1.1 (Contd.)
199 Putative (23
validated)
Nandi et al.
2006121
CuAAC Biotin-based GlcNAz labeling
+Biotin-alkyne +
Biotin/Avidin
LC-CID-MS/MS 32 Putative (14
previously
unreported)
Gurcel et al.
2008122
GlcNAlk labeling
+ Azido-azo-biotin
+ Biotin/Avidin
LC-CID-MS/MS 374 Putative (279
previously
unreported)
Zaro et al. 2011123
431 Putative (115
previously
unreported)
Gurel and Zaro et
al. 2014124
No biotin GlcNAz labeling +
resin-alkyne
BEMAD +
LC-CID/HCD-MS/MS
1500 O-GlcNAc
proteins + 185
O-GlcNAc sites on
80 proteins
Hahne et al.
25
translationally modified O-GlcNAc proteins can be covalently derivatized with
biochemical probes that may be biotin-based, in which case the resin should also be
derivatized with the corresponding affinity material, avidin; or alkyne. These affinity
probes are suitable for peptides only, proteins only or both. Below is a synopsis of
selected downstream MS analytical strategies that will be used for proteomic profiling of
breast tumor cells and mammary epithelial tumor model cells.
1.7 MS INSTRUMENTATION FOR PROTEOMIC PROFILING
1.7.1 Background
Mass spectrometry (MS) has become a suitable tool for rapid analysis of proteins sourced
from complex biological mixtures99. As a discipline within the multifaceted field of
proteomics, MS-based proteomics is the current indispensable technology for giving
information about the primary structure of a protein, its post-translational modifications
and its interactions with other proteins125. Most importantly, MS-based proteomics is
capable of solving biological and clinical questions as it can allow: generation of
protein-protein interaction maps; gene ontology annotations based on the protein-protein identification
technology; and analysis of protein expression profiles as a function of cellular state thus
making inference of cellular function possible126. The key role of MS-based proteomics
in cancer research is characterization of proteins through identification, quantification,
and functional assignment, thus, contributing to the understanding of molecular events
involved in cancer progression25. It has been recognized that the proteomic information
will improve cancer diagnosis, prognosis, prevention and treatment through development
26
technology will be applied in protein profiling of breast cancer cell lines as well EMT
breast tumor model cells to test the efficiency of novel sample preparation strategies in
revealing distinguishing features that reflect breast cancer biomarkers and O-GlcNAc
EMT signatures as well as unknown protein functions. Two approaches of protein
profiling, namely; intact cell MALDI-TOF-MS profiling and O-GlcNAc proteomic
profiling will be undertaken. To understand these proteomic approaches, the capabilities
of the two MS instruments of interest, namely; MALDI-TOF-MS and LC-MS/MS (LTQ
orbitrap) have been briefly reviewed.
A mass spectrometer is an instrument that determines the mass of molecules by
measuring their mass-to-charge ratio (m/z) and generates a mass spectrum128. It consists
of three main parts, namely; 1) ion source, where analyte molecules are ionized in
gaseous form, 2) mass analyzer, that measures the mass-to-charge (m/z) ratio of the ions,
and 3) a detector, that records the number of ions at m/z and gives out a signal98.
Although a mass spectrometer was invented in the 19th century, analysis of biomolecules
was only made possible following the discovery of “soft” ionization techniques, MALDI
and ESI, in the late 20th century129-130. These ionization techniques result in minimal
fragmentation of the analyte. MALDI sublimates, in a vacuum, the mixture of matrix and
sample and uses laser pulses to ionize the analyte out of this dry, crystalline mixture of
matrix and sample131. ESI ionizes the analyte coming out of sample solution and is
therefore usually coupled to liquid chromatography132.
Mass measurement of analyte ions generated using either of these two processes
would not be possible if it were not for the powerful mass analyzers coupled therewith
27
performance parameters include sensitivity, resolution, mass accuracy and ability to
generate information-rich MS/MS spectra from peptide fragments133. The four basic
types of mass analyzers with stellar qualities for MS measurements are TOF, ion trap,
quadrupole and Fourier-Transform cyclotron98. MALDI is usually coupled to TOF
analyzer that measures the mass of intact peptides while ESI is often coupled to ion trap
and triple quadrupole mass spectrometers in which fragment ion spectra of selected
precursor ions are generated134. Modern mass spectrometers come with advanced
technology that brings outstanding analytical performance owing to the contribution of
parts that make up their hybrid mass analyzers135-138. Such improvement accounts for
higher mass accuracy, higher detection capability and shorter cycling times that enable
increased throughput and more reliable data139. A typical example of such instruments is
the Linear Trap Quadrupole-Orbitrap ion trap velos mass spectrometer140 (Thermo Fisher
Scientific, Germany) that has been employed in the proteomics studies in this thesis.
1.7.2 The LTQ Orbitrap Mass Spectrometer
In principle, LTQ Orbitrap mass spectrometer has five basic components, namely; an API
ion source, in which the analyte is ionized under atmospheric pressure; LTQ mass
analyzer, in which the masses of ions are analyzed using MS and MSn scan modes; a
C-trap, that allows accumulation and external storage of ions before they are pulsed into the
Orbitrap. The components are shown on Figure 1.5. It is in the orbitrap that the ions
assume circular trajectories around the center electrode and their axial oscillations along
this electrode are detected. The Orbitrap uses the Fourier Transform function to detect
ions hence it shares a similar feature with the high resolution FTICR mass
28
29
one of the newest mass analyzers with outstanding analytical features that include high
mass resolution (up to 150 000), large space charge capacity, and high mass accuracy
(2-5 ppm)141-142. Collectively, the combination of the patented Orbitrap technology and the
powerful Finnigan LTQ linear ion trap in an LTQ Orbitrap mass spectrometer provides
faster, more sensitive and more reliable detection and identification platform for
MS-based proteomics102, 137.
Moreover, Orbitrap mass spectrometer is an instrument of choice for functional
proteomics102. It allows fragmentation of peptides by different modes, collision-induced
dissociation, electron transfer dissociation and high-energy C-trap dissociation102. The
commonly used CID for conventional peptide sequence analysis causes neutral loss of
GlcNAc as an oxonium ion prior to fragmentation of the peptide backbone. As a result,
the peptide bearing the GlcNAc cannot be located143. Conversely, ETD causes
fragmentation of the backbone with GlcNAc modification intact therefore it allows
identification of that peptide and GlcNAc site mapping144-145. HCD also leaves the
modified peptide intact146. Hence, as shown in Table 1.2, affinity enrichment strategies
such as those of Alfaro et al.108 and Hahne et al.111 that were followed by MS analysis involving combinations of fragmentations resulted in reports of high number of
O-GlcNAc sites and proteins with valid O-O-GlcNAc. Derivatization of peptides using
BEMAD improves site identification using CID125. For more confident O-GlcNAc site
30 1.7.3 The MALDI-TOF Mass Spectrometer
MALDI-TOF mass spectrometer, in particular, is widely used for protein profiling and
discovery of disease biomarkers from different biological samples148. As illustrated in
Figure 1.6, it uses pulsed laser irradiation of a co-crystal of a UV-absorbing compound (a
matrix) and the analyte to desorb and ionize the analyte molecules in a gaseous phase131.
A spectrum is then recorded directly following the drift of ions in the flight-tube and their
subsequent detection. Each mass spectrum is a graph of protein intensity against m/z and
consists of a series of protein peaks. MALDI-TOF-MS has proven to be a suitable
instrument for rapid profiling of different biological samples including intact cells151-156.
It has been applied previously for rapid profiling of bacteria, fungi, and human clinical
specimen such as serum and biopsies153, 157-159. It has been employed in this thesis for
profiling of breast cancer cells involving novel sample preparation.
1.8 SPECIFIC AIMS AND RESEARCH QUESTIONS
In chapter 2 of this thesis we asked whether breast cancer cell lines could be rapidly
profiled and distinguished based on their protein mass spectral differences. The specific
aims were to 1) develop a novel sample preparation methodology for rapid MALDI MS
profiling of mammalian cells; and 2) apply the established methodology to distinguish
breast cancer cell lines of different metastatic potential. The novel sample preparation
strategy involved “one-tube” pretreatment of cell pellet with a mixture of unique
composition containing some known MALDI solvents and matrices, followed by
instrumental analysis of the samples to generate their mass spectral profiles, as well as
31
Figure 1.6 Schematic of the MALDI-TOF-MS analysis starting from
desorption/ionization of the protein molecules through display of a spectrum and discrimination between normal and cancer samples using bioinformatics methods. This illustration was adopted from reports of C. Laronga and R. Drake149, as well as Y. Yasui
32
In Chapter 3, we sought to develop a SPAAC-based affinity enrichment strategy
and use it to obtain insights on O-GlcNAc proteome of TGF- induced EMT. We asked
whether TGF-, in inducing EMT, modulates O-GlcNAc modification of
nucleocytoplasmic proteins. Could there be a crosstalk between TGF- and O-GlcNAc
signaling pathways during EMT? The specific aims were to 1) characterize the affinity
enrichment dibenzocyclooctyne-disulphide-beaded resin probe; 2) metabolically label
cellular proteins with GalNAz and enrich the labeled proteome through SPAAC using the
resin; and 3) employ shotgun proteomics to identify and quantify the azido-labeled
O-GlcNAc-proteome of NMuMG cells undergoing EMT. The biochemical probe employed
in this thesis is a unique “Click-able and cleavable” dibenzocyclooctyne-modified resin
that serves as an affinity enrichment tool for the purpose of facilitating mass
spectrometric identification of azido-labeled O-GlcNAc-modified proteins from TGF-
33
R
EFERENCES1. R. L. Siegel, K. D. Miller, A. Jemal, Cancer statistics, 2015. CA Cancer J. Clin.,
2015, 65, 5-29.
2. B. A. Kohler, R. L. Sherman, N. Howlader, A. Jemal, A. B. Ryerson, K. A. Henry, et al., Annual Report to the Nation on the Status of Cancer, 1975-2011, Featuring Incidence of Breast Cancer Subtypes by Race/Ethnicity, Poverty, and State. J. Natl. Cancer Inst., 2015, 107, djv048.
3. A. Journet, M. Ferro, The potentials of MS-based subproteomic approaches in medical science: the case of lysosomes and breast cancer. Mass Spectrom. Rev., 2004, 23, 393-442.
4. E. Foubert, B. De Craene, G. Berx, Key signalling nodes in mammary gland development and cancer. The Snail1-Twist1 conspiracy in malignant breast cancer progression. Breast Cancer Res., 2010, 12.
5. W. Clarke, Z. Zhang, D. W. Chan, The application of clinical proteomics to cancer and other diseases. Clin. Chem. Lab. Med., 2003, 41, 1562-1570.
6. J. P. Thiery, Epithelial-mesenchymal transitions in tumour progression. Nat. Rev. Cancer, 2002, 2, 442-454.
7. P. O'Connell, V. Pekkel, S. A. Fuqua, C. K. Osborne, G. M. Clark, D. C. Allred, Analysis of loss of heterozygosity in 399 premalignant breast lesions at 15 genetic loci. J. Natl. Cancer Inst., 1998, 90, 697-703.
8. C. Nordqvist Breast Cancer: Causes, Symptoms and Treatments.
http://www.medicalnewstoday.com/articles/37136.php (accessed October 01, 2015).
9. S. Ramaswamy, K. N. Ross, E. S. Lander, T. R. Golub, A molecular signature of metastasis in primary solid tumors. Nat. Genet., 2003, 33, 49-54.
10. P. T. Simpson, J. S. Reis-Filho, T. Gale, S. R. Lakhani, Molecular evolution of breast cancer. J. Pathol., 2005, 205, 248-254.
34
12. T. Sorlie, C. M. Perou, R. Tibshirani, T. Aas, S. Geisler, H. Johnsen, et al., Gene expression patterns of breast carcinomas distinguish tumor subclasses with clinical implications. Proc. Natl. Acad. Sci. U. S. A., 2001, 98, 10869-10874.
13. T. Sorlie, R. Tibshirani, J. Parker, T. Hastie, J. S. Marron, A. Nobel, et al., Repeated observation of breast tumor subtypes in independent gene expression data sets.
Proc. Natl. Acad. Sci. U. S. A., 2003, 100, 8418-8423.
14. J. S. Reis-Filho, S. R. Lakhani, The diagnosis and management of pre-invasive breast disease: genetic alterations in pre-invasive lesions. Breast Cancer Res., 2003, 5, 313-319.
15. M. Aubele, A. Mattis, H. Zitzelsberger, A. Walch, M. Kremer, G. Welzl, et al., Extensive ductal carcinoma In situ with small foci of invasive ductal carcinoma: evidence of genetic resemblance by CGH. Int. J. Cancer, 2000, 85, 82-86.
16. S. R. Morris, L. A. Carey, Molecular profiling in breast cancer. Rev. Endocr. Metab. Disord., 2007, 8, 185-198.
17. F. Bertucci, D. Birnbaum, A. Goncalves, Proteomics of breast cancer - Principles and potential clinical applications. Mol. Cell. Proteomics, 2006, 5, 1772-1786.
18. A. Goncalves, F. Bertucci, Clinical application of proteomics in breast cancer: state of the art and perspectives. Med. Princ. Pract., 2011, 20, 4-18.
19. F. Chibon, Cancer gene expression signatures - the rise and fall? Eur. J. Cancer,
2013, 49, 2000-2009.
20. L. J. van 't Veer, H. Dai, M. J. van de Vijver, Y. D. He, A. A. Hart, M. Mao, et al., Gene expression profiling predicts clinical outcome of breast cancer. Nature, 2002,
415, 530-536.
21. M. J. van de Vijver, Y. D. He, L. J. van't Veer, H. Dai, A. A. Hart, D. W. Voskuil, et al., A gene-expression signature as a predictor of survival in breast cancer. N. Engl. J. Med., 2002, 347, 1999-2009.
22. S. Paik, S. Shak, G. Tang, C. Kim, J. Baker, M. Cronin, et al., A multigene assay to predict recurrence of tamoxifen-treated, node-negative breast cancer. N. Engl. J. Med.,
35
23. R. Bernards, R. A. Weinberg, A progression puzzle. Nature, 2002, 418, 823.
24. S. Cleator, A. Ashworth, Molecular profiling of breast cancer: clinical implications. Br. J. Cancer, 2004, 90, 1120-1124.
25. J. D. Wulfkuhle, K. C. McLean, C. P. Paweletz, D. C. Sgroi, B. J. Trock, P. S. Steeg, et al., New approaches to proteomic analysis of breast cancer. Proteomics, 2001,
1, 1205-1215.
26. R. Kalluri, R. A. Weinberg, The basics of epithelial-mesenchymal transition. J. Clin. Invest., 2009, 119, 1420-1428.
27. J. P. Thiery, J. P. Sleeman, Complex networks orchestrate epithelial-mesenchymal transitions. Nat. Rev. Mol. Cell Biol., 2006, 7, 131-142.
28. B. De Craene, G. Berx, Regulatory networks defining EMT during cancer initiation and progression. Nat. Rev. Cancer, 2013, 13, 97-110.
29. H. Peinado, D. Olmeda, A. Cano, Snail, Zeb and bHLH factors in tumour
progression: an alliance against the epithelial phenotype? Nat. Rev. Cancer, 2007, 7, 415-428.
30. H. B. Ruan, Y. Nie, X. Yang, Regulation of protein degradation by
O-GlcNAcylation: crosstalk with ubiquitination. Mol. Cell. Proteomics, 2013, 12, 3489-3497.
31. K. Lee, C. M. Nelson, New insights into the regulation of epithelial-mesenchymal transition and tissue fibrosis. Int. Rev. Cell Mol. Biol., 2012, 294, 171-221.
32. S. B. Jakowlew, Transforming growth factor-beta in cancer and metastasis.
Cancer Metastasis Rev., 2006, 25, 435-457.
33. G. Moreno-Bueno, H. Peinado, P. Molina, D. Olmeda, E. Cubillo, V. Santos, et al., The morphological and molecular features of the epithelial-to-mesenchymal transition. Nat. Protoc., 2009, 4, 1591-1613.
34. J. Biarc, P. Gonzalo, I. Mikaelian, L. Fattet, M. Deygas, G. Gillet, et al.,