ISSN 2286-4822
www.euacademic.org DRJI Value: 5.9 (B+)
An Artificial Neural Network Modelling Approach
for Development of QSAR Model for Anticancer
Activity of Gossypol Acetic Acid against Anticancer
Target BCL2
VARUN KUMAR KASHYAP Research Scholar, Department of Statistics University of Lucknow, Lucknow, India Dr. RAJEEV PANDEY Professor, Department of Statistics University of Lucknow, Lucknow, India
Dr. RAJIV SAKSENA Analyst cum Programmer, Department of Statistics
University of Lucknow, Lucknow, India Dr. FEROZ KHAN Senior Scientist Central Institute of Medicinal & Aromatic Plants Lucknow, India
Abstract:
Key words: BCL2, Cancer, QSAR (Quantitative Structural Activity Relationship), ANN and virtual screening.
1. INTRODUCTION
Cancer is a leading cause of death worldwide. It is a disease of cell characterized by progressive, persistent, abnormal, and uncontrolled proliferations of tissues. Deaths from cancer worldwide are projected to continue rising. By 2030, it is projected that there will be an estimated 26 million new cancer cases and 17 million cancer deaths per year [1]. QSAR is a powerful computational approach used for the study of biological activities with properties or molecular structures which is helpful to explore the relationship between the structures of ligands and their activities [15–17]. Also, it offers the advantages of higher speed and lower costs for bioactivity evaluation, especially compared to experimental testing. In QSAR approach, Multiple Linear Regression (MLR) and Partial Least Square (PLS) are two extensively useful techniques. However, regression analysis gives assumption of a linear relationship between the biological activity and one or more descriptors. On the other hand, biological phenomena are considered nonlinear by nature, and therefore, the contribution of some of the parameters to a specific biological activity can be nonlinear.
The present study develops the QSAR model using Artificial Neural Network (ANN) approach for anti-BCL2 activity of Gossypol acetic acid in case of non-linear biological phenomena.
2. EXPERIMENTAL
an initial data set from NCBI database. Two dimensional molecular descriptors are calculated for each compound for digitization of observational data. Total 255 descriptors are calculated by PaDEL software (National University of Singapore), that sufficiently represents the structural properties of molecules.
2.2. Molecular Descriptors: Initially 255 descriptors are calculated for all compounds. Since, not all of the 255 descriptors contribute to the bioactivity; therefore, following measures were taken to eliminate the less informative descriptors: (i) eliminating the descriptors with constant values, (ii) eliminating the descriptors with more than 90% zero values, (iii) eliminating the descriptors which have constant or zero variance. Consequently, highly correlated descriptors are excluded by using the correlation matrix approach. This filtering step includes selection of those descriptors which have correlation coefficient >0.4 (positive or negative) with bioactivity vector of available datasets. As a result, only 45 descriptors come into existence for further processing. This matrix based feature reduction is used to reduce the variable space and the chance of correlation between the descriptors. Removal of correlated descriptors reduced the noise from the data and finally we get 100 activity compound and 45 descriptors. The selected descriptors use for building ANN model. The detail description about descriptors can be accessed from PaDEL descriptors website (http://www.ncbi.nlm.nih.gov).
adequate coverage in terms of both chemical and biological diversity.
2.4: Validation of QSAR model: For testing the internal stability and predictive ability, QSAR model is validated by the internal, external validation and randomization test procedure.
2.4.1. Internal Validation: Internal validation is carried out using leave-one-out (LOO) method. The cross validation regression coefficient (R2) was calculated using the equation
which describes the internal stability of a model.
∑( )
∑( ̂)
2.4.1.1
Where, R2 refers cross validation regression coefficient,
Yexperimental and Ypred activity of the molecule in the training set,
respectively, and Ÿis the average activity of all molecules in the training set.
2.4.2. External Validation
For external validation, the activity of each molecule in the test set was predicted using the model developed by the training set. The regression coefficient (r2) value is calculated by the
following formula.
∑( )
∑( ̂ )
2.4.2.1
where, refers regression coefficient, Yexp(test) and Ypred(test) are
experimental and predictive test activity of the molecule in the training set respectively, and Ÿtraining is the average activity of
indicative of the predictive power of the current model for external test set. Generally, a QSAR model is considered to have a high predictive power only if the is greater than 0.6 for the test set.
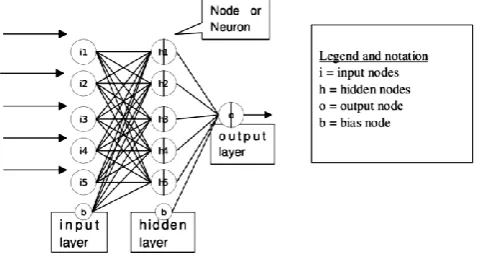
3. ARTIFICIAL NEURAL NETWORK MODEL
ANN is a massive parallel-distributed information processing system that has certain performance characteristics, resembling biological neural networks of the human brain. ANN has been developed as a generalization of mathematical models of human cognition and neural biology [21]. The available data set is partitioned into two parts, one corresponding to training and the other corresponding to test of the model. The purpose of the method is to determine the set of connection weights and nodal thresholds that cause the ANN to estimate outputs that are sufficiently close to target values. This fraction of the complete data to be employed for training should contain sufficient patterns so that the network can summarized the underlying relationship between input and output variables adequately [22].
from the output layer is propagated back to the input layer and the interconnections are modified [23].
An example of a network topology is shown in Figure 1.1.
Figure 1.1 Example of 5-5-1 Neural network Architecture.
4. RESULTS AND DISCUSSION
ANN analysis is performed on all the compounds using R software; we have included all 70 molecules of the training set for the model generation. A number of suitable models are developed by using these 70 molecules wherein we select the best suitable model in our present study. Using ANN method, we were interested to investigate the non-linear characteristics of the activity parameter. Therefore, Feed Forward Neural Network (FFNN) [19] is developed in order to check the dependence of biological activity on structural features.
The multiple-layer FFNN functionality which undergoes a supervised training by the back propagation error is used. The number of neurons in the hidden layer and the number of rows in the training set are balanced to achieve the optimum predictive power for the neural network. The statistics obtained for the FFNN treatment are 𝑁 = 45, input columns (descriptors)
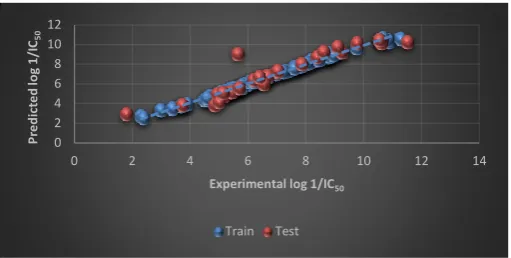
0.30 and R2 for training set is 0.97 and for test set 2 = 0.98. The
plot of predicted bioactivity versus empirical log 1/IC50 based on this model is shown in Fig. 1.2 and the values are shown in Table 1.
Figure 1.2. Graphical plot of Multiple Linear Regression Analysis which indicates linear relationship between experimental and predicted log IC50 with r2= 0.90.
Figure 1.3. Residual plot of Multiple Linear Regression Analysis for experimental and predicted log IC50 .
From the residual plot as shown in Fig.1.3 we say that the compounds in test and train set are equally scattered on the marginal line almost. Some are very far to the marginal line those compounds are treated as an outlier in our data set.
0 2 4 6 8 10 12
0 2 4 6 8 10 12 14
P
re
d
ic
te
d
lo
g
1
/I
C50
Experimental log 1/IC50
Train Test
-4 -3 -2 -1 0 1 2
0 20 40 60 80 100 120
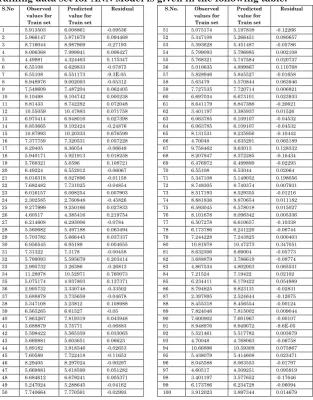
Table 1: The Observed and Predicted Values for each compound in Training data set for ANN Model is given in the following table:
S.No Observed
values for Train set
Predicted value for Train set
Residual S.No. Observed
values for Train set Predicted value for Train set Residual
1 5.913503 6.008861 -0.09536 51 5.075174 5.197838 -0.12266
2 5.966147 5.871679 0.094468 52 5.347108 5.266451 0.080657
3 8.716044 8.987969 -0.27193 53 5.393628 5.451487 -0.05786
4 8.006368 7.999941 0.006427 54 5.799093 5.796985 0.002108
5 4.49981 4.324463 0.175347 55 5.768321 5.747584 0.020737
6 6.55108 6.629833 -0.07875 56 5.010635 4.899867 0.110768
7 6.55108 6.551173 -9.3E-05 57 5.828946 5.845527 -0.01658
8 8.948976 9.002093 -0.05312 58 5.63479 5.570844 0.063946
9 7.549609 7.487204 0.062405 59 7.727535 7.720714 0.006821
10 9.10498 9.104742 0.000238 60 6.697034 6.673101 0.023933
11 8.81433 8.742282 0.072048 61 8.641179 8.847388 -0.20621
12 10.55059 10.47883 0.071758 62 3.401197 3.385937 0.01526
13 6.975414 6.948016 0.027398 63 6.063785 6.109107 -0.04532
14 8.853665 9.102424 -0.24876 64 6.063785 6.109107 -0.04532
15 10.87993 10.20333 0.676599 65 8.131531 8.235956 -0.10442
16 7.377759 7.320531 0.057228 66 4.70048 4.635291 0.065189
17 8.29405 8.36054 -0.06649 67 9.758462 9.63013 0.128332
18 5.940171 5.921913 0.018258 68 8.207947 8.372285 -0.16434
19 5.768321 5.6596 0.108721 69 6.476972 6.499899 -0.02293
20 6.49224 6.552912 -0.06067 70 6.55108 6.53044 0.02064
21 8.016318 8.027896 -0.01158 71 5.347108 5.149052 0.198056
22 7.682482 7.731025 -0.04854 72 8.748305 8.740374 0.007931
23 6.016157 6.008254 0.007903 73 8.517193 8.529355 -0.01216
24 2.302585 2.760848 -0.45826 74 8.881836 8.870654 0.011182
25 9.277999 9.250166 0.027833 75 6.593045 6.578018 0.015027
26 4.60517 4.385416 0.219754 76 8.101678 8.096342 0.005336
27 6.214608 6.293006 -0.0784 77 6.507278 6.610657 -0.10338
28 5.560682 5.497188 0.063494 78 6.173786 6.241226 -0.06744
29 5.703782 5.666445 0.037337 79 7.244228 7.243825 0.000403
30 6.956545 6.95189 0.004655 80 10.81978 10.47273 0.347051
31 7.31322 7.3178 -0.00458 81 8.632306 8.69004 -0.05773
32 5.799093 5.595679 0.203414 82 3.688879 3.786619 -0.09774
33 2.995732 3.26386 -0.26813 83 4.867534 4.802003 0.065531
34 11.28978 10.52971 0.760073 84 7.21524 7.19422 0.02102
35 5.075174 4.937803 0.137371 85 6.234411 6.179422 0.054989
36 2.995732 3.330748 -0.33502 86 8.794825 8.823131 -0.02831
37 3.688879 3.735659 -0.04678 87 2.397895 2.524644 -0.12675
38 5.347108 5.23812 0.108988 88 8.455318 8.456554 -0.00124
39 6.565265 6.61527 -0.05 89 7.824046 7.815002 0.009044
40 7.863267 7.819319 0.043948 90 7.600902 7.601967 -0.00107
41 3.688879 3.75771 -0.06883 91 8.948976 8.949072 -9.6E-05
42 5.598422 5.565359 0.033063 92 5.521461 5.517782 0.003679
43 5.669881 5.603651 0.06623 93 4.70048 4.768063 -0.06758
44 3.89182 3.918346 -0.02653 94 10.66896 10.59309 0.075867
45 7.60589 7.722418 -0.11653 95 5.438079 5.414608 0.023471
46 8.29405 8.297024 -0.00297 96 8.045588 8.063553 -0.01797
47 5.669881 5.618599 0.051282 97 4.60517 4.509251 0.095919
48 6.684612 6.679241 0.005371 98 3.401197 3.577652 -0.17646
49 5.247024 5.288645 -0.04162 99 6.173786 6.234728 -0.06094
Table 2: The Observed and Predicted Values for each compound in Test data set for ANN Model is given by the following table:
S.N o
Observed values for Test set
Predicted value for Test set
Residual S.No Observed
values for Test set
Predicted value for Test set
Residual
1 7.003065 7.162931 -0.15987 15 3.73767 3.825448 -0.08778
2 5.298317 5.053179 0.245138 16 9.249561 9.172455 0.077106
3 5.164786 4.764058 0.400728 17 5.135798 5.025711 0.110087
4 10.63586 10.09866 0.537195 18 7.038784 7.323686 -0.2849
5 10.55059 10.47883 0.071758 19 8.630522 9.15961 -0.52909
6 8.38936 8.669518 -0.28016 20 5.652489 9.044337 -3.39185
7 4.867534 3.850911 1.016623 21 6.194405 6.31785 -0.12345
8 6.659294 6.718832 -0.05954 22 5.703782 5.571212 0.13257
9 4.941642 4.968814 -0.02717 23 9.769956 10.09391 -0.32395
10 7.851661 8.004222 -0.15256 24 1.808289 2.933645 -1.12536
11 6.39693 6.654315 -0.25739 25 6.55108 6.017762 0.533318
12 5.010635 4.077557 0.933078 26 6.39693 6.661641 -0.26471
13 5.438079 5.09744 0.340639 27 11.51293 10.2081 1.304824
14 6.684612 6.788464 -0.10385 28 9.10498 9.692154 -0.58717
CONCLUSION:
Since the biological dataset has tremendous non-linearity and the linear statistical methods do not behave sufficiently for modeling purposes. It is presumed that machine learning methods may provide suitable way for their modeling. Therefore, in the present study we attempted with artificial neural network along with BCL2 inhibitors for regression modeling. It is observed that the ANN method is statistically sound (R2 = 0.97, r2cv = 0.98) for modeling the biological
dataset. The selected descriptors used for ANN model are: BCUTp.1h, VCH.7, hmin, gmax, bpol, SCH.6, MDEC.23, MDEC.12 and MDEC.22. The developed model can be efficiently used for virtual screening of unknown Gossypol acetic acid centered functional analogs against BCL2.
REFERENCES:
2. Afantitis, G. Melagraki, H. Sarimveis, P. A. Koutentis, J. Markopoulos,and O. Igglessi-Markopoulou, “A novel simple QSAR model for the prediction of anti-HIV
activity using multiple linear regression
analysis,”Molecular Diversity, vol. 10, no. 3, pp.
3. S. Daunes and C. D’Silva, “QSAR study on the contribution of Log P and Es to the in vitro antiprotozoal activity of glutathione derivatives,” Journal of Medicinal Chemistry, vol. 44, no. 18, pp. 2976–2983, 2001.
4. S. Paliwal, S. Singh, and M. Pal, “In silico ligand based design of indolylpiperidinyl derivatives as novel histamineH1 receptor antagonists,” Drug Discoveries & Therapeutics, vol. 6, no. 2, pp.69–77, 2012.
5. S. Paliwal, S. Singh, and M. Pal, “In silico ligand based design of indolylpiperidinyl derivatives as novel histamineH1 receptor antagonists,” Drug Discoveries & Therapeutics, vol. 6, no. 2, pp. 69–77, 2012.
6. Verma RP, Hansch C (2009) Taxane analogues against lung cancer: a quantitative structure-activity relationship study. Chem Biol Drug Des 73(6):627-36. 7. Hansch C, Verma RP (2009) A QSAR study for the
cytotoxic activities of taxoids against macrophage (MPhi)-like cells. Eur J Med Chem 44(1):274-9.