20th International Conference on Structural Mechanics in Reactor Technology (SMiRT 20) Espoo, Finland, August 9-14, 2009 SMiRT 20-Division III, Paper 1727
Comparative Stress Analyses of Major RCPB Components by Using a Prototype
of Integrated Finite Element Model
Shin-Beom Choi
a, Yoon-Suk Chang
a, Jae-Boong Choi
a, Young-Jin Kim
a,*,
Myung-Jo Jhung
b, Young-Hwan Choi
band Tae-Eun Jin
ca
School of Mechanical Engineering, Sungkyunkwan University, Suwon 440-746, Korea, [email protected]
b
Korea Institute of Nuclear Safety, Daejeon 305-338, Korea
c
Korea Power Engineering Company Inc., Yongin 446-713, Korea
Keywords: Design Transient, Fatigue Life Evaluation, Finite Element Analysis, Reactor Coolant Pressure Boundary, Structural Integrity
1
ABSTRACT
Since oppositions against new construction of nuclear power plants are getting stronger, despite rapidly rising electric power demand, safe operation of existing plants until the optimum life becomes important. In this context, lots of efforts have been devoted for development of enhanced structural integrity assessment techniques required to prevent unanticipated failures due to primary water stress corrosion cracking for instance and further re-evaluations often needed to fulfil current licensing bases as well as to eliminate over-conservatisms for continued operation beyond their design lives. The objective of this paper is to introduce a prototype of integrated model conceived to assist synthetic fatigue evaluation and to manage safety of major RCPB (Reactor Coolant Pressure Boundary) components. Complex three-dimensional geometries are modeled for reactor coolant system of OPR1000 (1000MWe Optimized Power Reactor) and finite element analyses are carried out employing representative design transients. Resulting stress components at critical locations are compared with those obtained from previous finite element analyses by the authors for each major RCPB component; the vessel, pressurizer and steam generator. Lessons learned to determine optimized mesh and numerical analysis conditions are fully discussed from exactness and cost efficiency points of view.
2
INTRODUCTION
3
THREE-DIMENSIONAL FINITE ELEMENT MODELS
3.1 FE Meshes
3.1.1 An integrated model
A prototype of integrated FE model was prepared to efficiently get stress distributions at critical locations. Hypermesh ver. 9.0, a commercial mesh generation program, was used and two element types such as hexa-dominant and tetrahedron were chosen for mesh construction as shown in Fig. 1. The integrated FE model, employed in the present work, is consists of 320,168 nodes and 465,263 elements. As boundary conditions, all degree of freedoms at the end parts of steam generator (SG) and reactor coolant pump (RCP) was constrained. The shear lug and skirt region of pressurizer (PZR) were fixed all directions. Four nozzles, connected with cold leg, were also fixed all directions in reactor pressure vessel (RPV) and the shear lug of SG was fixed Y-direction. Then, FEA was carried out by using the general-purpose finite element program, ANSYS.
Figure. 1 A prototype of integrated finite element model
3.1.2 Each major component
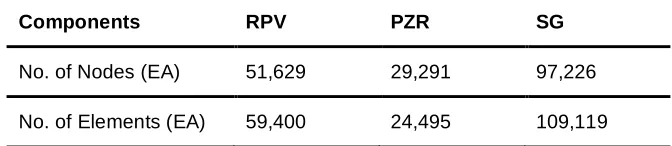
To compare with the integrated model, each FE model of major components such as RPV, PZR and SG was developed. These FE models are comparable to parts of the integrated FE model, i.e., mesh information of each component is the same with integrated model. Table 1 summarizes mesh information of each component.
Table 1. Mesh information of each component
Components RPV PZR SG
No. of Nodes (EA) 51,629 29,291 97,226
3.2 Model Verification
3.2.1 Critical locations
Figs. 2~4 represent critical locations selected for comparison of stress distributions. RPV has three critical locations such as beltline region (Point A), bottom head to shell weld region (Point B) and bottom head to shell transition region (Point C). Three locations such as the end point of surge nozzle (Point D), the bottom head to shell transition region (Point E) and shell region (Point F) are selected as critical locations in PZR. Also, three critical locations of SG are the end of nozzle (Point G), shell transition region (Point H) and complicate geometry (Point I).
Figure 2. FE model and critical locations of reactor pressure vessel
Figure 4. FE model and critical locations of steam generator
3.2.2 Comparison of stress components
The well-known Lame’s equation was adopted to validate FE model, in which when cylinder is subjected to internal pressure only, stresses are calculated as below:
) 1
( 2
2
2 2
2
r b a b
p
a i
h +
!
=
" (1)
where, h is the hoop stress, a is the radius of bore, b is the radius of external surface and pi is the internal
pressure. And r is the variable, as a plot is usually needed of the stresses from a to b. The hoop stress distribution of inner surface was compared with that of theoretical solution at each component. The average differences were less than 3% as depicted in Table 2, which shows validity of the FE model.
Table 2. Difference between FEA results and theoretical solutions of integrated finite element model
Components RPV PZR SG
Avg. Difference (%) 0.4 1.6 1.6
Max. Difference (%) 0.7 2.4 2.5
4
FINITE ELEMENT ANALYSIS USING DESIGN TRANSIENT
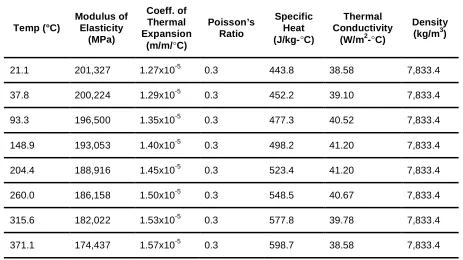
4.1 Material properties
Table 3. Physical and mechanical properties used in this analysis Temp (°C) Modulus of Elasticity (MPa) Coeff. of Thermal Expansion
(m/m/°C)
Poisson’s Ratio
Specific Heat (J/kg-°C)
Thermal Conductivity
(W/m2-°C)
Density (kg/m3)
21.1 201,327 1.27x10⁻⁵ 0.3 443.8 38.58 7,833.4
37.8 200,224 1.29x10⁻⁵ 0.3 452.2 39.10 7,833.4
93.3 196,500 1.35x10⁻⁵ 0.3 477.3 40.52 7,833.4
148.9 193,053 1.40x10⁻⁵ 0.3 498.2 41.20 7,833.4
204.4 188,916 1.45x10⁻⁵ 0.3 523.4 41.20 7,833.4
260.0 186,158 1.50x10⁻⁵ 0.3 548.5 40.67 7,833.4
315.6 182,022 1.53x10⁻⁵ 0.3 577.8 39.78 7,833.4
371.1 174,437 1.57x10⁻⁵ 0.3 598.7 38.58 7,833.4
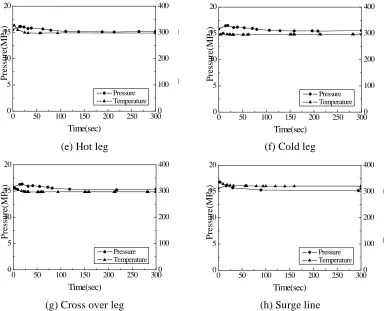
4.2 Design transients
The transient data were taken from design stress reports of OPR1000. Among diverse transients, ‘large turbine step load decrease’ was chosen for 3-D finite element analyses. Fig. 5 shows the pressure and temperature variations used for stress analyses. The time histories of pressure and temperature were applied as a distributed load to the inner surfaces of each component.
0 100 200 300 400
0 50 100 150 200 250 300
0 5 10 15 20 T em p er at u re (
°C)
Pressure(MPa) Time(sec) Pressure Temperature 0 100 200 300 400
0 50 100 150 200 250 300
0 5 10 15 20 T em p er at u re (
°C)
Pressure(MPa)
Time(sec)
Pressure Temperature
(a) RPV (b) PZR
0 100 200 300 400
0 50 100 150 200 250 300
0 5 10 15 20 T em p er at u re (
°C)
Pressure(MPa) Time(sec) Pressure Temperature 0 100 200 300 400
0 50 100 150 200 250 300
0 5 10 15 20 T em p er at u re (
°C)
Pressure(MPa)
Time(sec)
Pressure Temperature
0 100 200 300 400
0 50 100 150 200 250 300
0 5 10 15 20 T em p er at u re (
°C)
Pressure(MPa) Time(sec) Pressure Temperature 0 100 200 300 400
0 50 100 150 200 250 300
0 5 10 15 20 T em p er at u re (
°C)
Pressure(MPa)
Time(sec)
Pressure Temperature
(e) Hot leg (f) Cold leg
0 100 200 300 400
0 50 100 150 200 250 300
0 5 10 15 20 T em p er at u re (
°C)
Pressure(MPa) Time(sec) Pressure Temperature 0 100 200 300 400
0 50 100 150 200 250 300
0 5 10 15 20 T em p er at u re (
°C)
Pressure(MPa)
Time(sec)
Pressure Temperature
(g) Cross over leg (h) Surge line
Figure 5. The time histories of pressure and temperature used in this analysis
5
FINITE ELEMENT ANALYSIS RESULTS
The von Mises stresses, one of representative FEA results, obtained at critical locations were compared between individual FE models and integrated FE model. As depicted in Fig. 6, stress distributions from the integrated model are well matched with those of individual models except for Points A, D and I because they are connected with other components. For example, Point A is close to the connection between hot leg and nozzle of RPV. Point D is a connecting point between surge nozzle of PZR and surge line piping. Also, Point I is close to the connection between hot leg and nozzle of SG. It means that complex geometry can affect FEA results and, in this case, the use of integrated FE model is desirable to simulate realistic structural behaviour. Another reason of the difference is inconsistency of loading conditions between two types of models. When FEAs of individual models are carried out, external loads due to connecting components such as piping were not considered. So, if external loads are taken into account, more reasonable comparison will be available. Table 4 compares FEA results between the individual FE models and integrated FE model at critical locations, and Fig. 7 represents von Mises stress distribution over the integrated model.
Table 4. Difference of von Mises stresses between individual FE models and integrated FE model
Location A B C D E F G H I
Avg. Difference (%) 5.8 0.2 0.8 57.7 0.004 0.002 0.5 1.62 48.5
0 50 100 150 200 250 300 0 50 100 150 200
von Mises stress(MPa)
Time(sec)
FEA result of integrated FE model FEA result of individual FE model Reactor Pressure Vessel
0 50 100 150 200 250 300
0 50 100 150 200
von Mises stress(MPa)
Time(sec)
FEA result of integrated FE model FEA result of individual FE model Reactor Pressure Vessel
0 50 100 150 200 250 300
0 50 100 150 200
von Mises stress(MPa)
Time(sec)
FEA result of integrated FE model FEA result of individual FE model Reactor Pressure Vessel
Point A Point B Point C
0 50 100 150 200 250 300
0 50 100 150 200
von Mises stress(MPa)
Time(sec)
FEA result of integrated FE model FEA result of individual FE model Pressurizer
0 50 100 150 200 250 300
0 50 100 150 200
von Mises stress(MPa)
Time(sec)
FEA result of integrated FE model FEA result of individual FE model Pressurizer
0 50 100 150 200 250 300
0 50 100 150 200
von Mises stress(MPa)
Time(sec)
FEA result of integrated FE model FEA result of individual FE model Pressurizer
Point D Point E Point F
0 50 100 150 200 250 300
0 50 100 150 200
von Mises stress(MPa)
Time(sec)
FEA result of integrated FE model FEA result of individual FE model Steam Generator
0 50 100 150 200 250 300
0 50 100 150 200
von Mises stress(MPa)
Time(sec)
FEA result of integrated FE model FEA result of individual FE model Steam Generator
0 50 100 150 200 250 300
0 10 20 30 40 50
von Mises stress(MPa)
Time(sec)
FEA result of integrated FE model FEA result of individual FE model Steam Generator
Point G Point H Point I
Figure 6. FEA results obtained from individual models and integrated model at critical locations
6
CONCLUSION
In this research, to evaluate possibility to use of integrated model, comparative FE analysis was carried out and its validity was proven. However, some exceptional discrepancy was captured at connection locations, which seems to be caused by complex geometry and loading conditions. So, further activities are being carried out such as mesh optimization, assessment to reflect specific material properties and environmental effects, which will be helpful to efficiently obtain more accurate results. Also, these works will be combined with another activity to develop a web-based aging monitoring system.
Acknowledgements. The authors are grateful for the support provided by a grant from Post Brain Korea21
Center at Sungkyunkwan University.
REFERENCES
Ahn, M. Y., Kim, J. C., Chang, Y. S., Choi, J. B., Kim, Y. J., Jhung, M. J. and Choi, Y. H., 2005, Fatigue Life Evaluation of Reactor Pressure Vessel using Three-dimensional Green’s Functions, Journal of the Korean Society of Pressure Vessels and Piping, Vol. 1, No. 1, P. 1-10.
Korea Institute of Nuclear Safety, 2007, Study on Integrity Evaluation for Pressurized Components in Nuclear Power Plant, KINS/HR-772.
American Society of Mechanical Engineers, 2002, ASME Boiler and Pressure Vessel Code Section III. Hibbler, R. C., 2000, Mechanics of Materials, 4th Edition, Prentice Hall Inc., P. 409-412.
Timoshenko, S. P. and Goodier, J. N., 1982, Theory of Elasticity, 3rd Edition, McGraw-Hill International Editions, P. 68-71.
Chang, Y. S., Choi, S. B., Choi, J. B., Kim, Y. J., Jhung, M. J. and Choi, Y. H., 2006, Formulation of three-dimensional Green’s function and its application to fracture life evaluation of pressurizer, Key Engineering Materials, Vol. 326-328, P. 931-934.
Logan, D. L. 2006, A First Course in the Finite Element Method, 4th Edition, Thomson.