Algorithm Approach to Multiple Input
Multiple Output (MIMO) Systems
G.Srinivasarao
Senior Assistant Professor, Dept. of IT, GITAM University, Visakhapatnam India
ABSTRACT: The focus of article is to develop rather than suppress multipath propagation in MIMO systems. V-BLAST algorithm is used in 3 different architectures: 2x4, 4x8, and 8x12 in our MATLAB simulation, Plots of symbol error rate versus Eb/No for the 3 different simulated architectures presented. Increase in number of receive antennas from two to four, four to eight and eight to twelve, the benefit of receive diversity is enhanced and hence improved in 2x4, 4x8 and 8x12 systems. Results reveal that for low SNR, the improvement in receiver performance for eight – by – twelve is significantly better than that for two – by – four and four- by- eight systems.
I.INTRODUCTION
In recent years, wireless communication gained importance in multipath emerged Multiple- Input Multiple –
Output (MIMO) communications architecture. The concept of MIMO was first introduced by Jack Winters [2], In [3-4] Marzetta et.al, proposed asymptotic expressions for the capacity of the single antenna non-coherent channel for large block – lengths and SNR. Zheng et al. extended the asymptotic results to multi – antenna block fading channels that reveal that capacity and SNR [109] vary logarithmic manner. In [5]Lapidothet.al, considered fading channels for study of capacity with SNR. Foschini [3] and Teltar[5] proposed that the MIMO channel capacity varies linearly with the number of antennas [6]. Channel capacity grows linearly with m = min (M, N). It has been demonstrated that increasing the number of antennas in the both ends results in a rapid increase in theoretical capacity Main limitations on the MIMO capacity are the correlation between individual sub channels of the matrix channel [[1], 7, 8] and the number of multipath components or scatters [2].
An efficient tool for wireless communications which is scattered is proposed by BLAST [3, 4] with its architecture implemented in multipath propagation. The Diagonal BLAST architecture was pioneered by Foschini et al. (1996),(1999), (2003).
V-BLAST algorithm is used in 3 different architectures, 2x4, 4x8 and 8x12 these are explained in section. Plots of symbol error rate (SER) versus Eb/No for the 3 different simulated architectures are presented.
II. MIMO CHANNEL CAPACITY
The assumption of flat fading holds in MIMO because it is a narrow band[9] concept with majority of channel capacity expression involved. In estimation of coherent bandwidth the wide band case is good approximation then narrow band with higher capacity. The channel estimation is intended to identify the channel between each pair of antennas. For a typical MIMO system[10] consists of a number of transmit and receive antennas as shown in fig 1. For system of M x N antennas in narrow band system the transmission matrix is form
H=
ℎ11ℎ12ℎ13… . ℎ1𝑚 ℎ21ℎ22ℎ23… . ℎ2𝑚 − − − − − − − − − − − − − − ℎ𝑁1ℎ𝑁2ℎ𝑁3… . ℎ𝑁𝑚
Fig.1 MIMO Architecture
The terms of matrix include MISO, SIMO and SISO which include narrow band Rayleigh stationary channel during data burst, channel knowledge at the receiver, additive white Gaussian noise (AWGN) and total transmitted power remains the same regardless of the number of transmit antennas.
III. CORRELATION MATRIX MODELS AND EXPONENTIAL CORRELATION MATRIX MODEL
Simulation of channel capacity based on the assumption that the channel matrix consists of independent and identically distributed. Rayleigh fading coefficients reveal capacity of single receiver system for MIMO is good approximation than single transit that changes from 52b/s/Hz than 7b/s/Hz [1]. SIMO, MISO and MIMO prevails due to antenna circulation in which diversity and multiplexing gains are reduced significantly with high correlation coefficient. This coefficient is low (0.1 - 0.5) for selected base station and received antenna configuration. In uniform correlation matrix model [7], the correlation co-efficient r=0.5 corresponds to Rij = r, i ≠ j.
Capacity (O ≤ r <1, 𝜌
𝑁>> 1).
r – is the normalized channel correlation matrix. i – is the receiving antenna.
j = is transmitting antenna. C= N.log2 1 +𝜌
𝑁 (1 − 𝑟) . … (2)
The MIMO channel capacity using uniform model given [7] in equ.2 and further studies are performed with exponential correlation matrix model.
Exponential correlation Matrix Model
Rij= 𝑟 𝑖−𝑗 , 𝑟 ≤ 1, and rj *1, i>j
The correlation coefficient of neighboring receive branches Capacity ( 𝑟 < 1,𝜌
𝑁≫ 1, 𝑁 ≫ 1)
C = N. log2 (1+
𝜌
𝑁 (1 − 𝑟
2) ) … (3)
The signal to Noise ratio (SNR) is 3dB loss at correlation coefficient equal to 0.7. In the limiting case of n → , one obtains from equation 3:
C ∞= 𝜌
𝑙𝑛2 ((1 − 𝑟
And C = −𝜌
𝑙𝑛2
Comparison of equation 3 and 4 with 5 indicate loss in SNR due to channel correlation.
An interpretation of these equations attribute sources of interference that assure due to correlation between individuals sub channels resulting in noise.
The channel capacity of MIMO depends on correlation between individual sub channels and not on correlation coefficient phase. Results reveal that capacityis decreased significantly that for r>0.7 in comparison with resultsobtained by spatial diversity techniques .
An encapsulation channel capacity and correlation coefficientis evaluated by the uniform correlation matrix el and exponential correlation matrix model for N=40 and 200, and ρ = 27dB are illustrated in figure 2 and 3 for comparison. Study of figures 2and3 reveal that results are accurate as decrease as Nand ρ /N decrease. Lower capacityfor r = 0.5 corresponds to 3dB loss in SNR is predicted by uniform correlation model and tabulated in table 1.
Channel capacity with uniform correlation matrix model for N=M=40 and 200 andρ = 27dB and 30dB respectively, with correlation coefficient„r‟ varying from minimum to maximum. It depicts that MIMO channel capacity of a deterministic channel versus the correlation coefficient evaluated by the uniform correlation matrix model [11].
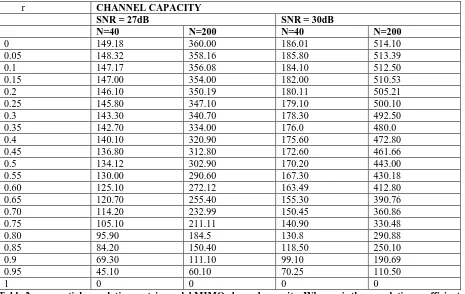
Table 2 to depicts the exponential correlation matrix model for N=M=40 and 200 and ρ = 27dB and 30dB respectively, with varying from 0 to 1.
From fig.2 and Table 1 the MIMO capacity decreases significantly for r > 0.5. The exponential correlation model predicts lower capacity, with correlation coefficient r = 0.7 corresponds to 3dB loss in SNR as shown in Table 2 from figure 3 and table 2 the MIMO capacity decreases significantly for correlation coefficient r > 0.7.
r CHANNEL CAPACITY
SNR = 27dB SNR = 30dB
N=40 N=200 N=40 N=200
0 150.11 360.10 185.10 500.92 0.05 147.6 350.45 182.17 495.00 0.1 144.1 340.10 180.18 448.80 0.15 141.40 328.20 175.02 470.06 0.2 139.20 316.00 172.5 460.12 0.25 136.01 301.15 170.15 445.60 0.3 132.21 290.15 166.80 430.92 0.35 128.7 275.18 160.30 415.15 0.40 124.6 262.18 159.00 390.18 0.45 120.11 245.17 153.80 380.3 0.50 115.15 230.30 148.36 355.45 0.55 107.25 215.12 142.50 335.10 0.60 100.36 199.10 135.36 315.90 0.65 95.16 180.10 130.44 286.32 0.70 91.10 160.60 120.59 260.12 0.75 80.11 135.30 112.80 230.12 0.80 55.10 115.1 100.30 192.32 0.85 42.80 90.10 85.90 160.90 0.90 -25.16 60.10 70.10 115.99 0.95 0 30.06 45.00 62.32
1 0 o o o
r CHANNEL CAPACITY
SNR = 27dB SNR = 30dB
N=40 N=200 N=40 N=200
0 149.18 360.00 186.01 514.10 0.05 148.32 358.16 185.80 513.39 0.1 147.17 356.08 184.10 512.50 0.15 147.00 354.00 182.00 510.53 0.2 146.10 350.19 180.11 505.21 0.25 145.80 347.10 179.10 500.10 0.3 143.30 340.70 178.30 492.50 0.35 142.70 334.00 176.0 480.0 0.4 140.10 320.90 175.60 472.80 0.45 136.80 312.80 172.60 461.66 0.5 134.12 302.90 170.20 443.00 0.55 130.00 290.60 167.30 430.18 0.60 125.10 272.12 163.49 412.80 0.65 120.70 255.40 155.30 390.76 0.70 114.20 232.99 150.45 360.86 0.75 105.10 211.11 140.90 330.48 0.80 95.90 184.5 130.8 290.88 0.85 84.20 150.40 118.50 250.10 0.9 69.30 111.10 99.10 190.69 0.95 45.10 60.10 70.25 110.50
1 0 0 0 0
Table 2 exponential correlation matrix model MIMO channel capacity. Where r is the correlation coefficient and n is the number of antennas (M=N=n)
IV.V – BLAST ARCHITECTURES
Recent studies in wireless communication deals with MIMO that is rich multi – path rich multi – path environment [3]. A family of MIMO architectures emerged for systems employing multiple antenna arrays at transmit and receive end termed as BLAST.
The idea of this architecture is to explore multipath propagation with incoming binary stream of data demultiflexed into M subcarriers. To transmit over channel those are encoded independently and mapped to antenna by modulation. So that they are transmitted independently along with coded substreams. During transmission the result of symbols leading to interference is performed by its algorithm termed as V-Blast algorithm which is implemented in [3][5]. The results for 2 transmitters, 4 receivers are shown along with the results for 4x8 and 8x12 architectures.
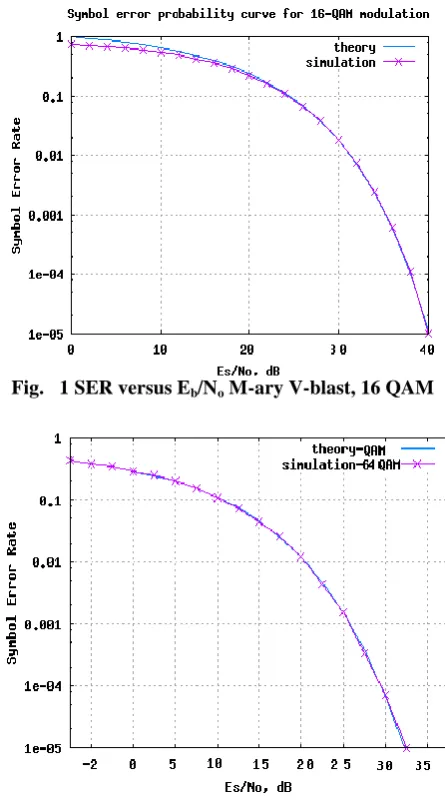
V-BLAST algorithm is used in three different architectures: 2x4, 4x8 and 8x12,in our MATLAB simulation. Plots of symbol error rate versus Eb/No for the 3 different simulated architectures presented Fig.4 depicts the --- Two-by-Four antenna system , the influence of the V-BLAST system at low signal – to – noise ratios becomes more pronounced as the number of receive antennas is increased, hence the low – SNR results. For high SNR is excess of 17 dB however this improvement in receiver performance for V-BLAST is significantly better Four – by – Eight antenna system, the influence of the V-BLAST system at low signal – to – noise ratios becomes more prominent as the number of receive antennas is increased, hence the low – SNR results. For high SNR in excess of 17 dB however this improvement in receiver performance for V-BLAST is significantly better than that for two – by – four. In doubling the number of receive antennas from two to four and four to Eight, the benefit of receive diversity in enhanced, thereby improving the performance of both the 2x4 and 4x8 systems.
number of receive antennas is increased, hence the low – SNR results displayed in fig.5 for high SNR in excess of 17dB however this improvement in receiver performance for V-BLAST is significantly better than that of Eight – by - Twelve
In increasing the number of receiver antennas from two – to – four, four – to – eight and eight to twelve, the benefit of receive diversity is enhanced, thereby improving the performance of both the 2x4, 4x8 and 8x12 systems. However, the important point to note here is the fact that, for low SNR, the improvement in receiver performance for eight – by – twelve is significantly better than that for two – by – four and four – by – eight system.
Fig. 1 SER versus Eb/No M-ary V-blast, 16 QAM
Fig.3 Performance BER versus SNR (dB) M transmitters and N receivers V-BLAST
Fig.4 BER versus Eb/No (dB) for M = 8transmitters and N=12 receivers V-BLAST.
V.CONCLUSION
In MIMO systems antenna correlation plays a very important role. An estimate is performed for correlation coefficient with uniform correlation matrix model. For high values of coefficient in exponential correlation matrix model than proposed model channel correlation is proportional to 3db loss in S/N ratio. The high channel capacity in exponential model substantiated with zero correlation with MIMO channel capacity correlates between number of sub channels.
rate versus Eb/No for the 3 different simulated architectures presented. In increasing the number of receive antennas from two to four, four to eight and eight to Twelve, the benefit of receive diversity is enhanced. There by improving the performance of both the 2x4, 4x8 and 8x12 systems. for low SNR, the improvement in receiver performance for eight – by – twelve is significantly better than that for two – by – four and four- by- eight system the important point to note here.
REFERENCES
[1] M.Alard and R.Lassalle, “principles of modulation and channel coding for digital broadcasting for mobile receivers,” EBU Technical Review, no.224, PP.3-25, August 1987.
[2] D.N.Kalofnos, M.Stojanovic, and J.G.Proakis, “on the performance of adaptive MMSE detectors for a MC-CDMA system in fast fading Rayleigh channels,” in proc. Personal,Indoor, and mobile Radio conf. (PIMRC), Boston, MA 1998. PP.1309-1313
[3] J.P.M.G. Linnartz, “performance analysis of synchronous MC-CDMA in mobile Rayleigh channel with both delay and Doppler spreads”, IEEE Transactions on vehicular technology,vol.50, no.6 November 2001.
[4] K.Murali Krishna, K.Raja Rajeswari, S.V.S.Ganesh, “channel capacity for OFDM and synchronous MC-CDMA “International conference on Bio-medical Electronics and Telecommunications PP.295-298, Visakhapatnam, INDIA, 9-10 Dec 2004.
[5] T.Marzetta and B.Hochwald, “Capacity of a mobile multiple – antenna communication link in Rayleigh at fading, “IEEE Transactions Information Technologies., Vol.45, No.1,PP.139-157, Jan 1999.
[6] B.Hochwald and T.Marzetta, “Unitary space – time modulation for multiple – antenna communications in Rayleigh at fading”, IEEE Trans. Inform. Theory, Vol.46, No.2 PP.543-564, Mar 2000.
[7] L.Zheng and D.Tse, “Communication on the Grassmann manifold: A geometric approach to the non coherent multiple antenna channel, “IEEE Trans. Info. Theory, Vol.48, No.2,PP.359-383 Feb, 2002.
[8] A.Lapidoth and S.Moser, “On the fading number of multi-antenna systems over at fading channels with memory and incomplete side information”, in proc. IEEE Int. symp. Inform.Theory, Lausenne, Switzerland. June – July 2002, PP.478
[9] M.Pettersen, P.H.Lehne, J.Noll, O.Rostbakken, E.Antonsen, R.Eckhoff, “characterization of the Directional wideband Radio channel in Urban and sub urban Areas”, IEEE proc.
Vehicular Technology conference VTC 99 Fall, PP.1454-1459, Amsterdam, The Netherlands, Sep. 1999. [10] Mattias wemmstrom, “promises of wireless MIMO systems,” http://
www.signal.uu.se/courses/seminarviewgraphs/mw01117.ppt
[11] K.Murali Krishna, K.Raja Rajeswari, G.N.Swamy, “MIMO channel capacity Measurement of uniform and exponential correlation matrix models,” International journal of systematics, Cybernetics and Informatics (IJSCI) Issue 1, Vol.1 PP.21-24, India, January 2006.
BIOGRAPHY