Cleveland State University
Cleveland State University
EngagedScholarship@CSU
EngagedScholarship@CSU
Business Faculty Publications
Monte Ahuja College of Business
6-1-2018
The impact of client information technology capability on audit
The impact of client information technology capability on audit
pricing
pricing
Benjamin Hoffman
Cleveland State University, [email protected]
R. Drew Sellers
Justyna Skomra
Follow this and additional works at:
https://engagedscholarship.csuohio.edu/bus_facpub
Part of the
Accounting Commons
How does access to this work benefit you? Let us know!
How does access to this work benefit you? Let us know!
Publisher's Statement
This is the author’s version of a work that was accepted for publication in International Journal
of Accounting Information Systems. Changes resulting from the publishing process, such as
peer review, editing, corrections, structural formatting, and other quality control mechanisms
may not be reflected in this document. Changes may have been made to this work since it was
submitted for publication. A definitive version was subsequently published in International
Journal of Accounting Information Systems, 29, (2018), 10.1016/j.accinf.2018.03.002.
Recommended Citation
Recommended Citation
Hoffman, Benjamin; Sellers, R. Drew; and Skomra, Justyna, "The impact of client information technology
capability on audit pricing" (2018). Business Faculty Publications. 305.
https://engagedscholarship.csuohio.edu/bus_facpub/305
This Article is brought to you for free and open access by the Monte Ahuja College of Business at
EngagedScholarship@CSU. It has been accepted for inclusion in Business Faculty Publications by an authorized administrator of EngagedScholarship@CSU. For more information, please contact [email protected].
The impact
of
client
information
technology
capability
on
audit
pricing
*
Benjamin W. Ho
ff
man
a,*
, R. Drew Sellers
1 *3, Justyna Skomra
bARTICLE INFO Keywords: Audit pricing IT capability Audit fees ABSTRACT
This paper explores the question: “How does a client's information technology (IT) capability influence audit pricing?” Company data for the years 2004 through 2012 are employed. Firms appearing on the InformationWeek 500 (IW500) annual list of U.S. organizations with superior IT functions serve as a proxy for companies with superior IT capability. Our findings suggest that companies with superior IT capabilities incur higher levels of audit fees. In addition, as client size increases, the audit fees of firms with advanced IT capabilities increase at a greater rate than
firms without such capabilities. These findings contrast with prior research by Chen et al. (2014) that found in the immediate post-Sarbanes-Oxley Act (SOX) period for the years 2004 through 2007, client IT capability reduced audit fee increases. In addition, we replicate the Chen et al. (2014) results and find that IT capability did not influence audit fee increases during the sub sequent recession and recovery periods. Further, superior capability clients see smaller audit fee increases when exogenous shocks such as SOX regulations occur. These results suggest a revised interpretation of Chen et al. (2014) may be warranted. This study contributes to the literature by providing a more complete picture of how a client's IT capability affects audit fees.
1. Introduction
Accounting and information technology (IT) have become inexorably intertwined. Clients and auditors alike seek to leverage “big data” and advanced analytics throughout their operations (PWC, 2015). Accounting information systems are embedded within complex enterprise resource planning (ERP) software. Also, the Securities and Exchange Commission (SEC) requires listed companies to file their financial statements via eXtensible Business Reporting Language (XBRL) (U.S. SEC, 2017). Big 4 audit firms are re sponding by expanding their IT auditing and consulting practices (Hermanson, 2009).
These changes create technological complexities and risk while simultaneously enabling enhanced analytics and controls. As a construct, IT capability reflects a company's capacity to marshal investments in people, processes and technologies in order to improve business performance (Dehning et al., 2003). Companies with advanced IT capabilities select the investments that best support their strategy from a myriad of potential IT expenditures. Having selected these IT priorities, they can successfully execute related projects and deploy new technologies within their organizations. There is, therefore, reason to believe that increased IT capability may allow for either a more cost-effective audit - stronger controls and internal information systems that support the auditor - or a more expensive audit -increased difficulties involved with auditing more advanced and complex IT systems.
Prior research has studied the effect of IT capability on the external audit. This work focused exclusively on the immediate post- Sarbanes-Oxley Act of 2002 (SOX) period. Masli et al. (2010) suggest that specific IT investments in internal control-monitoring technology reduce the rate of audit fee increase. Also, during the immediate post-SOX period, for the years 2004 through 2007, companies with strong IT capabilities had slightly lower (9.1%) rates of audit fee increase than those without strong IT resources (Chen et al., 2014). We argue, however, that these findings may not extend beyond the immediate post-SOX era when public audit failures (for example, Enron Corporation, WorldCom, Tyco International, Adelphia Communications Corporation) generated severe market and regulatory responses, leading companies to deploy IT resources specifically targeted to addressing audit and internal control risks. Additionally, we are unaware of any research that explores how the client's IT capability impacts the actual level of audit fees incurred. This paper addresses the gap in prior research by exploring the broader question: How does a client's IT capability impact audit pricing?
The COBIT 5 (Control Objectives for Information and Related Technology) framework recommends that firms align, plan and organize IT investments in support of their chosen business strategy (ISACA, 2017). Firms may gain sustainable advantage by uti lizing IT to develop business capabilities that are difficult for competitors to imitate or acquire (Mata et al., 1995). In particular, firms generate value by aligning their internal capabilities with their IT strategy, creating synergistic resources to respond to market, industry and supply chain forces (Nevo and Wade, 2010; Melville et al., 2004). For example, Mithas et al. (2012) find that “... firms have had greater success in achieving higher profitability through IT-enabled revenue growth than through IT-enabled cost reduction (pg. 205).” Absent the exogenous effect of SOX, whether firms with advanced IT capabilities choose to emphasize enhancing internal controls and audit efficiency among their many competing IT priorities remains an empirical question. In other words, when deciding where to invest in and implement IT resources, internal control is just one of the many options upon which a company can focus their efforts.
Even if strong IT capability has positive effects on a firm's value-generating capabilities and its internal controls, this does not automatically translate into increased audit affordability. For example, auditors may need to use more specialized and expensive resources with clients that routinely deploy new and advanced technology. Auditors also have more difficulty assessing risk in complex accounting systems (Abernathy et al., 2013).
Building upon prior work modeling factors influencing audit pricing (for example, Francis and Wang, 2005; Raghunandan and Rama, 2006; Hogan and Wilkins, 2008; Masli et al., 2010; Chen et al., 2014), we analyze data on audit fees in relation to the company's IT capability. The data employed by this study comprises the population of SEC-registered U.S. companies audited for the years 2004 through 2012 with audit fees data compiled by Audit Analytics. Following prior research, SEC-registered companies cited in the annual InformationWeek 500 report (IW500) identifying U.S. companies with superior IT capabilities, are utilized as a proxy for
firms with superior IT capabilities. These firms are compared to a propensity score matched sample of control firms. We find that superior client IT capability is associated with higher levels of audit fees, ceteris paribus.
Additional analysis suggests a reinterpretation may be warranted of the findings of Chen et al. (2014). Consistent with their study, we found that clients with advanced IT capabilities had a smaller increase in audit fees post-SOX for the time period 2004 through 2007. The recession (years 2008 through 2009) and recovery (years 2010 through 2012) periods, however, reveal no statistically significant difference in audit fee changes when comparing clients with or without advanced IT capabilities. Additionally, we find that, while companies with advanced IT capabilities incurred higher levels of audit fees during the post-SOX period examined by
Chen et al. (2014), they experienced smaller audit fee increases. These higher levels of audit fees remain consistent during the recession and recovery periods as well.
Finally, exploring various interaction effects between advanced IT capability and major audit fee determinants (Hay et al., 2006;
Simunic, 1980), we find that superior IT capability positively moderates the impact of client size on audit fees. Specifically, as firm size in terms of total assets increases, the audit fees of firms with advanced IT capabilities increase at a greater rate than the audit fees of firms without advanced IT capabilities. At the same time, we find no evidence that IT capability moderates the impact of client complexity or risk on audit fees.
This paper contributes to the accounting literature in two areas: First, while a stream of research examining the use of IT by auditors in their work exists (for example, Fischer, 1996; Behn et al., 2006; Janvrin et al., 2008; Dowling, 2009; Chang et al., 2011;
Alles, 2015; Cao et al., 2015; Axelsen et al., 2017), there is little scholarly work that examines the impact of a client's IT capability on audit pricing. Given the prevalence of IT as a foundation of most modern accounting information systems (AIS), understanding the role of the client's IT capability on the cost of external assurance is highly relevant. Prior studies (Masli et al., 2010; Chen et al., 2014) focus on year-to-year audit fee increases, while we focus on audit fee magnitude in a given year. We also extend the Chen et al. (2014)
results beyond the immediate post-SOX period and observe that their finding of smaller audit fee increases for advanced IT-capability companies does not persist beyond 2007. This suggests that clients with strong IT capabilities adapted more quickly to SOX com pliance, exhibited by these smaller audit fee increases. This also may imply that these companies adapt better to exogenous events such as new regulations.
This paper's second area of contribution to the accounting literature concerns the impact of IT on the audit profession. The link between client IT capability and audit cost suggests that audit firms can extract higher fees from firms with greater IT complexity, and that firm size amplifies this effect. Given the continuing investment in advanced IT by most major companies, this particular finding raises cost concerns for both clients and auditors. This finding should be of interest to practitioners as they increase the use of IT auditors during financial statement audits (Axelsen et al., 2017). This finding should also be of interest to client managers as they seek to understand the relationship between IT complexity and audit fees.
The remainder of the paper is organized as follows: The second section presents the literature review, which leads to the paper's hypotheses. The third section summarizes the sample used and methodology employed. The fourth section presents the results of our
analysis. The fifth section discusses the study's findings and implications and limitations; suggestions for further inquiry are also included in this final section.
2. Theoretical background and hypothesis development
2.1. Theoretical framework 2.1.1. IT capability
The IT capability construct draws its theoretical foundation from strategic management's resource-based view (RBV) of the firm (Barney, 1991; Mata et al., 1995). RBV conceptualizes the firm as sets of resources and suggests that the nature of these resources and how firms choose to deploy them drives firm performance. Investments in technology, combined with IT management skills and knowledge, yields IT capabilities (Kohli and Grover, 2008; Ravichandran and Lertwongsatien, 2005). The results of empirical re search on IT's performance impact vary depending on performance measures chosen and the time period examined (Bharadwaj, 2000; Santhanam and Hartono, 2003; Chae et al., 2014). Part of the measurement challenge is that IT capability drives direct and indirect impacts of IT investments on firm performance (Masli et al., 2011).
As a construct, IT capability reflects a firm's ability to conceive, create and operate IT in support of business strategies and objectives. Scholars have suggested that IT capability impacts a firm at different levels. The most basic level is to collect and provide information to managers, while progressively more advanced approaches automate existing operations. At the most strategic level, IT transforms the business (Dehning et al., 2003). IT capability is likely to influence financial reporting and the financial statement audit (Axelsen et al., 2017) and require the use of IT auditors, who generally receive higher compensation (Half, 2015).
2.1.2. IT capability and the financial statement audit
Client size is the primary driver of the audit effort and the associated cost (Hay et al., 2006; Simunic, 1980). Large companies were the first to employ IT primarily to reduce the costs of labor-intensive recordkeeping (Accenture, 2005). For many years, auditors were nonplussed by their clients' IT innovations and chose to “audit around” the system. As IT matured, its applications expanded beyond simple bookkeeping. Eventually, businesses of all sizes began to incorporate IT throughout their operations. Gradually a client's IT came within the scope of the audit. Statement on Auditing Standards (SAS) No. 48, The Effects of Computer Processing on the Audit of Financial Statements, was the first auditing standard to address IT's impact on the financial statement audit (AICPA, 1984).
As a company's use of technology advances, the relationship between client IT capability and the financial statement audit becomes more direct. Singleton (2010) notes that “...guidance (SAS No. 94) suggests the effect of IT is not necessarily related to the size of the entity but rather the level of sophistication of its IT (pg. 1).”An advanced client IT environment provides both advantages and disadvantages for the audit team. A strong client IT environment may support advanced data analytics, continuous auditing capabilities and other systems that can assist auditors in their work (Deloitte, 2015; PWC, 2015). Additionally, to the extent that the client's IT capability lowers the risk of IT-related material weaknesses, audit costs may be reduced (Canada et al., 2009).
Conversely, advanced IT environments, characterized by multiple operating systems, complex networks and disparate applica tions, create variability in audit planning and may result in less structured audit processes (Stoel et al., 2012). Changes to a firm's enterprise systems environment can significantly alter internal controls and audit procedures (Kanellou and Spathis, 2011). Ad ditionally, those system changes can potentially increase the level of audit effort and the need for auditors with specialized IT expertise.
As a company's IT sophistication increases, the need for specialized audit resources grows. Curtis et al. (2009) note that “Factors that suggest the need for [IT] specialists include: system complexity and usage, system changes or implementations, the extent of data sharing, the extent of the client's involvement in e-commerce, the client's use of emerging technologies, and the extent to which audit evidence is only available in electronic form (pg. 85).”Clients with advanced IT capabilities possess many of these attributes and, thus, require expanded IT auditor involvement. Further, research suggests that financial statement auditors possessing IT expertise tend to assess higher IT control risks than auditors lacking this experience (Brazel and Agoglia, 2007). Finally, specialized IT auditors command a 22% or higher audit fee premium compared to financial statement auditors (Half, 2015). Thus, while clients with advanced IT capabilities might achieve greater audit efficiency for routine analysis and testing, the client's use of advanced tech nology may incur additional effort and risk and, in turn, require more resources, such as specialized and highly compensated staff, from their auditors.
2.1.3. IT capability and audit pricing
Auditors plan their attest engagements to provide interested stakeholders with reasonable assurance of the veracity of the client's
financial statements. There appears to be a desirable range for audit fees: excessively high fees may lead clients to switch to a certified public accountant (CPA) firm that offers a better fit (Shu, 2000). Clients, however, are not exclusively focused on minimizing audit cost. For instance, positive corporate governance factors such as Board of Director expertise, independence and effort may lead to the board's desire for a more thorough audit. Therefore, these factors may lead to increased audit fees (Carcello et al., 2002; Abbott et al., 2003).
Prior research suggests that a company's IT capability impacted audit fee changes during the post-SOX period (Masli et al., 2010;
Chen et al., 2014). Chen et al. (2014) reported that while there was a general increase in audit fees, for the time period 2004 through 2007, the rate of audit fee increases was less (9.1%) for companies with strong IT capabilities than for companies without strong IT capabilities. This research did not address this effect's persistence beyond the post-SOX period, nor did it explore the question of how
a client's IT capability is associated with audit fee levels in a given year. In summary, prior research has explored the impact of client IT capability on post-SOX year-to-year audit efficiency measured by changes in audit fees, but not on the broader issue of the relationship between client IT capability and audit fee magnitude. Thus, we hypothesize about the relationship between IT capability and the audit fee level in a given year, and explore how this relationship persists throughout the timeframe of our study.
2.2. Hypothesis development 2.2.1. IT capability and audit fees
As discussed above, companies and their stakeholders desire a timely and cost-effective audit. Typical audit fees have more than doubled post-SOX (Raghunandan and Rama, 2006). Prior research suggests that IT is a fundamental element of an effective internal control environment, necessary for managing financial reporting (Klamm et al., 2012). Audit firms also rely on technology when performing their audits. These firms leverage IT to: automate their documentation (Janvrin et al. 2008), make their processes more consistent (Dowling and Leech, 2014) and understand client systems and business processes (Janvrin et al., 2009). Thus, one would expect that companies with advanced IT capabilities would leverage IT to implement strong internal controls. This would cause the auditor to assess control risk at a lower level and rely more on the client's internal controls to make the audit more efficient and less costly (Janvrin et al. 2009).
Furthermore, some managers may view their companies' transaction processing and financial reporting capabilities as a strategic asset; they may invest a portion of their IT development efforts with the goal of making these core business processes more effective and efficient. In turn, that investment may make the financial statement audit less costly (Christ et al., 2015). Specifically, superior IT capability may reduce costs by making data more readily available and lowering risk through automation of internal controls (Janvrin et al. 2009; Masli et al., 2010). It also may mute the increases in audit fees from one year to the next (Chen et al., 2014).
Conversely, firms with advanced IT capabilities may require increased audit efforts, driven by the expanded scope and complexity of the technology environment. For example, Chen (2001) discusses the challenges experienced in the initial wave of enterprise resource planning (ERP) implementations. These challenges included selecting appropriate software, matching business requirements with IT capabilities, and successfully changing the organizational structure and employee behavior to effectively utilize the system. These issues likely would add the complexity of the audit, increasing audit effort. Axelsen et al. (2017) state that financial statement auditors struggle with clearly understanding the role of the information systems auditors and how best to use them during the
financial statement audit. Challenges such as these are likely to lead to a more complex auditing environment for the external auditor, which is likely to lead to higher audit fees.
Relevant audit risks are not limited to a client's internal IT environment. Managers may choose to outsource a portion of their IT operations to obtain access to specialized expertise and reduce costs. In making this choice, firms may lose the ability to adequately monitor those outsourced IT functions. Thus, to the extent that those functions are integral to the financial reporting process, firms may incur additional risk (Christ et al., 2015).
Regardless of the mix of insourced and outsourced resources, the capability to deploy pervasive and innovative technologies may increase business performance, but not necessarily reduce or eliminate risks to the company. Arguably the reduction of these types of business risks requires a management focus more on internal controls than on advanced IT capability. Absent a strong internal control focus, expanding technology portfolios may increase audit effort and costs.
As previously noted, auditors with IT expertise are significantly more expensive than their traditional auditor counterparts with
financial statement expertise (Axelsen et al., 2017). Whether there are resulting audit efficiency gains that offset these additional costs is unclear.
Thus, conflicting arguments exist regarding the impact of client IT capability on audit pricing. Advanced IT capability may support enhanced operations, analytics and internal controls, all of which reduce audit fees. Conversely, advanced IT capability may increase operational complexity and risk with an associated increase in audit fees. Additionally, complex client IT environments require the use of specialized IT auditor resources that are costlier. This leads to our hypothesis, stated in the null form:
H1:. There will be no significant association between audit client IT capability and the level of the client's audit fees.
3. Data and methods
3.1. IT capability proxy: InformationWeek 500
The InformationWeek 500 (IW500) is an annual list that identifies U.S. companies with superior IT functions. Membership on this list has been used as a proxy measure for superior IT capability by numerous prior studies (Bharadwaj, 2000; Santhanam and Hartono, 2003; Bhatt and Grover, 2005; Wang and Alam, 2007; Muhanna and Stoel, 2010; Chen, Lim and Stratopoulos, 2011; Chen et al., 2014; Chae et al., 2014). To be considered for this list, companies must have annual revenue of at least $250 million (InformationWeek, 2011). In making their selections, the editors look for a “demonstrated pattern of technological, procedural and organizational innovation” (InformationWeek, 2011).
3.2. Sample selection
the post-SOX, financial recession, and recovery periods.1 Beginning the sample with the year 2004, permits the inclusion of SOX- related reporting of internal control weaknesses.2
1 The majority of the SOX requirements were effective by the end of 2003 (see https://www.sec.gov/about/laws/soa2002.pdf). The financial recession spanned December 2007 through June 2009 (see http://www.nber.org/cycles.html).
2 Our sample ends in 2012, due to changes made by Information Week regarding the methodology used to determine the IW500.
3 We start data collection in the year 2000 in order to have five years of data prior to the study's timeframe, 2004 through 2012. This earlier data is needed to compute IW500Repeat, a variable used in a subsequent additional analysis.
4 This method is appropriate in our setting given the strong correlation between audit fees and IT capability. Using this approach controls for bias in our coefficients if the unmodeled effects of audit fees are related to IT capability.
5 This matching process was performed with no replacement of the control firm-year observations.
6 We also matched on 3-digit and 4-digit Standard Industrial Classification (SIC) codes; our results were qualitatively similar to our main results. See the breakdown of our IW500 and population-based control sample firm-year observations by industry in Appendix B.
Data are drawn from the databases of Audit Analytics and Compustat. Consistent with prior work, we removed financial services
firms (Standard Industrial Classification (SIC) code 6000-6999) from the sample (Francis and Wang, 2005); we also removed companies with less than $250 million in annual revenue, based upon the IW500 requirement stated earlier. We eliminated those companies lacking the needed information for our variables. Companies, cited in the annual InformationWeek 500 report for the years 2000 through 2012, were identified and coded as having superior IT capability.3 Finally, we matched the IW500 data with the corresponding years 2004 through 2012 timeframe of audit and financial data.
This results in a sample of 2025 firm-year observations with audit fee data for firms with superior IT capability (IW500) and 14,921 firm-year observations in the population-based control sample. Our final sample was constructed via propensity score matching to alleviate any concerns with structural issues in the data including the possibility of nonlinear relations among variables that could compromise the validity of our results (Shipman et al., 2017).4 The propensity score was calculated based on the predicted probabilities of selection as an IW500 firm, using the probit model in the Eq. (0) below. The variables in our model are derived from prior literature related to the determinants of IT capability and innovation that drive the inclusion of a firm on the IW500 list (Kobelsky et al., 2008; Masli et al., 2010; Chen et al., 2014).
(0) As a result, we employed a matched-pair sample of 4050 firm-year observations for our primary analysis.5 For the additional analyses and robustness checks, we employed a population-based control sample of 14,921 firm-year observations and had 2025 IW500 firm-year observations. These control firms are limited to the industries in the sample of IW500 firms (based on the firms' three-digit SIC codes).6
3.3. Research design
Our multivariate analysis uses superior IT capability (IW500) as its variable of interest and includes controls for various client and auditor factors from prior audit fee models (Francis and Wang, 2005; Raghunandan and Rama, 2006; Masli et al., 2010). Consistent with prior work, we included industry (two-digit SIC) and year-fixed effects; our continuous data is winsorized at 1 and 99% to mitigate the influence of outliers, and we centered continuous variables (Robinson and Schumacker, 2009). Following Chen et al. (2014), we report robust standard errors clustered by firm (Petersen, 2009). We use the following OLS (Ordinary Least Squares) regression model to test H1:
(1) The dependent variable Audit Feest = the log of audit fees for year t. Our independent variable of interest is IW500 = 1, for a firm included in the InformationWeek 500 report; 0 is otherwise used. The remaining variables control for firm size, complexity, risk,
financial performance and auditor size. See Appendix A for a description of the control variables.
Extant models of audit pricing generally follow Simunic (1980) and employ measures of client risk, client complexity and client size as the three primary determinants of audit fees. In their meta-analysis of audit fee research, spanning the years 1977 through 2003, Hay et al. (2006) report that client size, as measured by total assets, client risk, as measured by Rec_Inventory or Leverage, and client complexity, as measured by Segments, are the primary determinants of audit fees. Therefore, we interact our variable of interest, IW500, with these well-established proxies as an additional analysis. See Eq. (2) below.
(2) Our control variables remain consistent with Eq. (1).
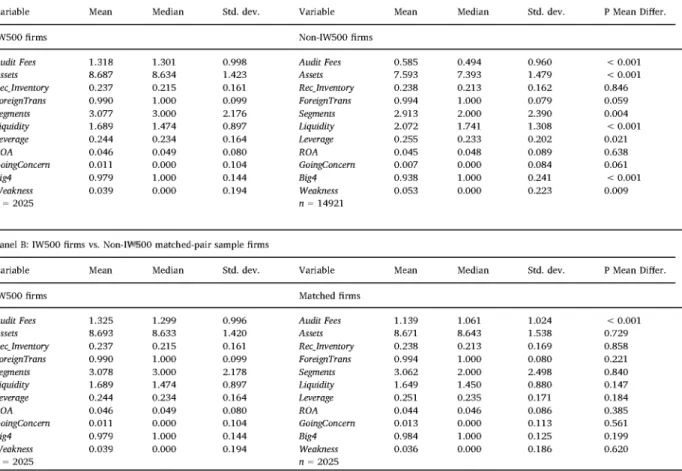
Table 1
Descriptive statistics.
Panel A: IW500 firms vs. Non-IW500 firms — population-based control sample
Variable Mean Median Std. dev. Variable Mean Median Std. dev. P Mean Differ.
IW500 firms Non-IW500 firms
Audit Fees 1.318 1.301 0.998 Audit Fees 0.585 0.494 0.960 < 0.001
Assets 8.687 8.634 1.423 Assets 7.593 7.393 1.479 < 0.001 Rec_Inventory 0.237 0.215 0.161 Rec_Inventory 0.238 0.213 0.162 0.846 ForeignTrans 0.990 1.000 0.099 ForeignTrans 0.994 1.000 0.079 0.059 Segments 3.077 3.000 2.176 Segments 2.913 2.000 2.390 0.004 Liquidity 1.689 1.474 0.897 Liquidity 2.072 1.741 1.308 < 0.001 Leverage 0.244 0.234 0.164 Leverage 0.255 0.233 0.202 0.021 ROA 0.046 0.049 0.080 ROA 0.045 0.048 0.089 0.638 GoingConcern 0.011 0.000 0.104 GoingConcern 0.007 0.000 0.084 0.061 Big4 0.979 1.000 0.144 Big4 0.938 1.000 0.241 < 0.001 Weakness 0.039 0.000 0.194 Weakness 0.053 0.000 0.223 0.009 n = 2025
Panel B: IW500 firms Variable IW500 firms Audit Fees Assets Rec_Inventory ForeignTrans Segments Liquidity Leverage ROA GoingConcern Big4 Weakness n = 2025 vs. Non-IW Mean 1.325 8.693 0.237 0.990 3.078 1.689 0.244 0.046 0.011 0.979 0.039 500 matched Median 1.299 8.633 0.215 1.000 3.000 1.474 0.234 0.049 0.000 1.000 0.000
-pair sample firms Std. dev. 0.996 1.420 0.161 0.099 2.178 0.897 0.164 0.080 0.104 0.144 0.194 n = 14921 Variable Matched firms Audit Fees Assets Rec_Inventory ForeignTrans Segments Liquidity Leverage ROA GoingConcern Big4 Weakness n = 2025 Mean 1.139 8.671 0.238 0.994 3.062 1.649 0.251 0.044 0.013 0.984 0.036 Median 1.061 8.643 0.213 1.000 2.000 1.450 0.235 0.046 0.000 1.000 0.000 Std. dev. 1.024 1.538 0.169 0.080 2.498 0.880 0.171 0.086 0.113 0.125 0.186 P Mean Differ. < 0.001 0.729 0.858 0.221 0.840 0.147 0.184 0.385 0.561 0.199 0.620
All variables are defined in the appendix. All continuous variables are winsorized at 1 and 99% to mitigate the influence of outliers. P Mean Differ. is the p-value of the difference in means between the IW500 firms and the Non-IW500 firms.
4. Results
4.1. Univariate analysis
Table 1 reports descriptive information about the variables used in our analysis. Panel A compares IW500 firms with the po pulation-based control sample of non-IW500 firms. The following differences are significant (p < 0.05). The IW500 firms have higher audit fees, shown in millions, with a mean (median) of 1.32 (1.30) contrasted with 0.58 (0.49) for the control sample. Companies in the IW500 are generally larger, with a mean size (Assets) of 8.69 versus 7.59 for the control sample. The IW500 companies are also more complex, with a mean number of geographic segments of 3.08 versus 2.91 for the control sample. Also, the IW500 companies are less leveraged (with a mean value of 0.24 versus 0.25 for the control sample) and less liquid (with a mean value of 1.69 versus 2.07 for the control sample). The companies in the IW500 utilize Big 4 firms for their audits at a higher rate than the rest of the sample, 98% compared to 94%, and these same companies report fewer material control weaknesses, 4% versus 5%. We do not find any statistically significant differences between the IW500 and non-IW500 firms in combined levels of receivables and inventory, which was one of our two proxies for risk. Finally, the IW500 firms produce a similar Return on Assets (mean ROA of approximately 5%).
Panel B compares the IW500 firms with the matched-pair control group and reveals a well-matched sample, given that none of the control variables are significantly different across the two groups. The only significant difference between the two groups is audit fees (1.32 versus 1.14). This univariate result is an initial indication that audit fees are higher for IW500 firms versus non-IW500 firms.
The matched-pairs sample correlation coefficients for the variables used in our main results are reported in Table 2. Reviewing the correlation among the variables, we find a significant and positive correlation between IW500 and Audit Fees, suggesting audit fees are higher for clients with superior IT capabilities. This provides initial support for H1. The correlations between IW500 and the remaining independent variables suggest that larger, riskier, more complex companies tend to have superior IT capabilities. These IW500 firms are also more likely to have a material weakness, more likely to use a Big 4 auditor and less likely to be issued a going concern opinion. Furthermore, audit fees tend to be higher for larger, more complex, less liquid and more leveraged companies. Fees
Table 2
Correlation matrix.
IW500 Audit Fees Assets Rec_Inventory ForeignTrans Segments Liquidity Leverage ROA GoingConcem Big4 Weakness
IW500 1.000 0.088 0.758 0.044 -0.122 0.328 -0.004 0.013 0.004 -0.193 0.107 0.061 (< 0.001) (< 0.001) (0.006) (< 0.001) (< 0.001) (0.801) (0.403) (0.783) (< 0.001) (< 0.001) (< 0.001) Audit Fees 0.093 1.000 0.005 -0.021 -0.003 0.003 -0.019 0.014 -0.009 0.023 -0.020 0.008 (< 0.001) (0.729) (0.184) (0.858) (0.841) (0.221) (0.385) (0.562) (0.147) (0.200) (0.620) Assets 0.747 0.004 1.000 0.137 -0.390 0.158 -0.009 0.097 -0.023 -0.312 0.135 -0.085 (< 0.001) (0.821) (< 0.001) (< 0.001) (< 0.001) (0.567) (< 0.001) (0.140) (< 0.001) (< 0.001) (< 0.001) Rec_inventory 0.064 -0.017 0.165 1.000 -0.269 -0.102 -0.005 -0.297 0.063 -0.321 0.056 0.009 (< 0.001) (0.284) (< 0.001) (< 0.001) (< 0.001) (0.740) (< 0.001) (< 0.001) (< 0.001) (< 0.001) (0.574) ForeignTrans -0.075 0.010 -0.379 -0.290 1.000 0.064 0.024 0.006 -0.006 0.273 -0.070 0.078 (< 0.001) (0.531) (< 0.001) (< 0.001) (< 0.001) (0.125) (0.692) (0.721) (< 0.001) (< 0.001) (< 0.001) Segments 0.355 0.048 0.111 -0.148 0.203 1.000 0.000 0.037 0.027 0.161 0.041 0.004 (< 0.001) (0.002) (< 0.001) (< 0.001) (< 0.001) (0.983) (0.019) (0.086) (< 0.001) (0.009) (0.792) Liquidity -0.003 -0.019 -0.006 -0.006 0.029 -0.003 1.000 0.010 -0.015 0.023 -0.012 -0.011 (0.846) (0.221) (0.717) (0.680) (0.063) (0.865) (0.510) (0.326) (0.136) (0.428) (0.484) Leverage 0.024 0.016 0.059 -0.368 0.107 0.124 0.033 1.000 -0.278 0.131 0.030 -0.132 (0.128) (0.303) (< 0.001) (< 0.001) (< 0.001) (< 0.001) (0.036) (< 0.001) (< 0.001) (0.059) (< 0.001) ROA 0.006 -0.009 -0.023 0.049 -0.004 0.031 -0.015 -0.157 1.000 -0.049 0.015 0.098 (0.686) (0.562) (0.143) (0.002) (0.809) (0.052) (0.326) (< 0.001) (0.002) (0.339) (< 0.001) GoingConcem -0.178 0.027 -0.364 -0.387 0.436 0.248 0.026 0.190 -0.066 1.000 -0.053 -0.007 (< 0.001) (0.089) (< 0.001) (< 0.001) (< 0.001) (< 0.001) (0.102) (< 0.001) (< 0.001) (0.001) (0.675) Big4 0.109 -0.020 0.131 0.060 -0.074 0.030 -0.012 0.040 0.015 -0.064 1.000 0.008 (< 0.001) (0.200) (< 0.001) (< 0.001) (< 0.001) (0.055) (0.428) (0.011) (0.339) (< 0.001) (0.617) Weakness 0.057 0.008 -0.088 0.004 0.074 0.007 -0.011 -0.129 0.098 0.006 0.008 1.000 (< 0.001) (0.620) (< 0.001) (0.784) (< 0.001) (0.676) (0.484) (< 0.001) (< 0.001) (0.700) (0.617)
All variables are defined in the appendix. All continuous variables are winsorized at 1 and 99% to mitigate the influence of outliers. Pearson (Spearman) correlations are presented in the upper right (lower left). p-Values are in parentheses below each correlation coefficient. This matrix is based on the matched-pair sample; there are 4050 observations, consistent with those shown in Table 1, Panel B.
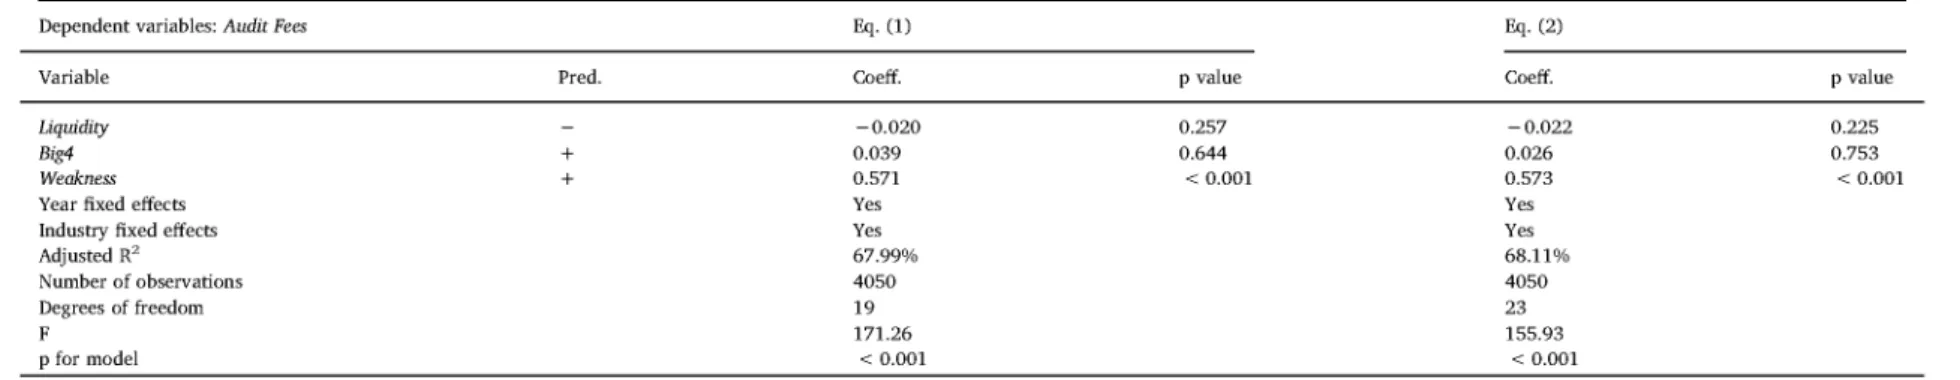
Table 3
The impact of IT capability on audit fees.
Panel A: IW500
Dependent variables: Audit Fees Eq. (1) Eq. (2)
Variable Pred. Coeff. p value Coeff. p value
Intercept -0.320 0.025 -0.293 0.04 IW500 ? 0.183 < 0.001 0.141 < 0.001 Assets + 0.549 < 0.001 0.527 < 0.001 Leverage + -0.155 0.134 -0.084 0.453 Rec_inventory + 0.082 < 0.001 1.032 < 0.001 Segments + 0.011 0.925 0.088 < 0.001 IW500 * Assets ? 0.043 0.038 IW500 * Leverage ? -0.141 0.412 IW500* Rec_Inv ? -0.009 0.492 IW500 * Segments ? -0.016 0.933 ForeignTrans + -0.804 < 0.001 0.011 0.925 ROA — -0.075 0.464 -0.794 < 0.001 GoingConcem + 1.038 < 0.001 -0.079 0.445 Liquidity — -0.022 0.220 -0.023 0.195 Big4 + 0.046 0.571 0.039 0.633 Weakness + 0.575 < 0.001 0.577 < 0.001
Year fixed effects Yes Yes
Industry fixed effects Yes Yes
Adjusted R2 67.68% 67.72% Number of observations 4050 4050 Degrees of freedom 19 23 F 172.98 154.24 p for model < 0.001 < 0.001 Panel B: IW500Repeat
Dependent variables: Audit Fees Eq. (1) Eq. (2)
Variable Pred. Coeff. p value Coeff. p value
Intercept -0.303 0.033 -0.268 0.055 IW500Repeat ? 0.055 < 0.001 0.036 0.001 Assets + 0.538 < 0.001 0.507 < 0.001 Leverage + -0.143 0.165 -0.075 0.477 Rec_Inventory + 0.084 < 0.001 0.943 < 0.001 Segments + 0.003 0.977 0.086 < 0.001 IW500Repeat * Assets ? 0.019 0.004 IW500Repeat * Leverage ? -0.033 0.569 IW500Repeat * Rec_Inv ? 0.000 0.961 IW500Repeat * Segments ? 0.025 0.665 ForeignTrans + -0.787 < 0.001 0.009 0.936 ROA — -0.059 0.555 -0.780 < 0.001 GoingConcem + 0.988 < 0.001 -0.063 0.538
Table 3 (continued)
Panel B: IW500Repeat
Dependent variables: Audit Fees Eq. (1) Eq. (2)
Variable Pred. Coeff. p value Coeff. p value
Liquidity - -0.020 0.257 -0.022 0.225
Big4 + 0.039 0.644 0.026 0.753
Weakness + 0.571 < 0.001 0.573 < 0.001
Year fixed effects Yes Yes
Industry fixed effects Yes Yes
Adjusted R2 67.99% 68.11%
Number of observations 4050 4050
Degrees of freedom 19 23
F 171.26 155.93
p for model < 0.001 < 0.001
are also higher when a company is audited by a Big 4 audit firm and when material weaknesses are present in their internal controls.
4.2. Multivariate analysis
The regression coefficients for Eqs. (1) and (2) appear in Table 3, Panel A; this panel uses the propensity score matched-pair sample, previously described. Evaluating the base model, we find that, consistent with prior research (Francis and Wang, 2005;
Raghunandan and Rama, 2006; Masli et al., 2010), the control variables are generally significant in the predicted direction in for both Eqs. (1) and (2). Total assets, receivables and inventory, number of business segments and SOX 404 material weaknesses have a positive and significant relationship with the level of audit fees; ROA and liquidity have a negative and significant relationship. Contrary to expectations, leverage, foreign transactions, going concern opinion and utilization of Big 4 auditors are not significantly related to the level of audit fees. The variance inflation factor (VIF) values for all equations are all < 10, indicating that multi collinearity does not appear to be an issue (Belsley et al., 1980).
We test our hypothesis in Column 1 of Table 3, Panel A: IW500, the variable of interest, is significant and positive (0.183, p < 0.001). Therefore, we reject the null hypothesis of H1. The results suggest that having superior IT capability is associated with a higher level of audit fees.
To better understand the direct effect of IT capability on audit fees while controlling for interactions with these key audit fee determinants (Aiken and West, 1991), we interact IW500 with proxies for Simunic's (1980) three components of audit pricing: size (Assets), complexity (Segments) and risk (Rec_Inventory and Leverage). As shown in Table 3, Panel A — Column 2, the main effect of IW500 remains significant and positive (0.141, p < 0.001). The interaction of IW500 with size (Assets) is significant and positive (0.043, p = 0.038). We find that IW500 interactions with our risk measures (Leverage and Rec_Inventory) and complexity measure (Segments) are insignificant. The findings suggest that a company's size moderates the influence of IT capability on audit fees.
Taken together, the results in Table 3, Panel A suggest that superior IT capability impacts audit pricing in two ways: 1) the overall direct effect is that audit fees for a client with superior IT capability are approximately 4% higher than audit fees for a control firm; and 2) the interaction analysis (IW500 * Assets) reveals that IT capability has a stronger positive influence on audit fees as the firm size increases.
4.3. Additional analyses 4.3.1. IW500Repeat
Chen et al. (2011) indicate the potential pitfalls of viewing a firm that was recognized once in the InformationWeek 500 as having equivalent IT impact with those firms that have been repeatedly recognized. We therefore construct an alternative proxy for superior IT capability: IW500Repeat. This variable counts the number of times companies have been recognized by the InformationWeek 500 for their superior IT capabilities during the current year and preceding four years. Thus, we replaced IW500 with IW500Repeat as the variable of interest in Eqs. (1) and (2):
Audit Feest = β0 + β1 IW500Repeatt + β2 Assetst + β3 Leveraget + β4 Segmentst + β5 ForeignTranst + β6 ROAt
+ β7 GoingConcernt + β8 RecInventoryt+1 + β9 Liquidity + β10 Big4t + β 11 Weaknesst + ε (3)
Audit Feest = β0 + β1 IW500Repeatt + β2 Assetst + β3 Leveraget + β4 Segments + β5 IW500Repeat* Assetst
+ β6 IW500Repeat* Leveraget + β7 IW500Repeat* RecInventoryt+1 + β8IW500* Segmentst + β9 ForeignTranst
+ β 10 ROAt + β 11 GoingConcernt + β 12 RecInventoryt+1 + β 13 Liquidity + β 14 Big4t + β 15 Weaknesst + ε (4) We, again, centered continuous variables (Robinson and Schumacker, 2009). Following Chen et al. (2014), we report robust standard errors clustered by firm (Petersen, 2009). Also, the VIF values computed for Eqs. (3) and (4) are all < 10, indicating that multicollinearity does not appear to be an issue (Belsley et al., 1980).
We report these results in Table 3, Panel B. These analyses yield similar results to Panel A: in Eq. (3), there is a positive and significant value for IW500Repeat (0.055, p < 0.001); in Eq. (4), there are positive and significant values for IW500Repeat (0.036, p = 0.001) and IW500Repeat * Assets (0.019, p = 0.004). These results also support rejecting the H1 null hypothesis in the same direction as our main results.
4.3.2. Revisiting Chen et al. (2014)
Prior findings from Chen et al. (2014) and Masli et al. (2010) suggest, during the post-SOX period, clients with advanced IT capabilities have smaller rates of audit fee increase when compared with similar clients without strong IT capabilities. Given those outcomes, the findings reported above seem counterintuitive. As stated earlier, these prior studies are examining year-to-year audit efficiency measured by changes in audit fees, while our study measures audit fee levels in a given year. In addition, the Chen et al. (2014) results support two alternative views of the general impact of client IT capability on audit fees. First, clients with strong IT functions may have smaller increases in fees on their audits, ceteris paribus, than similar clients without strong IT capabilities. Alternatively, clients with strong IT functions may be better able to quickly adapt to exogenous events such as new regulations, and thus have smaller post-SOX audit fee increases than similarly situated companies lacking strong IT capabilities. This second line of reasoning is consistent with prior research that found strong IT capability increased a firm's ability to quickly recover from a financial
Table 4
The impact of IT capability on audit fee changes by time period.
Dependent variable: ∆Audit Fees
Panel A
Variable Pred. Post-SOX Recession Recovery
2004-2007 2008-2009 2010-2012
Coeff. p value Coeff. p value Coeff. p value
Intercept 0.757 < 0.001 -0.041 0.404 0.036 0.444 IW500 -0.105 < 0.001 -0.006 0.539 0.012 0.386 ∆Assets + 0.143 0.006 3.590 < 0.001 2.750 < 0.001 ALeverage + -0.001 0.184 0.000 0.599 0.000 0.084 ∆RecJnventory + 0.040 0.529 0.056 0.02 0.074 0.043 ∆Segments + -0.042 0.087 0.002 0.830 -0.011 0.045 ForeignTrans + 0.046 0.058 0.047 0.192 0.023 0.440 ∆ROA 0.093 0.446 0.000 0.078 0.000 0.752 GoingConcem + -0.038 0.525 0.059 0.175 0.608 0.290 ∆Liquidity 0.000 0.241 -0.017 0.516 -0.042 0.013 Big4 + -0.220 < 0.001 -0.051 0.142 -0.027 0.482 Weakness + 4.543 < 0.001 -0.021 0.628 0.189 0.04 Y2005 ? -0.594 < 0.001 0.056 Y2006 ? -0.699 < 0.001 0.032 Y2007 ? -0.699 < 0.001 Y2009 ? 0.019 0.087 Y2011 ? 0.024 Y2012 ? 0.025
Year fixed effects Yes Yes Yes
Industry fixed effects Yes Yes Yes
Adjusted R2 15.72% 12.40% 4.83%
Number of observations 8012 3542 5392
Degrees of freedom 14 12 13
F 113.54 7.53 6.57
p for model
Dependent variable: Audit Fees
Panel B Variable Intercept IW500 Assets < 0.001 Pred. Post-SOX 2004-2007 Coeff. -0.415 0.200 + 0.486 < 0.001 < 0.001 Recession Recovery 2008-2009 2010-2012
p value Coeff. p value Coeff. p value
< 0.001 -0.120 0.615 -0.340 0.002
< 0.001 0.175 < 0.001 0.178 < 0.001
< 0.001 0.486 < 0.001 0.495 < 0.001
Table 4 (continued)
Dependent variable: Audit Fees
Panel B
Variable Pred. Post-SOX Recession Recovery
2004-2007 2008-2009 2010-2012
Coeff. p value Coeff. p value Coeff. p value
Leverage + 0.063 0.375 -0.083 0.221 -0.181 0.006 Rec_Inventory + 0.899 < 0.001 1.025 < 0.001 0.962 < 0.001 Segments + 0.100 < 0.001 0.077 < 0.001 0.058 < 0.001 ForeignTrans + -0.032 0.745 -0.047 0.840 0.067 0.510 ROA -0.961 < 0.001 -0.522 < 0.001 -0.697 < 0.001 GoingConcem + 0.151 0.140 0.062 0.446 0.131 0.420 Liquidity -0.025 0.009 -0.011 0.281 -0.014 0.114 Big4 + 0.189 < 0.001 0.228 < 0.001 0.236 < 0.001 Weakness + 0.556 < 0.001 0.336 < 0.001 0.250 < 0.001 Y2005 ? 0.291 < 0.001 Y2006 ? 0.341 < 0.001 Y2007 ? 0.325 < 0.001 Y2009 ? -0.064 < 0.001 Y2011 ? -0.012 0.1274 Y2012 ? 0.008 0.4064
Year fixed effects Yes Yes Yes
Industry fixed effects Yes Yes Yes
Adjusted R2 63.20% 67.38% 69.23%
Number of observations 8012 3542 5392
Degrees of freedom 14 12 13
F 421.17 347.59 359.14
p for model < 0.001 < 0.001 < 0.001
downturn (Wu et al., 2014; Schäfferling et al., 2012; Chen et al., 2011).
We explore these alternative interpretations with a two-step analysis. Following recent calls for more robust efforts to substantiate prior findings (Stone, 2015; Salterio, 2014), we begin by replicating the main findings of Chen et al. (2014). Specifically, we use the OLS regression Eq. (5) below to test whether clients with advanced IT capabilities will see a lower rate of post-SOX audit fee increases compared to clients without advanced IT capabilities.
ΔAuditFeest = β0 + β 1 IW500t + β2 ΔAssetst + β3 ΔLeveraget + β4 ΔSegmentst + β5 ForeignTranst + β6 ΔROAt
+ β 7 GoingConcernt + β8 Δ RecInventoryt+1 + β 9 Δ Liquidityt + β 10 Big4t + β 11 Weaknesst + controls industry &year
+ ε (5)
The regression analysis results using Eq. (5) appear in Table 4, Panel A. We find that IW500 is negative and significant (-0.105, p < 0.001). Consistent with Chen et al. (2014); during the post-SOX period, companies with superior IT capabilities have smaller increases in audit fees compared to companies lacking strong IT capabilities during the years 2004 through 2007.
As a second step, we examine the persistence of the Chen et al. (2014) findings as the audit profession absorbed the regulatory impact of SOX. This is captured by testing whether differences in the rate of post-SOX audit fee changes between clients with advanced IT capabilities and clients without advanced IT capabilities attenuate as the SOX requirements are addressed and met.
We find insignificant coefficients for IW500 during the recession period (-0.006, p = 0.539) and the recovery period (0.012, p = 0.386); see Table 4, Panel A for details. These results place the Masli et al. (2010) and Chen et al. (2014) findings in a broader context: they suggest that clients with advanced IT capabilities were better able to minimize audit fee increases immediately after SOX was implemented. This difference, however, dissipated after the immediate post-SOX period.
At the same time, post-SOX, during the years 2004 through 2007, audit fees were consistently higher for strong IT capability companies. These results appear in Table 4, Panel B. We find that post-SOX IW500 is positive and significant (0.200, p < 0.001). We
find similar results for IW500 during the recession, covering the years 2008 through 2009, (0.175, p < 0.001) and recovery, cov ering the years 2010 through 2012, (0.178, p < 0.001). This illustrates the idea that, although the influence of client IT capability is associated with smaller year-to-year audit fee growth (Chen et al., 2014), clients with superior IT capability also have significantly higher audit fees in a given year.
4.4. Robustness checks
We employed several alternative analyses (untabulated) to verify the robustness of the results. First, we used two alternative approaches for constructing the matched-pair sample: 1) matching on the four fee determinants (Size, Leverage, Rec_Inventory and Segments) and 2) matching on size and two-digit SIC code. From these alternative methods of constructing the control group, the results were qualitatively similar to those reported in Table 3. We also expanded the construction of the matched-pair sample, permitting duplicate control firm-year observations, and found qualitatively similar results to our primary analysis.
Second, we employed a population-based control sample approach following prior research (Doyle et al., 2007; Masli et al., 2010); the control sample included all of the 14,921 control firm-year observations. This control sample was combined with the 2025 IW500 firm-year observations and analyzed. When compared with the results reported in Table 3, Panel A, these analyses yield similar results: using Eq. (3) there is a positive and significant value for IW500 (0.183, p < 0.001); using Eq. (4) there are positive and significant values for IW500 (0.111, p < 0.001) and IW500 * Assets (0.081, p < 0.001). These results also support rejecting the H1 null hypothesis in the same direction as our main results.
A possible issue with this population-based control approach is that the companies must apply to be included on the IW500 list. Beyond IT prowess, those applying for this recognition may differ from the broader population of companies in systematic ways. To address this concern, in a third robustness check, we employed the Heckman (1979) two-stage regression to calculate an inverse Mills ratio (IMR). This approach controls for self-selection bias.7 We first modeled the determinants of being included on the IW500 list using the following probit model (variables defined in Appendix A):
7 The propensity score matching approach employed in our main analysis deals with functional form misspecification, but does not alleviate bias issues (Shipman et al., 2017). Therefore, this two-stage IMR approach is an appropriate robustness check.
Pr (IW500)t = β0 + β1 AuditFeest + β2 Assetst + β3 ForeignTranst + β4 Segmentst + β5 Liquidityt + β6 Leveraget + β7 Big4t
+ β8 ROAt + β9 Restructuringt + β10 Losst + β11 AuditorChanget + β12 AuditDelayt + ε (6) The variables of Eq. (6) were determined based on prior literature related to IT capability and audit fees (Masli et al., 2010; Chen et al., 2014). The included variables were considered likely to have a significant effect on the probability of a company having superior IT capability. When running this probit regression, variables that have an insignificant coefficient were then appropriately excluded from the second stage regression (Lennox et al., 2012).
Using the estimation results from Eq. (6), we constructed IMR and employed it as an additional control variable in the original Eq. (3) model. The inclusion of IMR resulted in Leverage, Big4 and ForeignTrans becoming significant in the direction predicted by prior literature as well as an increase in R2 (from 66.89% to 76.28%). The direct effect of IW500 in Eq. (3) remained positive and significant (0.048, p < 0.029), providing continued support for rejecting the H1 null hypothesis.
capability more efficiently and incur lower audit fees. For instance, a sophisticated auditor might leverage a client's advanced IT environment to their advantage. Thus, the fourth robustness check explores this alternative by removing non-Big 4 auditors from the analysis, reasoning that the Big 4 make extensive IT investments in support of their audit practices and have large IT consulting capabilities. In this analysis, IW500 in Eq. (1) remained positive and significant (0.061, p < 0.001). The interaction IW500 * Assets in Eq. (2) remained positive and significant (0.026, p < 0.001). This suggests that employing a more sophisticated audit firm does not mitigate the higher audit fees experienced by a client with advanced IT capability.
Fifth, as an alternative proxy for size, we considered different filing statuses of firms. We replaced the size variable with a dichotomous variable based on the filing status of the firm. When large accelerated filer firms are coded as 1 (0 otherwise), IW500 remains positive and significant (0.071, p < 0.001). When large accelerated filers and accelerated filers are coded as 1 (0 otherwise) IW500 remains positive and significant (0.075, p < 0.001).
In summary, the primary analysis and alternative analyses support rejecting the null hypothesis in the positive direction. We consistently find that IT capability impacts audit pricing: companies with stronger IT capabilities have higher audit fees than companies with weaker IT capabilities.
5. Summary, limitations, and conclusion
5.1. Summary
Our main findings suggest that clients with strong IT capabilities incur higher audit fees. These results are robust when using various alternative measures and models. The results are consistent with current practitioners' observations: sophisticated IT en vironments require additional audit effort and the need for more specialized and expensive technical resources from audit firms (Abernathy et al., 2013; Half, 2015).
We employ three additional analyses to supplement these findings. First, we interact IT capability with the primary audit fee determinants identified in prior literature (Simunic, 1980). We find that firm size has a moderating effect on the association found in our primary results; IT capability has a stronger positive association with audit fees for larger firms compared with smaller firms. Second, we employ an alternate proxy for superior IT capability, IW500Repeat. This approach measures companies that have con sistently demonstrated superior IT capabilities over time. Our results with IW500Repeat are consistent with our primary results with IW500. Third, we replicate Chen et al. (2014) and split the results into three time periods. For the post-SOX years 2004 through 2007, companies with superior IT capabilities enjoyed smaller increases in audit fees compared to companies lacking strong IT, consistent with Chen et al. 2014’s results. This difference, however, is no longer apparent in the data during the respective recession and recovery periods of 2008 through 2009 and 2010 through 2012.
5.2. Limitations
Due to data restrictions, this research study does not address if the audit fee impacts were due primarily to more effort (hours), more expensive resources (rates), the increased use of specialized IT auditors, or a combination of these factors. Additionally, we do not explore how effectively clients' IT systems support and integrate with the external auditor's IT and methodology. Exploring these alternatives and attempting to uncover the specific components of IT capability that most impact the audit is an area for future research.
We cannot rule out the possibility of omitted correlated variables. Companies with superior IT capabilities may make other related decisions or investments that impact audit costs. For example, it is possible that business strategy may be correlated with IT capability (Bentley-Goode et al., 2013). Also, the current proxies used for business risk and complexity in typical audit fee models do not address IT risk and complexity. Future research might disentangle these effects. Finally, expanding the investigation to include non-U.S. markets may provide additional insights on this topic, particularly since companies typically are not subject to internal control audit requirements in these environments.
5.3. Conclusion
This paper contributes to auditing and information systems literature in three key ways: First, while prior research finds that strong IT capability reduces year-to-year audit fee growth in the post-SOX years (Masli et al., 2010; Chen et al., 2014), our findings indicate that companies with stronger IT capabilities pay higher audit fees in a given year. Second, our additional analysis suggests a revised view of Chen et al. (2014) may be warranted. For instance, it is possible that companies with superior IT capabilities may better adapt to exogenous shocks, including new auditing or accounting regulations, than companies that lack strong IT capabilities. Subsequently, the difference in audit fee growth attenuates as all companies adapt to the impact of new requirements over time. Third, our additional analysis suggests that larger companies with strong IT capabilities will pay disproportionately higher audit fees than smaller companies with strong IT capabilities. This diseconomy of scale may be of special interest to large companies with high IT sophistication, as they weigh the pros and cons of IT investment. It may also be of interest to the audit firms that audit these companies, as the auditors consider the necessary resources needed to audit clients with differing levels of IT capability.
Appendix A. Variable definitions
Dependent variables
Audit Feest = the log of audit fees for year t [“mathchfy_sum_audfees” field in Audit Analytics].
Independent variable
IW500 = 1 for a firm included in the Information Week 500 report; 0 otherwise.
IW500Repeat = count of the number of times in the current and prior four years an IW500 company has been recognized by the InformationWeek 500 for their superior IT capability. Range: 1 to 5.
Control variables (listed alphabetically)
Assets = the log of the total assets [“at” field in Compustat in millions].
AuditDelay = total of elapsed days from fiscal year end to filing of 10-k [“sig_date_of_op_s”and “fiscal_year_end_op”fields in Audit Analytics].
AuditorChange = 1 if company changes auditors, 0 otherwise [derived using the “auditor_fkey”field in Audit Analytics]. Big4 = 1 if the firm's auditor is a “Big 4” audit firm; 0 otherwise [derived using the “auditor_fkey” field in Audit Analytics]. ForeignTrans = 1 for a firm reporting foreign exchange income or loss; 0 otherwise [“fca” field in Compustat].
GoingConcern = 1 if the firm's auditor issued a going concern opinion; 0 otherwise [“going_concern” field in Audit Analytics]. IMR = Inverse Mills ratio used to control for potential selection bias. See Heckman.
(1979).
Leverage = the ratio of total debt to total assets [(“dltt”+ “dlc”)/“at”fields in Compustat].
Liquidity = the current ratio of total current assets divided by total current liabilities [“act”/“lct” fields in Compustat]. Loss = 1 if the firm reported loss; 0 otherwise [calculated using “ni” field in Compustat].
Rec_Inventory = the ratio of the sum of net accounts receivable and inventory to total assets [(“rect”+”invt”)/“at” fields in Compustat].
Restructuring = pre-tax restructuring charges scaled by the market value of equity [calculated using “rap”/(“chop” * ”prcc_f”) field in Compustat].
ROA = the ratio of net income to total assets [“ni”/“at” fields in Compustat].
Segments = the number of geographic segments [computed from the Compustat segment file].
Weakness = 1 if the firm reported a material weakness; 0 otherwise [calculated using the “count_weak” field in Audit Analytics].
Appendix B. Sample distribution by two-digit SIC code
SIC Description IW500 IW500 % Control Control %
10 Metal, mining 3 0.15% 209 0.73%
13 Oil and gas extraction 22 1.09% 810 5.43%
20 Food and kindred products 56 2.77% 468 3.14%
23 Apparel and other textile products 23 1.14% 185 1.24%
25 Furniture and fixtures 26 1.28% 147 0.99%
26 Paper and allied products 35 1.73% 246 1.65%
27 Printing publishing and allied industries 50 2.47% 207 1.39%
28 Chemicals and allied products 154 7.60% 1105 7.41%
29 Petroleum and coal products 23 1.14% 257 1.72%
33 Primary metal industries 21 1.04% 307 2.06%
34 Fabricated metal products 30 1.48% 170 1.14%
35 Industrial and commercial machinery 149 7.36% 943 6.32%
36 Electronic and other electrical equipment and components 137 6.77% 1319 8.84%
37 Transportation equipment 64 3.16% 446 2.99%
38 Measuring analyzing controlling instruments 84 4.15% 737 4.94%
42 Trucking and warehousing 51 2.52% 125 0.84%
44 Water transportation 8 0.40% 71 0.48%
45 Transportation by air 38 1.88% 200 1.34%
48 Communications 87 4.30% 852 5.71%
49 Electric gas and sanitary services 156 7.70% 1104 7.40%
50 Wholesale trade — durable goods 87 4.30% 362 2.43%
53 General merchandise stores 17 0.84% 173 1.16%
55 Automotive dealers and service stations 14 0.69% 172 1.15%
56 Apparel and accessory stores 15 0.74% 276 1.85%
58 Eating and drinking places 18 0.89% 305 2.04%
59 Misc. retail 35 1.73% 332 2.23%
70 Hotels and other lodging places 22 1.09% 55 0.37%
73 Business services 290 14.32% 1317 8.83%
79 Amusement and recreation services 25 1.23% 155 1.04%
80 Health services 44 2.17% 285 1.91%
87 Engineering acct research mgmt. and related services 41 2.02% 191 1.28%
All other industries 165 8.12% 1254 8.37%
Total 2025 100.00% 16,627 100.00%
References
Abbott, L., Parker, S., Peters, G., Raghunandan, K., 2003. The association between audit committee characteristics and audit fees. Audit. J. Pract. Theory 22 (2), 17-32.
Abernathy, J., Barnes, M., Stefaniak, C., 2013. A summary of 10years of PCAOB research: what have we learned? J. Account. Lit. 32, 30-60.
Accenture, 2005. Values. Driven. Leadership. The History of Accenture. The History Factory, VA, pp. 16-23 ISBN 0-9773882-0-4.
Aiken, L., West, S., 1991. Multiple Regression: Testing and Interpreting Interactions. Sage Publications, Newbury Park, CA.
Alles, M.G., 2015. Drivers of the use and facilitators and obstacles of the evolution of big data by the audit profession. Account. Horiz. 29 (2), 439-449.
American Institute of Certified Public Accountants (AICPA), 1984. The Effects of Computer Processing on the Audit of Financial Statements. Statement on Auditing Standards No. 48. AICPA, New York, NY.
Axelsen, M., Green, P., Ridley, G., 2017. Explaining the information systems auditor role in the public sector financial audit. Int. J. Account. Inf. Syst. 24, 15-31.
Barney, J., 1991. Firm resources and sustained competitive advantage. J. Manag. 17 (1), 99-120.
Behn, B., Searcy, D., Woodroof, J., 2006. A within firm analysis of current and expected future audit lag determinants. J. Inf. Syst. 20 (1), 65-86.
Belsley, D., Kuh, E., Welsch, R., 1980. Regression Diagnostics: Identifying Influential Observations and Sources of Collinearity. John Wiley and Sons, NY, pp. 153-157.
Bentley-Goode, K., Omer, T., Sharp, N., 2013. Business strategy, financial reporting irregularities, and audit effort. Contemp. Account. Res. 30 (2), 780-817.
Bharadwaj, A., 2000. A resource-based perspective on information technology capability and firm performance: an empirical investigation. MIS Q. 24.1 (2000), 169-196.
Bhatt, G., Grover, V., 2005. Types of information technology capabilities and their role in competitive advantage: an empirical study. J. Manag. Inf. Syst. 22 (2), 253-277.
Brazel, J., Agoglia, C., 2007. An examination of auditor planning judgements in a complex accounting information system environment. Contemp. Account. Res. 24 (4), 1059-1083.
Canada, J., Sutton, S., Kuhn, J., 2009. The pervasive nature of IT controls: an examination of material weaknesses in IT controls and audit fees. Int. J. Account. Inf. Manag. 17 (1), 106-119.
Cao, M., Chychyla, R., Stewart, T., 2015. Big Data analytics in financial statement audits. Account. Horiz. 29 (2), 423-429.
Carcello, J., Hermanson, D., Neal, T., Riley, R., 2002. Board characteristics and audit fees. Contemp. Account. Res. 19 (3), 365-384.
Chae, H., Koh, C., Prybutok, V., 2014. Information technology capability and firm performance: contradictory findings and their possible causes. MIS Q. 38 (1), 305-326.
Chang, H., Chen, J., Duh, R., Li, S.H., 2011. Productivity growth in the public accounting industry: the roles of information technology and human capital. Audit. J. Pract. Theory 30 (1), 21-48.
Chen, I.J., 2001. Planning for ERP systems: analysis and future trend. Bus. Process. Manag. J. 7 (5), 374-386.
Chen, C., Lim, J., Stratopoulos, T., 2011. IT capability and a firm's ability to recover from losses: evidence from the economic downturn of the early 2000s. J. Inf. Syst. 25 (2), 117-144.
Chen, Y., Smith, A., Cao, J., Xia, W., 2014. Information technology capability, internal control effectiveness, and audit fees and delays. J. Inf. Syst. 28 (2), 149-180.
Christ, M., Mintchik, N., Chen, L., Bierstaker, J., 2015. Outsourcing the information system: determinants, risks, and implications for management control systems. J. Manag. Account. Res. 27 (2), 77-120.
Curtis, M., Jenkins, J., Bedard, J., Deis, D., 2009. Auditors' training and proficiency in information systems: a research synthesis. J. Inf. Syst. 23 (1), 79-96.
Dehning, B., Richardson, V., Zmud, R., 2003. The value relevance of announcements of transformational information technology investments. MIS Q. 637-656. Deloitte, 2015. The Robots Are Coming. Deloitte, London. https://www2.deloitte.com/uk/en/pages/finance/articles/robots-coming-global-business-services.html.
Dowling, C., 2009. Appropriate audit support system use: the influence of auditor, audit team, and firm factors. Account. Rev. 84 (3), 771-810.
Dowling, C., Leech, S., 2014. A Big 4 firm's use of information technology to control the audit process: how an audit support system is changing auditor behavior. Contemp. Account. Res. 31 (1), 230-252.
Doyle, J., Ge, W., McVay, S., 2007. Determinants of weaknesses in internal control over financial reporting. J. Account. Econ. 44 (1), 193-223.
Fischer, M., 1996. “Real-izing” the benefits of new technologies as a source of audit evidence: an interpretive field study. Acc. Organ. Soc. 21 (2), 219-242.
Francis, J., Wang, D., 2005. Impact of the SEC's public fee disclosure requirement on subsequent period fees and implications for market efficiency. Audit. J. Pract. Theory 24 (s-1), 145-160.
Robert Half, 2015. 2015 Salary Guide. http://www.roberthalf.com/finance/accountant-salary 2015 salary guide [large companies], accessed Feb. 2, 2015.
Hay, D., Knechel, W., Wong, N., 2006. Audit fees: a meta-analysis of the effect of supply and demand attributes. Contemp. Account. Res. 23 (1), 141-191.
Heckman, J., 1979. Sample selection as a specification error. Econometrica 47 (1), 153-161.
Hermanson, D., 2009. How consulting services could kill private-sector auditing. CPA J. 79 (1) 6, 8-9.
Hogan, C., Wilkins, M., 2008. Evidence on the audit risk model: do auditors increase audit fees in the presence of internal control deficiencies? Contemp. Account. Res. 25 (1), 219-242.
InformationWeek, 2011. http://twimgs.com/infoweek/iw500/2011/InformationWeek500_FAQ.pdf accessed Sept. 2013. ISACA, 2017. COBIT 5 Framework. http://www.isaca.org/COBIT/Pages/COBIT-5-Framework-product-page.aspx.
Janvrin, D., Bierstaker, J., Lowe, D., 2008. An examination of audit information technology use and perceived importance. Account. Horiz. 22 (1), 1-21.
Janvrin, D., Bierstaker, J., Lowe, D., 2009. An investigation of factors influencing the use of computer-related audit procedures. J. Inf. Syst. 23 (1), 97-118.
Kanellou, A., Spathis, C., 2011. Auditing in enterprise system environment: a synthesis. J. Enterp. Inf. Manag. 24 (6), 494-519.
Klamm, B., Kobelsky, K., Watson, M., 2012. Determinants of the persistence of internal control weaknesses. Account. Horiz. 26 (2), 307-333.
Kobelsky, K., Richardson, V., Smith, R., Zmud, R., 2008. Determinants and consequences of firm information technology budgets. Account. Rev. 83 (4), 957-995.
Kohli, R., Grover, V., 2008. Business value of IT: an essay on expanding research directions to keep up with the times. J. Assoc. Inf. Syst. 9 (1), 23.