i
The ecotoxicological and
environmental behaviour and
transformations of silver nanoparticles
By
Isabella Romer Roche
School of Geography, Earth and Environmental Sciences
College of Life and Environmental Sciences
The University of Birmingham, UK
University of Birmingham Research Archive
e-theses repository
This unpublished thesis/dissertation is copyright of the author and/or third
parties. The intellectual property rights of the author or third parties in respect
of this work are as defined by The Copyright Designs and Patents Act 1988 or
as modified by any successor legislation.
Any use made of information contained in this thesis/dissertation must be in
accordance with that legislation and must be properly acknowledged. Further
distribution or reproduction in any format is prohibited without the permission
of the copyright holder.
i
Abstract
Silver nanoparticles (AgNPs) are currently widely used and of special interest due to their anti-microbial properties. They have been used extensively in commercial applications in cosmetics and as bacteriocides in fabrics and other consumer products and they also show great potential in medicine and health-related areas. AgNPs might be the most worrying of the manufactured nanoparticles because of their inherent toxicity and the many different consumer products used will undoubtedly lead to wide exposure in the environment.
Synthesizing silver nanoparticles that are both uniform and stable and to be able to control their size distribution is a difficult task. Citrate reduction is a widely used method, but the nanoparticles synthesized with it have a broad size distribution and different morphologies. Coating the NP surface with layers of neutral organic molecules can efficiently protect them from aggregation by steric repulsion. Monodisperse and stable AgNPs, with citrate and PEG as capping agents, of three different sizes (7, 10 and 20nm) have been synthesised and fully characterised (using DLS, AFM, UV-Vis, FFF, TEM, and a range of other methods).
Once released into the environment, the mobility, bioavailability, and toxicity of AgNPs in any ecosystem are dominated by colloidal stability. There have been studies on the stability or the aggregation of various NPs under a range of environmental conditions, but there is little information on fully characterised AgNPs in media used in (eco) toxicity studies.
Stability of AgNPs (7, 10 and 20nm citrate capped) was assessed over 24 or 48 hours or 21 days (similar time periods to acute and chronic OECD tests) in different dilutions of media recommended by OECD for Daphnia magna toxicity testing. The particles aggregated quickly in the media. After diluting the media by a factor of 2, 5 or 10, aggregation was reduced, although the smallest NPs were unstable under all media conditions. Media diluted up to 10-fold in the absence of AgNPs did not induce any loss of either viability or mobility in the daphnids. A brief range finding experiment in a 10-fold dilution of the media indicated the concentration at which 7nm particles caused 50% immobilisation (LC50) of D. magna neonates (<24hrs) to be 5.36 g L-1, LC50 couldn’t be calculated for
ii
the particles in media1. In the case of AgNO3, LC50 values for media1 and media10 were 1.43 and 0.87 g L-1, respectively. AgNPs aggregate in high ionic strength media and aggregated forms are much less toxic, the reason is mostly due to change in nature of toxicant (aggregate dispersed). We recommend the use of a 10-fold diluted OECD media to perform ecotoxicology experiments to obtain disperse and stable citrate capped AgNPs.
AgNPs of 20nm in size and citrate capped were exposed to different environmentally relevant conditions, i.e. sunlight, synthetic waters, presence of natural organic matter, etc, and the changes were followed by DLS and UV-vis. The addition of fulvic acid (FA) improves particle stability, while sunlight makes particles more unstable. Solutions with high ionic strength induce aggregation. By using HR-STEM and electron energy-loss spectroscopy (EELS) surface changes of citrate stabilized AgNPs prepared in the lab were assessed after being exposed to different conditions. No oxidation was observed on any of the conditions, only aggregation and dissolution.
iii
Para mi abuelo, donde quiera que estes, Dr Marcel Roche. Para mi mamá, que siempre ha creido en mi, Noelle Roche. Mojej babci dziękuję za wszystko, Irene de Romer. Finalmente, para Vladimir Peña, gracias por ayudarme a mantener mi cordura, eres el amor de mi vida.
iv
Acknowledgements
I would like to thank the University of Birmingham, School of Geography, Earth and Environmental Sciences and CEFAS for the financial support which made this research possible. I would like to thank my supervisor, Prof. Jamie Lead for giving me the opportunity to do my PhD work in his group and for all his support and help. I would also like to thank my co-supervisors Prof. Mark Viant and Dr. Brett Lyons (from CEFAS), and also Prof. Kevin Chipman, for all their support.
Many people helped me in my work, through their expertise or technical support. I would like to thank Dr. Steve Baker for the ICP-MS element analyses and Dr. James Bowen for his help with the Rheometer. I want to acknowledge the people from the microscopy centre, Paul Stanley, Theresa Morris and Ming Chu, for their help with the TEM. I would like to thank Zhiwei Wang, from the Nanoscale Physics Research Laboratory, for all his help with the STEM, and Richard Palmer. Many thanks go to Sue for her help with nanoparticle synthesis and to Mohammed for all his help with the FFF, TEM, AFM and nanoparticles in general. I would like to thank especially Ruth for all the coffees and her help with AFM, TEM, physics and my dissertation; this past 3 years would have been very hard if it wasn’t for your help and friendship.
Special thanks go to all the people in the group, for the great atmosphere in the lab, and all the people in office 325. Thanks Laura for all the lunch breaks and good times, thanks Marie for all the talks about food (our shared passion) and all the times that we went to the cinema. I would also like to thank Mila, for all her support with work and all the smiles she shares with everyone. Special thanks go to the wonderful Daphnia workers, Tom White and Alex Gavin, without whom I wouldn’t have been able to finish this thesis; I hope your Daphnia babies are always happy
Last but not least, I want to acknowledge everyone that gave me support directly or indirectly, my flatmate Paulo, another PhD survivor and great friend; Santi, the best friend one can ask for; Diana, that was going through this process at the same time as me; my family, my sister Paula, who has also been through this process at the same time as me and has been a great support throughout the years, my brother Gonzalo, who I miss very much, my mother, a great woman that has been an
v
inspiration to all her children, my father, always there to listen, my grandmother, who has also been my rock and a very special person in my life, my uncle Bobby, for all the laughs and good times, and the friends that have always been there for me, even if they are one ocean away. Thanks for believing in me.
I’m also grateful for all the distraction that dateline MSNBC, Channel 4 documentaries, Crime shows, Ghost Whisperer and many musicians and bands have given me in this stressful period of time, it wouldn’t have been the same without them.
Finally I want to thank my boyfriend, Vlad, who has helped me keep my cool and has been there in the good, the bad and the stressful times. Thank you, lovely, for believing in me, these times would have been much harder if it wasn’t for your support.
vi
Table of Contents
Abstract ... i Acknowledgements ... iv List of Figures ... x List of tables ... xxCommon abbreviations ... xxii
Chapter 1 Introduction ... 1
1.1 Introduction to nanotechnology and nanoparticles ... 1
1.2 Type of nanomaterials ... 5
1.3 Silver nanoparticles ... 7
1.4 Synthesis of metal nanoparticles... 8
1.4.1 Nucleation and Growth ... 15
1.5 Nanoparticle characteristics and properties ... 18
1.5.1 Size of nanoparticles ... 19
1.5.2 Shape and crystallinity of nanoparticles ... 20
1.5.3 Nanoparticle aggregation, DLVO theory and fractal dimensions ... 24
1.5.4 Non-DLVO interactions ... 27
1.6 Discharge and Release ... 27
1.7 Fate, behaviour and transport ... 29
1.8 Predicted environmental concentrations (PEC)... 33
1.9 Quantifying dose ... 34
1.10 Toxicity of silver nanoparticles ... 35
1.10.1 Daphnia magna for toxicological assays ... 44
1.10.3 Toxicity to microbes ... 46
1.11 Research aims and objectives ... 46
Chapter 2 Methodology ... 47
2.1 Chapter Summary ... 47
2.2 Materials and methods ... 48
2.2.1 Chemicals ... 48
2.2.2 pH measurements ... 48
2.2.3 Media and synthetic water preparation ... 48
2.2.4 Synthesis of citrate stabilized AgNPs ... 50
vii
2.2.6 Sample preparation ... 51
2.2.7 Filtration and ultrafiltration ... 52
2.3 Characterisation ... 53
2.3.1 Dynamic light scattering (DLS) ... 53
2.3.2 Electrophoretic mobility (EPM) and zeta potential ... 55
2.3.3 Flow field-flow fractionation (FI-FFF) ... 57
2.3.4 Surface Plasmon Resonance (SPR) ... 62
2.3.5 Inductively Coupled Plasma Mass Spectrometry (ICP-MS) ... 65
2.3.6 Atomic Force Microscopy (AFM) ... 67
2.3.7 Transmission Electron microscopy (TEM) ... 71
2.3.8 Energy Dispersive X-ray spectrometer (EDX) ... 73
2.3.9 Scanning Transmission Electron microscopy (STEM) ... 75
2.3.10 Electron Energy-Loss Spectroscopy (EELs) ... 78
2.3.11 Statistical analysis ... 81
2.4 Summary of methods used ... 82
Chapter 3 Synthesis and characterisation of silver nanoparticles with citrate and PEG as capping agent ... 83
Chapter Summary ... 83
3.1 Introduction ... 84
3.1.1 Aims and objectives ... 84
3.2 Synthesis of nanoparticles ... 85
3.2.1 Synthesis of citrate stabilized AgNPs ... 85
3.2.1.1 Experiment to assess the rate of adding the reducing agent... 86
3.2.1.2 Experiment to assess the concentration of the reagents and reaction conditions ... 86
3.2.2 Synthesis of PEGylated AgNPs ... 88
3.3 Characterisation ... 88
3.4 Results and discussion ... 88
3.4.1 Citrate stabilized AgNPs... 88
3.4.1.1 Rate of reactant addition, ratio of reagents and concentration ... 89
3.4.1.2 Heating time ... 89
3.4.1.3 Particles used for further studies ... 89
3.4.2 PEGylated AgNPs ... 100
viii
Chapter 4 Aggregation and dispersion of silver nanoparticles in exposure media for aquatic toxicity
tests ... 109
Chapter Summary ... 109
4.1 Introduction ... 110
4.2 Experimental ... 113
4.2.1 Synthesis of citrate stabilized AgNPs ... 113
4.2.2 Preparation of the media for culture of Daphnia magna ... 113
4.2.3 Stability test ... 113
4.2.4 Particle characterisation ... 113
4.2.4.1 Flow–field flow fractionation (FlFFF) ... 113
4.2.4.2 DLS and zeta potential ... 114
4.2.4.3 Surface plasmon resonance ... 114
4.2.4.4 Transmission electron microscopy (TEM) and EDX ... 114
4.2.4.5 Atomic Force Microscopy (AFM) ... 115
4.2.4.6 Calculations ... 115
4.2.5 Daphnia magna tests ... 115
4.2.5.1 D. magna acute toxicity testing ... 116
4.2.5.2 D. magna chronic reproductive toxicity testing ... 116
4.2.5.3 Acute Exposures to AgNP3 and AgNO3 ... 116
4.3 Results ... 117
4.3.1 The effect of D. magna toxicity testing media on AgNP properties ... 117
4.3.1.1 DLS, zeta potential, UV-vis and FI-FFF measurements ... 117
4.3.1.2 AFM, TEM and EDX measurements ... 122
4.3.2 Acute effect of media dilution on D. magna ... 127
4.3.3 Chronic effect of media dilution on D. magna reproduction ... 127
4.3.4 Acute Exposures to AgNP3 and AgNO3, calculation of LC50 ... 128
4.4 Discussion ... 131
4. Conclusions ... 136
Chapter 5 A STEM- EELS study of AgNPs behaviour under realistic environmental conditions... 137
Chapter Summary ... 137
5.1 Introduction ... 138
5.2 Experimental ... 140
5.2.1 Synthesis of citrate stabilized AgNPs ... 140
5.2.2 Preparation of synthetic water and fulvic acid ... 140
ix
5.2.4 Particle characterisation ... 142
5.2.4.1 DLS ... 142
5.2.4.2 Surface plasmon resonance (UV-vis) ... 142
5.2.4.3 Scanning Transmission Electron microscopy (STEM) and Electron Energy-Loss Spectroscopy (EELs) ... 142
5.3 Results ... 143
5.3.1 Samples as prepared ... 143
5.3.1.1 STEM-EELS measurements on AgNP1 and AgNP3 ... 143
5.3.2 Measurements on AgNP1 exposed to sunlight ... 148
5.3.2.1 Concentrated AgNP1 exposed to sunlight (AgNP1-light) ... 148
5.3.2.2 AgNP1 in UHP water exposed to sunlight (AgNP1- H2O) ... 154
5.3.3 Measurements on AgNP1 under environmentally relevant conditions ... 155
5.3.3.1 AgNP1 with Fulvic acid (exposed to sunlight and kept in the dark) ... 155
5.3.3.2 AgNP1 in very soft water, with and without fulvic acid (exposed to sunlight and kept in the dark) ... 158
5.3.3.3 AgNP1 in soft water, with and without fulvic acid (exposed to light and kept in the dark) ... 162
5.3.3.4 AgNP1 in sea water, with a without fulvic acid exposed to light ... 170
5.4 Discussion ... 171
5.5 Conclusions ... 177
Conclusions and Future work... 179
6.1 Conclusions ... 179
6.1.1 Aim 1: Synthesis and characterisation of AgNPs using citrate and PEG. ... 179
6.1.2 Aim 2: Assess the stability of AgNPs in Daphnia magna toxicity media, investigating the effect of media dilution on particle stability and D. magna viability. ... 180
6.1.3 Aim 3: Test the effects on AgNPs stability of different environmentally relevant conditions, such as synthetic waters, exposure to light and presence of organic matter (fulvic acid). ... 180
6.2 Future work ... 181 References... 183 APPENDIX A ... 204 Additional results ... 204 CD Rom ... 204 APPENDIX B ... 205 Published work ... 205 Published papers: ... 205
Posters presented in conferences: ... 208
x
List of Figures
Chapter 1
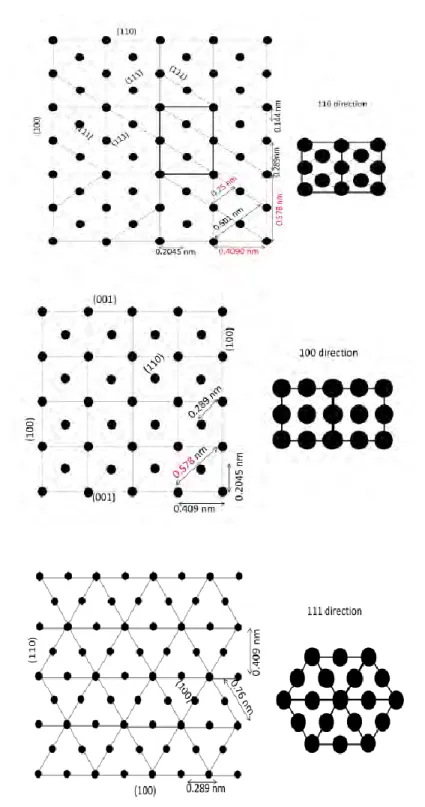
Figure 1.1 Scale in nanometres and meters comparing the size of nanoparticles with different things found in nature. Adapted from (Monge 2008). ... 2 Figure 1.2 Number of total products listed, by date of inventory update, with regression analysis, courtesy of (Woodrow_Wilson_database 2011)... 3 Figure 1.3 Lycurgus Cup that contains silver and gold nanoparticles. When light it shinned through the cup it changes colour, from green to red. Source http://news.bbc.co.uk/1/hi/sci/tech/7722620.stm ... 4 Figure 1.4 Number of products associated with specific materials (Woodrow_Wilson_database 2011). ... 6 Figure 1.5 Size comparison of nanoparticles with different chemical species. Illustration of the bottom-up and top-down method of synthesis. Adapted from (Monge 2008). ... 9 Figure 1.6 An example of electrostatically (a) and sterically (b) stabilized AgNPs. In the case of the citrate capped NPs, the negatively charged citrate caps the positively charged surface of the NP. Based on (Dumur et al. 2011). ... 11 Figure 1.7 Reduction of nanoparticles by using PVP as capping and reducing agent, including some images of the particles obtained (Hoppe et al. 2006). ... 14 Figure 1.8 Nucleation process for AgNPs stabilized with citrate, formation of seeds (García-Barrasa et al. 2011). ... 15 Figure 1.9 Primary and Secondary Growth Steps in the Formation of Silver Nanoparticles (Pillai et al. 2004). ... 16 Figure 1.10 Schematic representation of the solute transfer from the smallest to the largest crystal during Ostwald ripening. The crystals are separated by the distance X and their concentration spheres interact with the cross section A. Since they are not of infinite size and since equilibrium must be achieved, the crystals must (slightly) dissolve in order to restore the proper concentrations.
xi
When the distance X between the crystals is not too large, the two concentration spheres intersect with a cross section of area A (Boistelle et al. 1988). ... 17 Figure 1.11 The important properties of manufactured NPs in aqueous media are shown, indicating that a homogeneous solid sphere with a clean surface can’t be assumed. These properties are important to understand the fate and behaviour of these NPs in the environment or for ecotoxicology experiments. Therefore, we need a multi-method approach to obtain a complete characterisation (Hassellöv et al. 2009). ... 19 Figure 1.12 Surface lattice planes of the FCC system for a single crystal in the case of Ag. The most frequently studied surface planes are [100], [110] and [111]. The lattice parameter is explained in Figure 1.14. Courtesy of Ruth Merrifield. ... 21 Figure 1.13 Surface lattice planes of the FCC system for Ag, looked from different planes. Interatomic distances are shown in red in the different images. Images courtesy of Ruth Merrifield. ... 22 Figure 1.14 Pathways that lead to FCC metal NPs with different shapes. First, a precursor is reduced or decomposed to form seeds with a single-crystal, singly twinned, or multiply twinned structure. Plate-like seeds will form if stacking faults are introduced. The green, orange, and purple represent the [100], [111], and [110] facets, respectively. Twin planes are delineated in the drawing with red lines (Xia et al. 2009). ... 23 Figure 1.15 Measurements of aggregate fractal dimensions. (a) One-dimensional fractal dimension power–law scaling with perimeter and the maximum length of an aggregate. (b) Two-dimensional fractal dimensions power–law scaling with area and the maximum length of an aggregate. (c) Perimeter based fractal dimension power–law scaling with area and perimeter. (d) Three-dimensional fractal dimensions power–law scaling with the number of primary particles and the radius of gyration (Lee et al. 2004). ... 26 Figure 1.16 Interaction of NPs with natural water components. From (Christian et al. 2008). ... 31 Figure 1.17 Image taken from: (Fabrega et al. 2011). Micrographs of in vivo uptake of Ag NPs by different organisms. A) TEM image of AgNPs being taken up by the prokaryote Pseudomonas putida (bacteria) after a 24 h exposure of 2 mg L− 1 suspension of Ag NPs with 10 mg L− 1 humic substances (Fabrega et al. 2009). B) Dark field image of AgNPs in the nematode Caenorhabditis elegans (roundworm) uterus after a 24 h exposure to 0.5 mg L− 1 of AgNPs (Roh et al. 2009). C) TEM image of gill tissue dissected from rainbow trout after a 10 day waterborne exposure to 100 μg L− 1 Ag
xii
NP suspension (Scown et al. 2010), and D) TEM images of BSA-AgNPs deposited in the cell and nucleus near the tail and trunk of zebrafish embryos treated with 25 μg L− 1 BSA-Ag NPs (Asharani et al. 2008). ... 37 Figure 1.18 Daphnia magna pictures, the one on the left shows neonates as well as an adult (courtesy of Professor Mark Viant, University of Birmingham). The image on the right shows an adult D. magna in colour (Ebert 2005). ... 45
Chapter 2
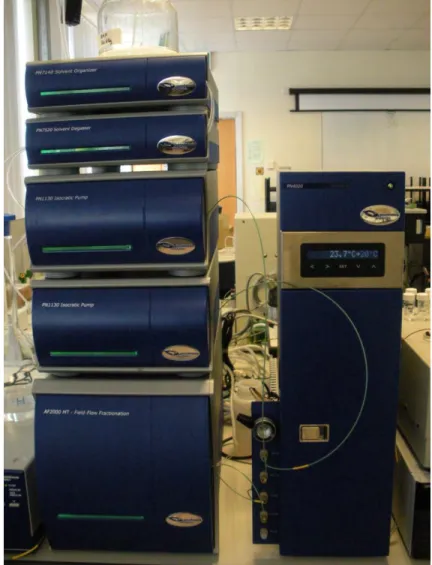
Figure 2.1 Left: millipore sterifil filtration system. Right: Ultrafiltration equipment assembly.Sample is placed in chamber, N2 gas is passed over the sample from the top with the filtrate collected from the bottom. The sample is stirred to reduce aggregation as the sample concentrates. Images obtained from Fisher Scientific, UK... 52 Figure 2.2. Influence of smaller particles on DLS measurements. An example of a sample containing equal amount of 5 nm and 50 nm particles showing: a) number distribution, b) volume distribution and the c) intensity distribution. Taken from (Zetasizer-manual 2003-2004). ... 54 Figure 2.3. Malvern zetasizer 5000. ... 55 Figure 2.4. Schematic of the electrical double layer at the surface of solution-phase nanoparticles. Image from http://www.nanocomposix.com. ... 56 Figure 2.5. Field flow fractionation. (A) Sample is injected into the FFF unit as a diffuse mixture. (B) A perpendicular field is established, and the sample particulates distribute on the basis of diffusion rates versus field strength. (C) The external field is removed, the samples are flushed from the system, and particles farther from the chamber floor elute faster (Willis 2002). ... 57 Figure 2.6. FFF separation: ribbon like FFF channel (top), sandwiched between channel walls this is usually 75–260 μm in thickness (image from http://www.wyatt.com). Different distributions of two particles within the channel (bottom). ... 59 Figure 2.7. Asymmetrical flow-field flow fractionator (FlFFF) (AF2000 Mid Temperature, Postnova Analytics) used in the experiments. ... 62 Figure 2.8. Schematic of plasmon oscillation for a sphere, showing the displacement of the conduction electron charge cloud relative to the nuclei (Kelly et al. 2003). ... 63
xiii
Figure 2.9. Diagram of a UV-vis. Courtesy of Ruth Merrifield. ... 65
Figure 2.10. Schematic diagram of the Agilent 7500 ICP-MS. ... 66
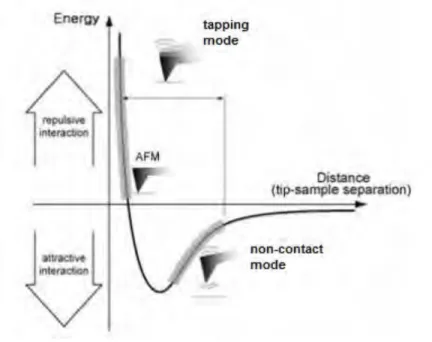
Figure 2.11. Relation between the force and the distance between atoms (PSIA 2002). ... 67
Figure 2.12. Diagram of AFM principle for imaging. Courtesy of Ruth Merrifield. ... 68
Figure 2.13. Diagram of conventional AFM’s scanning (PSIA 2002). ... 68
Figure 2.14. AFM Imaging modes. Image adapted from http://kristian.molhave.dk/. ... 69
Figure 2.15. AFM XE-100. Image obtained from Park systems product catalogue. ... 70
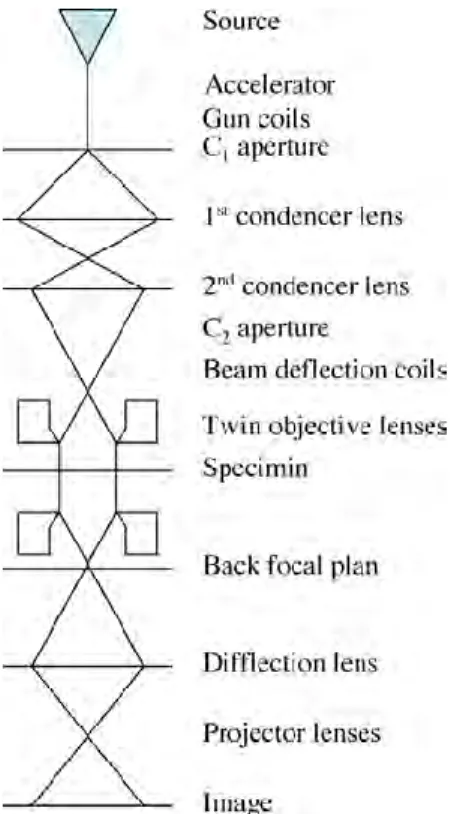
Figure 2.16. Schematic presentation of a transmission electron microscope and the electron path. Image courtesy of Ruth Merrifield, based on (Williams et al. 1996). ... 72
Figure 2.17. Tecnai F20 (left, image courtesy of http://www.fei.com) and JEOL 1200EX (right, image courtesy of http://www.caeonline.com). ... 73
Figure 2.18. Diagram for the principle of EDX. De-excitation mechanisms for an atom that has undergone K-shell ionisation by primary electrons (Kirkland et al. 2007). ... 74
Figure 2.19. Top: Diagram of an STEM, courtesy of Ruth Merrifield. Bottom: Schematic of an aberration corrected STEM. Electron trajectories at the edge of the apertures are shown with solid lines. High angle scattering used to form Z-contrast images is indicated with dashed lines and low angle scattering used to form bright-field images is indicated with gray lines (Kirkland et al. 2007). .. 76
Figure 2.20. Diagram of a HAADF. In an Aberration corrected microscope, the probe size can be made small enough to obtain EELs spectrum of one/two atoms. With the right software the probe can be automatically scanned across the sample in a pre-defined grid allowing elemental mapping to be obtained. ... 78
Figure 2.21. Schematic diagram of a typical EELS tube that can be fitted onto a TEM unit. The electrons enter through a slit that removes any that have been scattered to a high angle. They then pass through a magnetic prism and drift tube that split the electrons up into their relative energies and guide them. The energy to be analysed is then selected and detected. Courtesy of Ruth Merrifield. . 79
Figure 2.22. Schematic diagram of a general EELs spectrum (with a linear intensity scale and a gain change at a high energy loss) showing all of the general observable features.ELNEs stands for electron energy loss near edge structure, which modifies the basic atomic shape within the first 30-60 eV above the edge threshold. EXELFS stands for extended energy loss fine structure, which is a region of weaker and extended oscillations. ... 80
xiv
Chapter 3
Figure 3.1. Reactions for AgNP2, AgNP1 and AgNP3 (from left to right) in the beginning of the
reaction (left), NaBH4 hadn’t been added to AgNP3, and at the end of the reaction (right). ... 85
Figure 3.2. SPR data for AgNP1, AgNP2 and AgNP3. ... 91
Figure 3.3. Size distribution by intensity obtained with DLS for AgNP1, AgNP2 and AgNP3. ... 92
Figure 3.4. Size distribution results obtained with FFF for the nanoparticles in citrate. ... 93
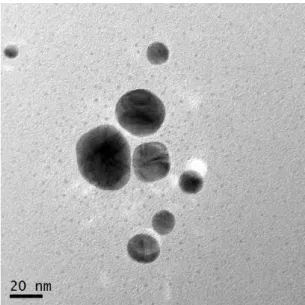
Figure 3.5. Transmission electron microscope images of a) AgNP1, b) AgNP2 and c) AgNP3. Images obtained by Tecnai. ... 93
Figure 3.6. Histograms shown particle size distribution of the different samples measured by TEM, a) AgNP1, b) AgNP2 and c) AgNP3. ... 93
Figure 3.7. Example of an EDX spectrum taken for AgNP1. Typical peaks are shown, the copper and carbon signal come from the grid used, we are interested in the silver peak. Results were similar for the rest of the samples. ... 94
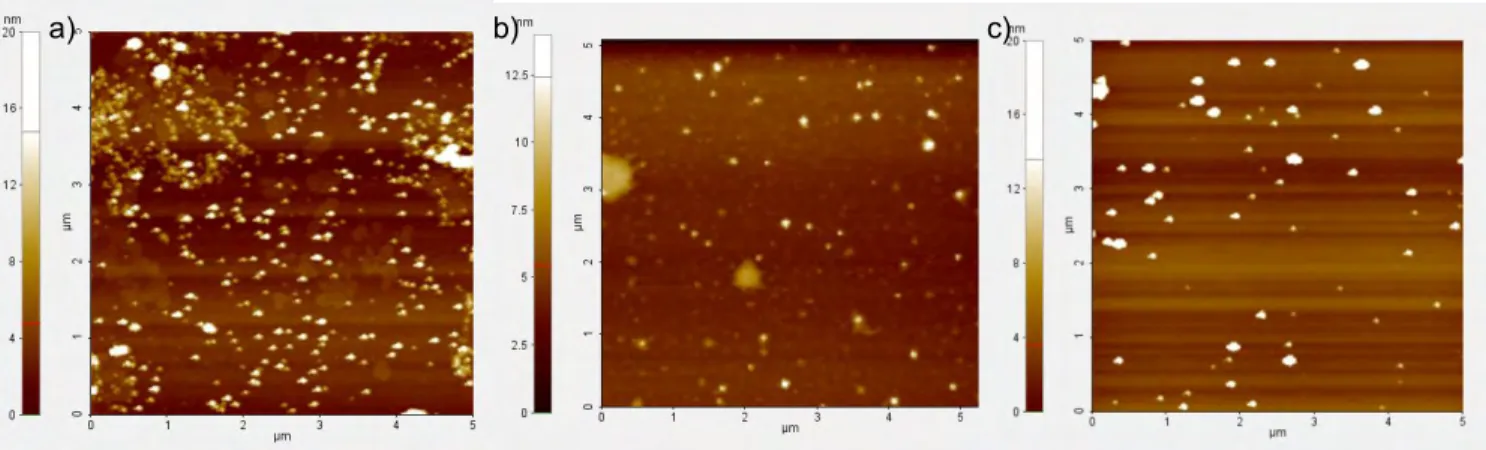
Figure 3.8. Atomic force microscopy images of a) AgNP1, b) AgNP2 and c) AgNP3. ... 94
Figure 3.9. Histograms shown particle size distribution of the different samples measured by AFM, a) AgNP1, b) AgNP2 and c) AgNP3. ... 95
Figure 3.10. TEM image for unwashed AgNP1 particles. Image obtained by Tecnai F20. ... 97
Figure 3.11. Example of an EDX spectrum taken for a small particle in the sample of Figure 3.10. Typical peaks are shown, the copper signal comes from the grid used. We are interested in the silver peak, which is small because the particle is very small. ... 97
Figure 3.12. SPR spectra for AgNP1 followed for 3 years. The NPs were stored in the dark at 4°C. . 98
Figure 3.13. Top: High-resolution TEM of a colloidal silver particle observed along the [111] direction and its schematic model, as seen in (Silvert et al. 1997), bottom: Schematic models of the multiply-twinned particle: (a) decahedron; (b) icosahedrons (Marks et al. 1981). ... 99
Figure 3.14. a) SPR spectra for AgNP1, before and after adding PEG, b) for the three different sizes obtained. ... 100
Figure 3.15. Size distribution by intensity obtained with DLS for AgNP1-PEG, AgNP2-PEG and AgNP3-PEG. ... 101
xv
Figure 3.16. Transmission electron microscope images of a) AgNP1- PEG, b) AgNP2- PEG and c) AgNP3-PEG. Images were obtained with JEOL 1200EX. ... 102 Figure 3.17. Histograms shown particle size distribution of the different samples measured by TEM, a) AgNP1-PEG, b) AgNP2-PEG and c) AgNP3-PEG.Data was compared to the values obtained for the citrate particles and results show no significant statistical difference between the values (AgNP1 p = 0.48, AgNP2 p = 0.94, AgNP3 p = 0.71). ... 102 Figure 3.18. EDX obtained for AgNP1- PEG using AZtecEnergy from Oxford Instruments. ... 103 Figure 3.19. The formula for PEG-SH used in the preparation of the particles. Courtesy of sigma Aldrich, Mercaptopolyethylene glycol monomethyl ether (PEG-thiol). ... 103 Figure 3.20. EDX map performed with tecnai F20 and analyzed with AZtecEnergy (oxford instruments). ... 104 Figure 3.21. Size distribution results obtained with FFF for the nanoparticles in citrate. ... 105 Figure 3.22. AFM images of a) AgNP1-PEG, b) AgNP2-PEG and c) AgNP3-PEG. ... 106 Figure 3.23. Histograms shown particle size distribution of the different samples measured by AFM a) AgNP1-PEG, b) AgNP2-PEG and c) AgNP3-PEG. ... 106
Chapter 4
Figure 4.1. Size distribution by intensity obtained with DLS after 24 hours in media1 and media10 (left and right, respectively) for AgNP1 (a, b), AgNP2 (c, d) and AgNP3 (e, f). ... 118 Figure 4.2. Size distribution results obtained with FFF for the AgNPs in different dilutions of Daphnia media.Results for AgNP1 are shown in a) where - - - shows the particles as prepared, ….. shows the particles in water, _ . _ . shows the particles in media5 and the gray line shows the particles in media10. AgNP2 is shown in b) where - - - shows the particles as prepared, ….. shows the particles in water, the black line shows the particles in media2, the gray line in media5 and _ . _ . shows the particles in media10. AgNP3 is shown in c) where _ . _ . shows the particles as prepared, the gray line shows the particles in water, the black line shows the particles in media5 and , ….. shows the particles in media10. ... 120
xvi
Figure 4.3. TEM images for AgNP1 (first row from left to right), AgNP2 (middle) and AgNP3 (right row) in media 1 (top row), media2 (middles row) and media10 (bottom row), after 24 hours. The scale bar
for media1 and media2 is 100nm and 20nm for media10. ... 123
Figure 4.4. EDX map for AgNP1 aggregates in media2 performed with tecnai F20 and analyzed with AZtecEnergy (oxford instruments). ... 124
Figure 4.5. AFM images for AgNP1 (first row from left to right), AgNP2 (middle) and AgNP3 (right row) in media 1 (top row), media2 (middles row) and media10 (bottom row), after 24 hours.The AFM images are 5 x 5 µm and the samples were prepared by centrifugation method. ... 125
Chapter 5
Figure 5.1. Typical image for AgNP1 (A, B) and AgNP3 (C, D) measured with STEM. Image A shows typical HAADF images of AgNP1 on the commercial graphene supports. ... 144Figure 5.2. EELs point spectra for AgNP1. No clear oxygen core-loss edge are observed in any of the following cases, (i) when the beam goes through the NPs marked as A and (ii) when the beam goes only through the carbon substrate (marked B). O-K (no) marks the absence of an oxygen peak. .... 145
Figure 5.3. EELs line spectra for AgNP1... 146
Figure 5.4. EELs map spectra for AgNP1. ... 146
Figure 5.5. HAADF-STEM images of AgNP1 left on a TEM grid for 4 weeks showing clear core-shell structures. The amorphous shell is marked by the arrow A, and indicates oxidization. ... 147
Figure 5.6. EELs line spectra for AgNP1 left on a TEM grid for 4 weeks. The oxygen EELS signal can be observed when the beam is incident on the Ag particles (marked A).The signal can also be observed when the beam is only on the carbon substrate (marked B). ... 148
Figure 5.7. Concentrated AgNP1 (12 mg L-1) exposed to sunlight over time. From left to right, as prepared, after 5 days, 2 weeks, 25 days and 1 month. ... 148
Figure 5.8. UV data for AgNP1 exposed to sunlight over time. ... 149
Figure 5.9. DLS data for AgNP1 exposed to sunlight over time. ... 149
Figure 5.10. UV data for AgNP1 as prepared and exposed to sunlight for 25 days. ... 150
xvii
Figure 5.12. EELs line spectra for AgNP1 exposed to sunlight for 24 hours. The spectrum as shown
above was taken from the edge of the particle (marked by a red crossing). ... 151
Figure 5.13. HAADF-STEM images of AgNP1 exposed to sunlight for 25 days. Some particles were found to have non-spherical shapes. We could also find spherical particles, as seen at the bottom right image. ... 152
Figure 5.14. EELs line spectra for AgNP1 exposed to sunlight for 25 days. The point spectrum shown was taken from the edge of the particle (marked by a red crossing). ... 153
Figure 5.15. HAADF-STEM images of AgNP1 exposed to sunlight for 24 hours (left) and 25 days (right)... 153
Figure 5.16. AgNP1 in UHP water exposed to sunlight after a month (left) and fresh (right). ... 154
Figure 5.17. UV data for AgNP1 in UHP water exposed to sunlight over time. ... 154
Figure 5.18. DLS data for AgNP1 in UHP water after being exposed to sunlight over time. ... 155
Figure 5.19. UV-vis spectrum for AgNP1 as prepared compared to the spectrum for AgNP1 in 20 mg L-1 FA exposed to sunlight after 6 months and the dark for the same period of time. ... 156
Figure 5.20. EELs area map spectra for AgNP1 with FA exposed to light for 24 hours. A: Map spectrum for Ag, inside the particle; B: HAADF image for the particle; C: typical fulvic acid molecule; and D: Spectrum showing the oxygen signal coming from the outside of the particle. Results show a coherent intensity distribution between the HAADF and the Ag EELs mapping image and the oxygen EELs image. ... 157
Figure 5.21. HAADF-STEM images of AgNP1 + FA exposed to sunlight for 24 hours (left), and left in the dark (right). Contrast was adjusted to see the shell on the particles. ... 158
Figure 5.22. UV data for AgNP1 in very soft water exposed to sunlight over time. ... 158
Figure 5.23. DLS data for AgNP1 in very soft water, measured when freshly added, after 24 hours and after 4 weeks exposed to sunlight. ... 159
Figure 5.24. UV data for AgNP1 + FA in very soft water exposed to sunlight over time. ... 159
Figure 5.25. DLS data for AgNP1 + FA in very soft water, measured when freshly added, after 24 hours and after 4 weeks exposed to sunlight. ... 160 Figure 5.26. HAADF-STEM images of AgNP1 in very soft synthetic freshwater exposed to sunlight for 4 weeks, without FA (left), and with FA (right).No oxygen signal was measured. A FA shell can be
xviii
seen on the particle on the right (as marked with the red arrow), but the oxygen was not measurable.
... 161
Figure 5.27. EELs line spectra for AgNP1 in very soft synthetic freshwater exposed to sunlight for 4 weeks.The spectrum shown corresponds to the edge of the particle (marked by a red crossing). The systematic investigation performed does not show any oxygen signal. ... 161
Figure 5.28. EELs line spectra for AgNP1 + FA in very soft synthetic freshwater exposed to sunlight for 4 weeks.The spectrum shown corresponds to the edge of the particle (marked by a red crossing). No obvious oxygen signal could be observed. ... 162
Figure 5.29. UV data for AgNP1 in soft water exposed to sunlight over time. ... 163
Figure 5.30. DLS data for AgNP1 in soft water exposed to sunlight over time. ... 163
Figure 5.31. UV data for AgNP1 in soft water kept in the dark for 4 weeks... 164
Figure 5.32. UV data for AgNP1 in soft water kept in the dark and exposed to sunlight for 4 weeks.164 Figure 0.33 Figure 5.33. DLS data for AgNP1 in soft water kept in the dark for 4 weeks. ... 165
Figure 5.34. UV data for AgNP1 + FA in soft water exposed to sunlight over time. ... 165
Figure 5.35. DLS data for AgNP1 + FA in soft water exposed to sunlight over time. ... 166
Figure 5.36. UV data for AgNP1 + FA in soft water kept in the dark for 4 weeks. ... 166
Figure 5.37. UV data for AgNP1 + FA in soft water kept in the dark and exposed to sunlight for 4 weeks. ... 167
Figure 5.38. DLS data for AgNP1 + FA in soft water kept in the dark for 1 month. ... 167
Figure 5.39. AgNP1 in soft water exposed to sunlight. From left ot right: AgNP1 + FA for 12 days, without FA for 12 days, without FA for 5 days and with FA for 5 days. ... 168
Figure 5.40. HAADF-STEM images of AgNP1 in soft synthetic freshwater exposed to sunlight for 24 hours without FA. ... 168
Figure 5.41. EELs line spectra for AgNP1 in soft synthetic freshwater exposed to light for 24 hours. The spectrum shown corresponds to the edge of the particle (marked by a red crossing). No obvious oxygen signal could be observed. ... 169
Figure 5.42. HAADF-STEM images of AgNP1 in soft synthetic freshwater exposed to sunlight for 24 hours with FA. ... 169
xix
Figure 5.43. EELs area oxygen map spectrum for AgNP1 + FA in soft synthetic freshwater exposed to light for 24 hours. We can clearly see an oxygen peak corresponding to the FA shell and a Ag signal coming from the edge of the particle. ... 170 Figure 5.44. Schematic representation of the aggregation process for (a) citrate stabilised NPs and (b) NP + HS dispersions (Diegoli et al. 2008). ... 172 Figure 5.45. Schematic illustration of surface oxidation and dissolution of the oxide layer coated AgNPs (Li et al. 2011). ... 174 Figure 5.46. TEM images of AgNPs after 21 days incubation in different media: a) citrate capped AgNPs in media10 (chloride media), b) citrate capped AgNPs in nitrate media dilute 10 times, c) citrate capped AgNPs in sulphate media diluted 10 times, d) citrate capped AgNPs in nitrate media, e) PVP capped AgNPs in chloride media (media1), and f) PEG capped AgNPs in chloride media (media1) (Tejamaya et al. 2012). ... 175 Figure 5.47. Schematic diagram outlining the possible fate of NPs in the marine environment and the organisms at risk of exposure. From (Klaine et al. 2008). ... 176
xx
List of tables
Chapter 1
Table 1.1 Examples of reactions published where AgNPs with different capping agents were obtained. ... 12 Table 1.2 Toxic effect of Ag NPs to different organisms. ND: not determined. Based on (Fabrega et al. 2011) ... 38
Chapter 2
Table 2.1 Preparation of synthetic freshwater. ... 49 Table 2.2 Preparation of synthetic seawater. ... 50 Table 2.3 Summary of the methods used. ... 82
Chapter 3
Table 3.1. Reactions done to synthesize citrated capped AgNPs. ... 87 Table 3.2. Size distributions for the monodisperse and stable citrate-AgNPs prepared, measured by DLS, TEM, AFM and FFF for the samples as prepared. ... 91 Table 3.3. Concentration of Ag in the different nanoparticles made, in the nanoparticle solution and in the supernatant after ultrafiltration, measured by ICP-MS. ... 96 Table 3.4. Size of nanoparticles measured by DLS over time... 98 Table 3.5. Size distributions for the monodisperse and stable PEG-AgNPs prepared, measured by DLS, TEM, AFM and FFF for the samples as prepared. ... 101 Table 3.6. Size distribution measured by FFF for the different AgNPs- PEG. ... 105 Table 3.7. Size of nanoparticles stabilized by PEG measured by DLS over time. ... 107
Chapter 4
Table 4.1. Electrophoretic mobility for the particles at different dilutions of the media. pH of the solutions was 7.5 (the same as media1). ... 119
xxi
Table 4.2. Size distribution measured by FFF for the different Ag NPs in different dilutions of Daphnia media. ... 121 Table 4.3. Properties of the AgNPs prepared in media1 and media2, measured by TEM. ... 126 Table 4.4. Size distributions for the different AgNPs in media10, measured by TEM and AFM. ... 126 Table 4.5. Rate of sedimentation in media1 and media10, calculated from Stokes' Law, eq. (4.1). . 126 Table 4.6. Acute effect of media dilution on D. magna. ... 127 Table 4.7. Chronic effects of media dilution on D. magna reproduction (over 21-day study). ... 128 Table 4.8. Percentage immobilisation observed 48 h after exposure of D. magna neonates to AgNP3 in media1 and media10.The LC50 of these particles in media10 along with 95% confidence intervals was calculated by the Trimmed Spearman-Karber method. ... 129 Table 4.9. The LC50 values as well as upper and lower 95% confidence intervals of AgNP3 and AgNO3 in media1 and media10.The values were calculated using the Trimmed Spearman-Karber method. The LC50 of AgNPs in Media1 was incalculable. ... 129 Table 4.10. Percentage immobilisation observed 48 h after exposure of D. magna neonates to Silver Nitrate (AgNO3) in media1 and media10. Originally, concentrations of 0.1, 0.25, 0.5, 0.75, 1, 5 and 10 μg L-1 of AgNO3 were used in both types of media, however in media1 no partial death was observed at these concentrations, so further exposures at 1.78, 2.37, 3.16 and 4.22 μg L-1 AgNO3 were done in media1 only in an attempt to characterise the dose-response curve further. ... 130
Chapter 5
xxii
Common abbreviations
AFM Atomic force microscopy
Ag Silver
Ag+ Silver ions, ionic silver
AgNO3 Silver nitrate
AgNPs Silver nanoparticles
ca. from the Latin circa (around, about)
dH Hydrodynamic diameter
dp, dn, dw The peak, number, and weight average hydrodynamic diameters
D. magna Daphnia magna
DLS Dynamic light scattering
DLVO Derjaguin-Landau-Verwey-Overbeek theory
EDX Energy dispersive x-rays
EELs Electron energy loss spectroscopy
EM Electron microscopy
ENMs Engineered nanomaterials
FA Fulvic Acid
FCC Face-centered cubic
FlFFF Flow-Field Flow Fractionation
FFF Fild Flow Fractionation
HAADF High angle annular dark field detector
HA Humic acid
HNO3 Nitric acid
HR- STEM High resolution scanning transmission electron microscopy
HS Humic substances
ICP-MS Inductively coupled plasma mass spectrometry
LC50 Concentration at which particles cause 50% immobilisation
xxiii
NM / NMs Nanomaterial(s)
NOM Natural organic matter
NP/ NPs Nanoparticle(s)
OECD The Organisation for Economic Co-operation and Development
PdI Polydispersity index width
PEG poly(ethylene glycol)
PEG-SH thiolated poly(ethylene glycol)
PVP poly(N-vinyl-2-pyrrolidone)
SPR Surface plasmon resonance
SRFA Suwannee River fulvic acid
STEM Scanning transmission electron microscopy
TEM Transmission Electron Microscopy
1
1
Introduction
1.1 Introduction to nanotechnology and nanoparticles
Nanoscience explores the nature of matter, between atoms and molecules as defined by quantum mechanics, and the condensed matter, as defined by solid state chemistry and physics (Klabunde et al. 2009). It involves the study of how to control the formation of well-defined nanostructures or nanomaterials (NMs), starting from molecular scale building blocks of two- and three-dimensions (Ju-Nam et al. 2008).Important questions arise in nanoscience, from the decrease in the size of a material will make it behave more like an atom or molecule? And how many atoms in a NM will induce bulk-like behaviour? Nanoscience has led to the discovery of surprising material properties that can be very different from those of the bulk, such as an increased surface area and increased reactivity when size is decreased. It has also led to the birth of nanotechnology, that can be defined as the discovery and patenting of new products and processes based on nanostructure control of materials (Hannink et al. 2006).
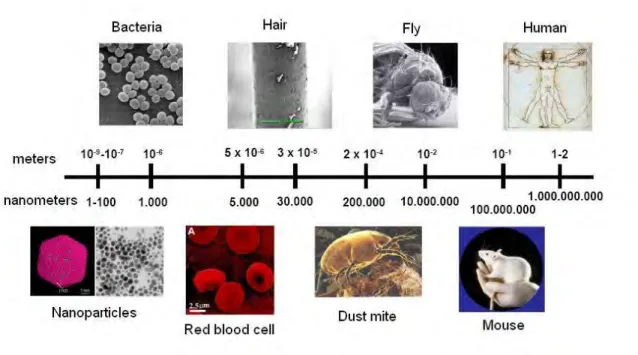
A nanometre (nm) is one thousand millionth of a meter, 10-9 nm. To illustrate this, the size of a human hair ranges between 25000 nm and 180000 nm wide and viruses are around 100 nm in diameter (Figure 1.1). About ten hydrogen atoms in a line make up one nanometre. The size range size from approximately 1 nm to 100 nm has been defined as nanoscale by the Bristish standards Institution (BSI) (BSI 2007).
2
Figure 1.1 Scale in nanometres and meters comparing the size of nanoparticles with different things found in nature. Adapted from (Monge 2008).
Nanoparticles (NPs) are usually defined as the particles that range between 1 and 100nm in size (Hosokawa 2007; Klabunde et al. 2009).BSI has defined nanoparticles as a nano-object with all three external dimensions in the nanoscale (BSI 2007). The European Union has defined the term NM as a natural, incidental or manufactured material containing particles, in an unbound state or as an aggregate or as an agglomerate and where, for 50 % or more of the particles in the number size distribution, one or more external dimensions is in the size range 1 nm-100 nm (EuropeanComission 2011).
Although a variety of terms are used to define NPs and NMs, the nature and type of particle (e.g. size, shape and associated toxicity) can help to determine the terminology (Section 1.2). The sources of NPs are varied, from natural to manufactured, and their impacts will be diverse. These changes in NP effects complicate the terminology and the definitions currently used for NPs. A particle’s dimension must therefore be determined by the individual, prior to NP studies, for future reference.
Some NP properties will be predictable (e.g. specific surface area, reactivity, crystal structure) and others will be unpredictable (e.g. surface plasmon resonance, solubility, photochemistry, surface properties).
Some properties are associated with the bulk material, and are averaged properties, such as resistivity and magnetisation, density and the dielectric constant (Ju-Nam et al. 2008). The production of nanoscale
3
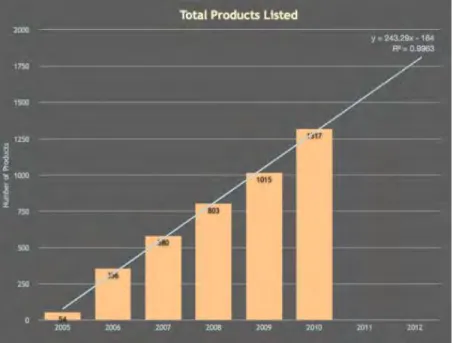
materials has accelerated in the past years due to their properties, including high surface area, small size and large number of surface atoms of the particles; and also due to the technological advances that have allowed us to manipulate matter at this spatial scale. There has also been a rapid increase in the applications of NMs in many areas. NMs have captured the attention of researchers, government, and the industry in a worldwide scale (Ju-Nam et al. 2008). According to the Woodrow Wilson Database, there is a total of 1317 products containing NMs as of March 2011, the number has increased 56% since March 2006 (Woodrow_Wilson_database 2011), see Figure 1.2. Europe has overtaken East Asia as the second greatest contributor of manufacturer-identified nanotechnology-enabled consumer products, the USA being the largest contributor.
Figure 1.2 Number of total products listed, by date of inventory update, with regression analysis, courtesy of (Woodrow_Wilson_database 2011).
In the nanoscale, the properties change (Domínguez-Vera et al. 2007). NPs differ from larger materials in that the number of atoms at the surface and their physical properties are different from those of bulk materials (Poole et al. 2003; Ju-Nam et al. 2008). One of the most important attributes of all NPs is their high surface area per unit mass. The unique physico-chemical properties of NPs that manufacturers seek
4
to exploit, may have unforeseen consequences in terms of ecotoxicity and environmental impact (Colvin 2003) and describing these impacts has become an active focus for regulatory (OECD 2009; PROSPECT 2010; OECD 2010a) as well as peer-reviewed research (Stone et al. 2010) in the past decade.
Metal NPs in general have the advantage of easy preparation and the possibility of chemical modification of the surface by a variety of capping agents (Haick 2007). An important property which metal NPs exhibit is the resonance effect, the surface plasmon resonance (SPR) explained in chapter 2, section 2.3.4, which is caused by the interaction with the incident light and the free electrons in the materials. Aqueous solutions of AgNPs stabilised with citrate are yellow colloidal solutions which present a surface plasmon band (SPB) at 400 nm (Doty et al. 2005; Ju-Nam et al. 2008). Size and shape of nanoparticles can have an effect on the SPR and the colour of the suspension (Huang et al. 2010).
In the past, gold NPs (AuNPs) and silver NPs (AgNPs) were used to stain glass, Figure 1.3 shows the Lycurgus Cup, which dates back to Roman times and is currently at the British Museum, it has gold and silver NPs embedded in glass.
Figure 1.3 Lycurgus Cup that contains silver and gold nanoparticles. When light is shone through the cup it changes colour, from green to red. Source http://news.bbc.co.uk/1/hi/sci/tech/7722620.stm
5
1.2 Type of nanomaterials
Nanomaterials (NMs) currently in commercial production can be grouped into five broad categories, although there is clearly some overlap in classifications:
1. Carbonaceous. Including carbon nanotubes (CNTs), fullerenes and graphene. 2. Metals. Including zerovalent iron (nZVI), silver (AgNPs), gold (AuNPs), etc.
3. Metal oxides. Including zinc oxide (ZnO), titanium dioxide (TiO2) and cerium oxide (CeO2). 4. Nanopolymers. Including polystyrene and polymethylmethacrylate (PMMA).
5. Quantum dots. Including selenides, sulphides, tellurides, zinc, amongst others, including core-shell quantum dots.
These five categories are based on the material that the NMs are made from. However, this does not necessarily reflect their physico-chemistry. Size, shape (i.e. rods, prisms, tubes, and spheres) (Sun et al. 2002; Wiley et al. 2005) and crystal structure are important factors that influence their physical and chemical properties. Capping agents and coating (i.e. core-shell particles, functionalising the surface) can also have an influence on the NMs and its properties. Thus, two particles of the same material but of different size and shape may have different physical and chemical properties, stability and potential uses (Ju-Nam et al. 2008).
Of these five categories, carbonaceous, metals and metal oxides contribute most to current production volumes (Dair et al. 2010) and have a range of uses based on high tensile strength and conductivity (e.g. CNTs) and catalytic activity (TiO2 and CeO2). Two of the most widely used metals and metal oxides in consumer products are AgNPs and TiO2 (see Figure 1.4) (Mueller et al. 2008). Titanium oxide NPs (TiO2 NPs) are produced on a large scale for applications in paints and coatings, they have self-cleaning, antifouling, and antimicrobial properties (NanoScale 2011) due to their improved photocatalytic reactivity because of their small particle size, faster kinetics due to high surface area, better transparency as opacity is decreased with small particle size, enhanced biocidal characteristics due to higher surface area
6
and higher coverage per unit mass due to lower density. They are also used in cosmetics as a UV-absorber, due to their improved UV protection and low opacity.
Applications for TiO2 NPs have not been developed rapidly, even though they have a large specific surface area (as all NMs do), due to their tendency to aggregate very easily forming larger particles. Aggregation can hinder catalyst efficiency. TiO2 NPs are hard to separate and recover during the reaction process from the reactant mixture (Zhao et al. 2011). But because of its photoactivity, it is widely used, sometimes in combination with ZnO, in sunscreens (Klaine et al. 2008).
Figure 1.4 Number of products associated with specific materials (Woodrow_Wilson_database 2011).
7
1.3 Silver nanoparticles
Silver NPs (AgNPs) are the main NP type in use currently (see Figure 1.4) (Henglein et al. 1998)and are used in increasing quantities for industrial applications as they have powerful anti-microbial properties (Sondi et al. 2004). AgNPs are used as antibacterial agent when free or incorporated into coatings, fibres, bandages, dressings, sticking plasters, plastics, soap and textiles, in fabrics or other goods (AmericanElements 2011). They have been widely used in commercial applications in cosmetics and as bacteriocides in fabrics (Ju-Nam et al. 2008).
Silver has been known to be used in wound management, this can be traced back to the 18th century, at this time silver nitrate (AgNO3) was used to treat ulcers (Klasen 2000; Chopra 2007). Silver ions and their antimicrobial activity were identified in the 19th century, and in the 1920s colloidal silver was accepted by the US Food and Drug Administration (FDA) as being an effective treatment for wound management (Hugo et al. 1982; Demling et al. 2001; Chopra 2007). After penicillin was introduced in the 1940s, the use of silver diminished because antibiotics became the standard treatment for bacterial infections. In the 60’s silver became popular again, it was used for the management of burn patients, this time in the form of 0.5% AgNO3 solution (Moyer et al. 1965). It has been demonstrated that, in low concentrations and short contact times, silver is non toxic to human cells (Martinez-Castanon et al. 2008).
Because some bacterial strains have demonstrated recently an increasing resistance toward antibiotics silver has received renewed interest. The powerful antimicrobial activity of silver is known to be effective against nearly 650 types of bacteria (Perelshtein et al. 2008). Reducing the size of materials by using nanoparticles and thus increasing the surface area is an efficient and reliable tool for improving their properties (Kim et al. 2007).
8
The mode of action of AgNPs as antibacterial agents is not understood completely. The antibacterial effect might come from the catalytic oxidation of the NPs by metallic silver and the subsequent reaction with dissolved silver ion (Ag+). Long term release of these silver ions (Ag+) by oxidation of zero-valent metallic silver Ag0 in contact with water might be the end mechanism of products that contain AgNPs (Kumar et al. 2005). It has also been shown that size and shape of NPs will have an influence on their effects and toxicity (Morones et al. 2005; Pal et al. 2007). Small NPs have more antibacterial effect, compared to larger ones. It has also been shown that triangular plates NPs are more efficient antibacterial agents compared with spherical and rod-shaped NPs (Ju-Nam et al. 2008).
1.4 Synthesis of metal nanoparticles
The two most common methods used to manufacture NMs are the top-down bottom-up. Top-down starts with a large structure that becomes smaller through successive cuttings (generally grinding, milling, etc); bottom-up starts from atoms that will react to form a NM (Helland 2004) (See Figure 1.5). It has been the development of advanced measurement and manipulation instrumentation, such as atomic force microscopes (AFM) and transmission electron microscopes (TEM), that has allowed scientists to see and manipulate structures in the nanometre scale.
9
Figure 1.5 Size comparison of nanoparticles with different chemical species. Illustration of the bottom-up and top-down method of synthesis. Adapted from (Monge 2008).
Top-down nanofabrication can be achieved by high-energy milling, chemical mechanical milling, electro-explosion, laser ablation or spluttering. A common top down fabrication technique is nanolithography, which is used to manufacture computer chips. Top-down is useful when making surface imprints that need to be replicated. The disadvantages of this method are that bulky instruments are usually needed; it is also not very useful for single NP production due to the fact that there will be imperfections on the surface of the structure, there will probably be contamination, and the NPs obtained will be polydisperse.
Bottom-up approaches generate NPs from the atomic or molecular level and thus are predominantly chemical processes. Commonly used techniques are crystallisation/precipitation, sol-gel methods,
Metal
nanoparticl
es
10
chemical vapour deposition, gas-phase aggregation and self-assembly routes, such as wet chemistry synthesis (Hannink et al. 2006; Klabunde et al. 2009). This type of approach is cleaner than the top-down method to produce NPs, the NPs obtained will have fewer defects, will have a more homogenous chemical composition, will be closer to thermodynamic equilibrium and will be more monodisperse. Bottom-up synthesis involves chemical reactions, nucleation and growth process as a starting point to induce the formation of more complex NMs (Rotello 2003).
We are interested in obtaining well defined and monodisperse AgNPs, hence we chose to use bottom-up methods in mild conditions. Chemical synthesis of this type of particles consists of dissolving a silver salt in the correct solvent, and then to induce a reduction to the zero valent state. The lifetime of the atomic clusters in the solution is short, and they tend to aggregate (Ju-Nam et al. 2008). By using the appropriate ligand the formation of larger particles can be stopped and aggregation can be avoided. The most common ligands used are sodium citrate (Lee et al. 1982; Henglein et al. 1999; Pillai et al. 2004; Doty et al. 2005; Cumberland and Lead 2009; Römer et al. 2011)and different polymers (PVP, PEG, etc) (Silvert et al. 1996; Hoppe et al. 2006; Christian et al. 2010).
One of the most common synthesis of NPs is the hydrothermal method. This type of synthesis is interesting to us due to its simplicity and mild conditions used. The chemical reduction was first published by Faraday in 1857 (Faraday 1857) and later on improved by Turkevich and colleagues in the 1950s for the preparation of AuNPs (Turkevich et al. 1951). This reaction involves the heating of a solution of chloroauric acid (HAuCl4) to its boiling point, followed by reduction with sodium citrate; the resultant nanoparticles were very uniform with a diameter of 20nm. Other groups further studied this method (Fujita et al. 1962; Berry et al. 1963; Wilenzick et al. 1967; Frens 1973)which by varying the reaction conditions (e.g. the ratio of trisodium citrate to gold salt, temperature, time, etc) were able to achieve a degree of control over the diameter of the resultant nanoparticles (Kumar 2009). This reaction can be used to obtain AgNPs, but yielding more polydisperse, larger and less uniform particles. Table 1.1 shows different reactions that yielded stable AgNPs with different capping agents.
11
We can obtain NPs easily by using a reducing agent, a common strong reducing agent is sodium borohydride (NaBH4) (Glavee et al. 1992), a large number of nuclei are formed when it is used to reduce metal salts and therefore the resulting particles are small (<10nm). In the case AgNPs, a silver nitrate salt (AgNO3) can be reduced by using NaBH4 in the presence of sodium citrate, where the citrate acts only as a capping agent. These particles are electrostatically stabilized (see Figure 1.6, left). Capping agents improve particle stability. When the NP surface is not protected by a molecule the interactions between NPs will occur to reduce their surface energy and will lead to aggregation (Ju-Nam et al. 2008) (discussed in section 1.5.3).
Figure 1.6 An example of electrostatically (a) and sterically (b) stabilized AgNPs. In the case of the citrate capped NPs, the negatively charged citrate caps the positively charged surface of the NP. Based on (Dumur et al. 2011).
12
Table 1.1 Examples of reactions published where AgNPs with different capping agents were obtained. Capping
agent Reaction conditions Size (nm) Shape Other details Reference
Sodium citrate
1mM AgNO3 boiling and 1% sodium citrate. The solution was
kept on boiling for ca.1 h. - - and had absorbed at 420 nm. Solution was greenish yellow (Lee et al. 1982)
The solution contains 1.0 X 10⁻⁴ M AgClO4, 2.5 X10⁻² M N2O,
0.3 M 2-propanol, and citrate in various concentrations (5.0
X10-5 to 1.5 X 10⁻³ M) 10 to 20 Spherical
Well-separated NPs with a narrow size distribution are produced in a narrow range of
citrate concentration, about
(1-5) X 10-4 M
(Henglein et al. 1999) 20 ml of AgNO3 (0.25 mM ) and 0.25 mM trisodium citrate. 0.6
ml of 10 mM NaBH4 was added all at once. Stirring was
stopped after 30 s 4 + 2 Spherical Seed was used after 2 hours
(Jana et al. 2001) A solution of AgNO3 (1.0 X 10⁻³ M) was heated until it began
to boil. Sodium citrate solution was added dropwise to the AgNO3 solution as soon as the boiling commenced and
heated for 15min more.
50-100 crystallites
The color of the solution slowly turned into grayish
yellow
(Pillai et al. 2004) NaBH4 (6 ml, 10 mM), 200 ml of AgNO3 (0.25 mM) and
trisodium citrate (0.25 mM). The reaction was stirred for 30 min.
8.1 + 1.6; 15.3 +
6.4 Spherical yellow colloidal silver (Doty et al. 2005)
100ml sodium citrate (0.31 mM), 100ml AgNO3 (0.25mM) and 6ml NaBH4 (0.25mM). After 10 min of stirring the cold solution, it was was heated slowly to boiling and heated for a further 90
min
13.7± 6.2 Spherical
Solutions were prepared in pure water and kept at 4 ◦C in the dark for 30 min before the
reaction
(Cumberland and Lead 2009)
400 ml of boiling water, 1.690 ml of 58.8 mmol L-1 AgNO3 and
2.920 ml of 34 mmol L-1 sodium citrate stirring, before
dropwise addition of 2.000 ml of 100 mmol L-1 NaBH4 22.5 ± 0.6 (DLS) Spherical -
(MacCuspie et al. 2011)
PVP
3 mL of AgNO3 (0.23-2.3 mM) containing 0.25-1 wt % PVP was placed in a rectangular quartz vessel. The sample was
irradiated by 254 nm UV light at room temperature. 15 to 22 Spherical
The rate of the photoreduction process was observed to
increase with the PVP concentration
(Huang et al. 1996)
PVP (15 and 20 g) in 75 ml ethylene glycol at room
temperature, AgNO3 was added (1 and 3.2 mg). Stirred at room temperature until complete dissolution. The system was
heated to 120°C at a constant rate of 1 oC min, left for 1h at
this temperature.
25 + 6 and 36 + 11 Spherical Known as polyol process (Silvert et al. 1996)
Polyol process (Silvert et al., 1996) changing the PVP to
AgNO3 ratio 50 to 100 Nanocubes
morphology of the product had a strong dependence on
the reaction conditions.
(Sun et al. 2002) 2.9 mM AgNO3 and PVP K15 0.02 M at room temperature
were mixed. After the solution was shaken, samples were heated to the selected reaction temperature (between 25 and
70 °C) and left standing for the reaction to proceed.
18.8 + 3 Spherical were obtained with PVP 10 Different shapes and sizes
and different concentrations.
(Hoppe et al. 2006)
13 Capping
agent Reaction conditions Size (nm) Shape Other details Reference
PVP
10 ml of AgNO3 (1.0 mM) was added dropwise (about 1 drop/second) to 30 ml of NaBH4 (2.0 mM) that had been chilled in an icebath. 0.3% PVP was added to prevent
aggregation.
12 ± 2 Spherical
The solution turned light yellow after the addition of 2
ml of AgNO3 and a brighter yellow when all of it had been
added
(Solomon et al., 2007) Sodium citrate (3.68 ml, 30 mM), PVP (3.68 ml, 2% w/w), and
H2O2 (120 ml, 30% w/w) were added into AgNO3 (43 ml, 0.11 mM) under stirring. After 3 min, 100 mM NaBH4 of 150, 160,
170, 180, 200, 220, 250, 280, 300, 330, 360, or 500 ml was added into each mixture, to synthesize twelve colloids of Ag
NPs. 2.6 + 0.8; 4.6 + 1.1; 9.5 + 3.2; 10.0 + 3.8; 16.1 + 5.4; 18.0 + 6.7; 16.7 + 5.6; 17.1 + 6.2; 19.0 + 5.9; 20.3 + 7.2; 27.0 + 9.7; 29.1 + 9.5 Spherical, rods, triangles, cookie
Solutions turned light yellow, yellow, light orange,
orange red, red, dark red, purple,
purple violet, violet, blue, light blue, and green, respectively
(Huang et al. 2010)
PEG-OH A methanolic solution of PEG-OH (12.5 mg ml -1), 4 ml of dodecanethiol-stabilized Ag NPs in
hexane and the mixture was gently shaken. 5.3 + 1.0 Spherical - (Doty et al.
2005) PEG-NH2 (15 mg mlA methanolic solution of PEG-NH2 -1),1 ml of decanethiol-stabilized
AgNPs in hexane. 5.3 + 1.0 Spherical -
PEG
AgNO3 (400 mg, 2.4 mmol) was dissolved in 50 ml PEG at room temperature. The suspension was stirred at 23 ◦C until dissolution and heated, with a constant rate of 1 ◦C/min, up to
30, 60, 90 and 120 ◦C at successive steps, the reaction was left in the last temp. for 3 h.
4 ± 2; 4 and 20; 10 and 20 (with triangles); polydisperse Spherical and a mix of spheres and triangles 120 ◦C generated spheres,
triangles and pentagons (Popa et al. 2007)
PEG-SH
4 ml of an ethanolic AgNO3 solution (0.0075 M) were mixed with 0.075 g of PEG-SH (under N2) and sonicated. 1.3 mL of
0.09 M NaBH4 in ethanol was added dropwise. The suspension was kept at room temperature for 2 h.
10-20 and 1-5 Spherical Particles were stable in chloride solution (Shkilnyy et al. 2009)
AgNO3 0.3 mol and MPEGSH 590 mg in methanol (50 ml) with a solution of sodium borohydride (0.942 mmol) in 4 ml
methanol. 5.6 + 1.4 Spherical Yield was 49%
(Christian et al. 2010)
14
Small nanoparticles can be used as seeds or nucleation centres for the preparation of nanoparticles with larger sizes and different shapes, giving us better control on the growth of the particle. The seeds act as catalysts for the reduction of silver ion by weaker reducing agents, like ascorbic acid. The stabilization of the particles can occur in many different ways but primarily based on electrostatic repulsion or steric hindrance as with many metal oxides (Figure 1.6) (Ju-Nam et al. 2008).
Poly(N-vinyl-2-pyrrolidone) (PVP) (Hoppe et al. 2006) is a water-soluble polymer that has been used as protecting agent against agglomeration of metal colloids in the well-known polyol process (Silvert et al. 1996; Silvert et al. 1997) to obtain sterically stabilized NPs (see Figure 1.6, right). It has been reported that PVP may serve as a reducing agent (see Figure 1.7) and that by varying the ratio of metal salt to PVP, the size and shape of the nanoparticle can be tuned. The reduction process can be explained by two main reactions:
(1) direct abstraction of hydrogen atoms from the polymer by the metal ion
(2) reduction of the metal precursor by organic macroradicals formed by degradation of PVP
Figure 1.7 Reduction of nanoparticles by using PVP as capping and reducing agent, including some images of the particles obtained (Hoppe et al. 2006).
15
Other common capping agents used to make sterically stabilized nanoparticles are poly(ethylene glycols) (PEG) (Doty et al. 2005), which works better when functionalized by thiol (Fernandez-Lopez et al. 2009; Shkilnyy et al. 2009; Christian et al. 2010) and amine groups (Li et al. 2006). PEG as a capping agent is very widely used in commercial applications because of its solubility in a wide range of solvents (Christian et al. 2010), when using a functionalized group we can obtain particles in an easier way and with additional properties. Other polymers used are poly(ethylene oxide) (PEO) (Rujitanaroj et al. 2007), poly(sodium acrylate) (Hussain et al. 2003), poly(ethylene alcohol) (PEG-OH) (Doty et al. 2005), Poly(vinyl alcohols) (Longenberger et al. 1995), amongst others.
1.4.1 Nucleation and Growth
The shape of the size distribution curve of the nanoparticles synthesized depends largely on the relative rates of two separate processes, nucleation and growth. Nucleation can be defined as the process whereby a discrete particle of a new phase forms in a previously single-phase system, usually a homogeneous solution. Growth can be defined as a process in which additional material deposits on this particle causing it to increase in size (Turkevich et al. 1951).
Figure 1.8 Nucleation process for AgNPs stabilized with citrate, formation of seeds (García-Barrasa et al. 2011).
16
Reduction of metal ion precursors produce Ag seeds (see Figure 1.8) (Pillai et al. 2004). Small Ag clusters are formed through the agglomeration of the seeds; these small clusters further grow into larger clusters (Figure 1.9). The growth is dictated by the presence of a stabilizer or complexing agent (Belloni et al. 1998). When an organic molecule is added at an early stage of cluster growth, covalent linkage or surface capping tends to yield smaller-sized NPs. Even though citrate ions complex strongly during early growth stages, these reactions will yield larger clusters with different shapes and sizes (Pillai et al. 2004).
Figure 1.9 Primary and Secondary Growth Steps in the Formation of Silver Nanoparticles (Pillai et al. 2004).
In the citrate reduction procedure, shown in Figure 1.9, few seeds of Ag NPs are formed in the beginning, and a strong complex with the citrate anions is formed. As citrate is lost from the solution, fewer new seeds are produced. The complex will grow slowly by aggregation and will reach an optimal size, at this stage the layer of citrate, which is very strong and repelling, will prevent further aggregation. Ostwald ripening will induce further growth (Figure 1.10), larger particles grow at the expense of smaller ones (Boistelle et al. 1988; Pillai et al. 2004). Ostwald ripening is defined by equation (1.1) (Boistelle et al. 1988) and explained in Figure 1.10:
17 ̅ ̅
( ) (1.1)
Where ̅ is the average radius of all particles, r0 is the radius of the particle at time zero (often negligible), Dv is the coefficient for volume diffusion, m is molecular weight, is the particle surface tension or surface energy, Cs is the solubility of a large crystal of infinite size, KB is the Boltzmann constant, T is absolute temperature, is density, t is time and to is time zero.
Figure 1.10 Schematic representation of the solute transfer from the smallest to the largest crystal during Ostwald ripening. The crystals are separated by the distance X and their concentration spheres interact with the cross section A. Since they are not of infinite size and since equilibrium must be achieved, the crystals must (slightly) dissolve in order to restore the proper concentrations. When the distance X between the crystals is not too large, the two concentration spheres intersect with a cross section of area A (Boistelle et al. 1988).
As the smaller particles are oxidized, the Ag+ ions readsorb on the larger silver crystallites and undergo reduction at the metal surface. Such a reduction of Ag+ ions at the silver surface is facilitated by the decrease in the reduction potential at the metal surface compared to the bulk solution. Greater reaction time (refluxing time) is needed to achieve almost complete reduction in a citrate reduction method (Pillai et al. 2004).
18
The particles formed at lower citrate concentrations have many imperfections and often consist of several crystallites. At a very high citrate concentration, large lumps often are formed because of the coalescence of destabilized particles (Henglein et al. 1998).
1.5 Nanoparticle characteristics and properties
Nanoparticles can have very different characteristics, like different core material, size, shape, crystal shape or amorphous structure, have different coatings or surface chemistry (Hassellöv et al. 2009), like seen in Table 1.1. Coatings and surface chemistry are parameters that can control particle behaviour and their stability in different media (Tejamaya et al. 2012). Figure 1.11 shows the complexity of NPs, showing their different properties, which will have an influence in their stability and toxicity. A multi-method approach, combining sophisticated multi-methods, like field flow fractionation (FFF), inductively coupled plasma mass spectrometry (ICP-MS) and transmission electron microscopy (TEM), is the best a