Forest Fire Pattern Extraction and Rule Generation using Sliding Window
Technique
Ku Ruhana Ku-Mahamud
a, Khor Jia Yun
b aCollege of Arts and SciencesUniversiti Utara Malaysia, 06010 Sintok, Kedah, Malaysia Tel: 604-9284717, Fax: 604-9284753
E-mail: [email protected]
bIntel Technology Sdn. Bhd.
Kulim Hi-Tech Park, 09000 Kulim, Kedah, Malaysia Tel: 604-4336939
E-mail: [email protected]
ABSTRACT
The sliding window technique is being used to extract patterns of forest fire which consists of burnt area size, temperature, relative humidity, wind speed and rainfall. The initial data is being transformed by changing the continuous values of the attributes into categorical value. Extracted patterns are then being grouped based on the size of burnt are. Rules are then generated by transforming the categorical values into intervals and the merging different records into the same rules. The rule generation stage produces eight distinct patterns of meteorological conditions that could predict the size of forest fire.
Keyword:
Pattern Extraction, Sliding Window, Forest Fire
1.0 INTRODUCTION
Forest fire plays a crucial role in shaping forest ecosystems all over the world. In Mountain Ash forests in Australia, for example, the regeneration of the ecosystems depends on fire. There is increasing evidence to show that the link between climate change and El Nino phenomenon is causing an escalation in number and size of forest fire. According to new evidence from Amazon, tropical forests that have experienced burning before would be more susceptible to future burning. Thus, there is an increased possibility that wildfire episodes will occur more frequently, and in the magnitude not endurable by the tropical forest ecosystem. Scientists believed that the entire Amazon would be threatened, and this will affect the biodiversity and climate change globally (Rowell & Moore, 2000). A severe drought throughout Siberian Peninsular in 2005 caused massive fire in northern and central Portugal, destroying more than 150 000 ha land and killing 15 people (Voigt et al., 2007).
Fire, being a chemical reaction, needs heat, oxygen, and fuel for ignition and spread. Forest fire happens when an uncontrollable fire starts and spreads itself to natural vegetation, thus the ignition cause and environmental conditions affects the probability of occurrence. Influential
factors of forest fire are like fuel’s distribution and quality, weather, topography and human factors (Orozco, 2008). In addition, fires are easily ignited during draught seasons.
Forest fire prediction model developed by Umamaheshwaran et al. (2007) used satellite images by applying image mining techniques. Laneve and Cadau (2007) assessed the quality of fire hazard prediction model based on Fire Potential Index and using SEVIRI/MSG satellite images. Meanwhile, it is well known that weather conditions and fire risks are related, and weather conditions are a crucial factor which determines whether wildfire would occur, and how far it will spread (Wells et al., 2007). A recent statistical survey indicated that weather and forest Fire Weather Index (FWI) components are highly influential in forest fires in Portugal (Carvalho et al., 2008).
Since 2000, prediction of forest fire using satellite has begun. The use of satellite images in fire prediction and detection could be seen in the literature from Umamaheshwaran et al. (2007), and Laneve and Cadau (2007). Predicting natural hazards by using satellite images would give analyst almost real-time data but the atmospheric interference (clouds, haze and smoke) cause distortion in the retrieved images (Gillespie et al., 2007). Besides that, spatial satellite images have low resolution. In addition, using satellites require high equipment and maintenance costs (Cortez & Morais, 2007).
Earlier studies have shown that weather and forest Fire Weather Index (FWI) components have significant influence on forest fire (Cortez & Morais, 2007; Carvalho et al., 2008). Cortez and Morais (2007) have concluded in their studies that further research is needed to confirm that direct weather conditions (i.e. temperature, rain, relative humidity and wind speed) are preferable over accumulated values in predicting forest fire behaviour.
Cortez and Morais (2007) explored five data mining (DM) approaches to predict the burned area of forest fires. Multiple Regression, Decision Tree, Random Forest, Neural Network and Support Vector Machines (SVM) were carried out on data consisting of spatial, temporal, meteorological
and forest Fire Weather Index (FWI) data from Montesinho Natural Park in northern region of Portugal. The results indicated that predicting forest fire using meteorological data (i.e. rain, wind, temperature and humidity) and SVM gives the best performance amongst the other four DM techniques. However, the proposed solution achieved a lower predictive accuracy for large fires. Thus, further exploratory research is required for predicting burn forest area by using only meteorological data
.
Predicting natural hazards using satellites has begun in 2000, and it has changed the way natural disasters are being assessed (Gillespie et al. 2007). However, the variables provided by radar sensors are affected by a significant amount of noise. In addition, there are limitations like interference of atmosphere (clouds, haze and smoke), pixel resolution, and revisit times which cause distortions of the satellite images.
Data mining can be used to discover interesting salinity and temperature patterns and the patterns can be used to predict future events (Huang et al., 2008). By using association rules mining spatial-temporal patterns revealing the salinity and temperature variations can be discovered. Furthermore to evaluate the rules generated that have antecedent and consequent, an important measurement is proposed. The proposed process of mining association rules consists of several steps: transforming quantitative attributes, discovering frequent inter-transaction itemsets, generating association rules, and identifying insight association rules. During the frequent inter-transaction itemset discovery, sliding window technique is used so that during analysis only rules within the window would be considered and thus minimizing effort in mining uninteresting rules. The proposed method could generate rules about salinity and temperature patterns but the research did not evaluate the performance of the proposed important measurement.
This research has investigated patterns of weather in relation to the size of forest fire. The patterns are then classified and rules that can be used for decision making are formulated. Section 2 presents the research approach while Section 3 describes the extraction of the forest fire patterns. The rule generating activity is explained in Section 4 and concluding remarks are presented in Section 5.
2.0 RESEARCH APPROACH
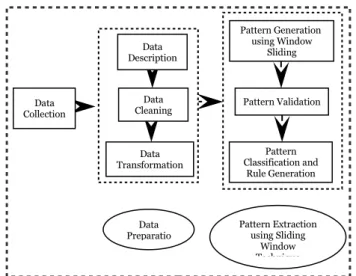
Figure 1 depicts the approach that has been used in conducting the research. The sliding window technique used by Huang et al. (2008) in their study to discover rules of ocean salinity and temperature variations has been adopted and adapted in this study.
Figure 1: Research approach
Forest fire data have been collected from UCI Machine Learning Repository and Cortez and Morais (2007) which consist of forest fire and meteorological information. In the data preparation stage, the attributes are described, records with missing values were removed or missing values were replaced with estimated values, or ignore the missing values during analysis. After the cleaning stage, transforming data by performing discretization to change the data type from continuous to categorical is a significant task in data mining process. A suitable discretization technique used can potentially improve the performance of the data mining technique significantly. Pattern extraction and rule generation using the sliding window technique are performed after the data preparation stage.
The data contain forest fire occurrence and forest fire weather index (FWI) components in Montesinho Natural Park, located in northern Portugal region, from 2000 until 2003. The data was integrated with weather observations (wind speed, temperature, relative humidity and rainfall) obtained from Braganca Polytechnic Institute. The occurrences of forest fires were within the Montesinho Natural Park. The park is being divided into eight distinct X and Y location by placing a 9x9 grid on the map (refer to Figure. 2). There is a total of 81 combinations of X and Y used in this study. The forest fire data consist of 517 where 270 records or 52% of the data consists of forest fire occurrences with burnt area more than or equals to 0.01ha and the other 247 instances or 48% of the data contains forest fire occurrences with burnt area less than 0.01ha. There are 5 attributes namely temperature, relative humidity (RH), wind speed, rainfall and the burnt size that have been included in this study.
Data Transformation Data Preparatio Data Collection Data Description Data Cleaning Pattern Classification and Rule Generation Pattern Extraction using Sliding Window Technique Pattern Generation using Window Sliding Pattern Validation
Figure 2: Map of Montesinho Natural Park (Cortez & Morais, 2007)
3.0 FOREST FIRE PATTERN EXTRACTION
The data used in this study does not consist of any missing values. The attributes temperature, relative humidity, wind speed and rain are being transformed into categorical values by using the ranges applied by practitioners as presented in Tables 1 through 4.
Table 1:Categorization of temperature
Temp (T)
(Celcius) Description Code
0≤T≤7 Very cold C1 7<T≤14 Cool C2 14<T≤21 Mild M 21<T≤28 Warm W 28<T≤35 Hot H T>35 Extremely hot E
Table 2: Relative humidity categorization
Relative Humidity (RH) (%) Description Code RH<50 Low L 50≤RH≤80 High H RH>80 Very high V
Table 3: Wind speed categorization
Wind speed (WS) (km/hr) Description Code WS<1 Calm L 1≤WS<6 Light air LA 6≤WS<12 Light breeze LB 12≤WS<20 Gentle breeze GB 20≤WS<29 Moderate breeze MB 29≤WS<39 Fresh breeze FB 30≤WS<50 Strong breeze SB 50≤WS<62 Moderate gale MG 62≤WS<75 Fresh gale FG 75≤WS<89 Strong gale SG 89≤WS<103 Whole gale WG 103≤WS≤117 Storm S WS>117 Hurricane H
Table 4: Rainfall categorization
Rainfall (R) (mm/hr) Description Code R<0.25 Very light VL 0.25≤R<1.0 Light L 1.0≤R<4.0 Moderate M 4.0≤R<16.0 Heavy H 16.0≤R≤50. 0 Very heavy VH R>50.0 Extreme E
Temperature has been presented six categories while relative humidity takes only three categories. There are thirteen categories representing wind speed and six categories are used for rainfall.
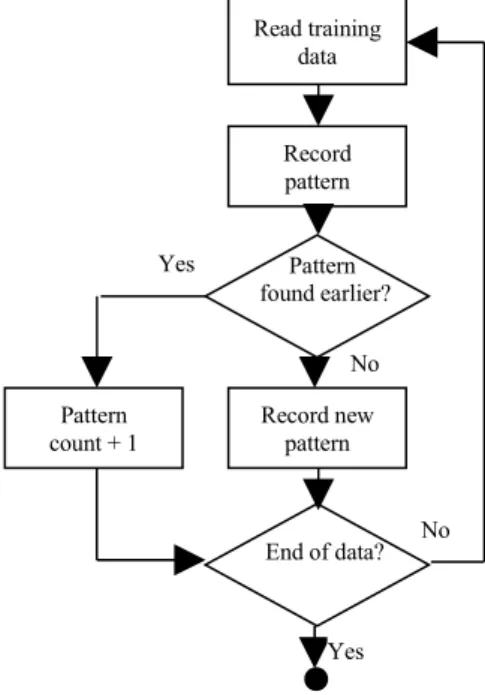
The data was divided into the training and testing sets. 80% of the data or 414 records were allocated for the training and the remaining 20% (103 records) for validation. Figure 3 depicts the process of extracting patterns using the sliding window technique. Window of size 1 is used in this study to detect all the patterns that exist in the training set. A total of 32 forest fire patterns have been obtained in this stage (refer Table 5).
Figure 3: Process flow for extracting patterns
End of data? Pattern found earlier? Yes Read training data Record pattern Record new pattern Pattern count + 1 Yes No No
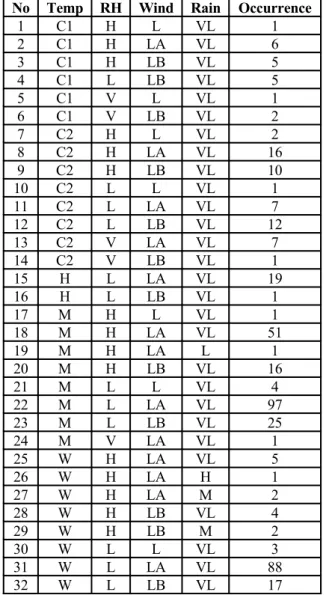
Table 5: Patterns obtained from pattern generation
No Temp RH Wind Rain Occurrence
1 C1 H L VL 1 2 C1 H LA VL 6 3 C1 H LB VL 5 4 C1 L LB VL 5 5 C1 V L VL 1 6 C1 V LB VL 2 7 C2 H L VL 2 8 C2 H LA VL 16 9 C2 H LB VL 10 10 C2 L L VL 1 11 C2 L LA VL 7 12 C2 L LB VL 12 13 C2 V LA VL 7 14 C2 V LB VL 1 15 H L LA VL 19 16 H L LB VL 1 17 M H L VL 1 18 M H LA VL 51 19 M H LA L 1 20 M H LB VL 16 21 M L L VL 4 22 M L LA VL 97 23 M L LB VL 25 24 M V LA VL 1 25 W H LA VL 5 26 W H LA H 1 27 W H LA M 2 28 W H LB VL 4 29 W H LB M 2 30 W L L VL 3 31 W L LA VL 88 32 W L LB VL 17
All the 32 patterns obtained from the training data were validated using the validation dataset. If a pattern correctly predicts the fire size the pattern is given a count for “True Positive”. Otherwise, the pattern is given a count for “True Negative”. The percentage of accuracy for each pattern is calculated by taking the total number of “True Positive” to be divided by the total number of validation against a pattern. A total of 18 patterns (56%) have been validated while the remaining 14 patterns (44%) could not be validated as the patterns were not found in the validation data. However, this does not affect the results as the total occurrences of each of these 14 patterns are small. Most of them (8 patterns) have only 1 occurrence, while 4 patterns have 2 occurrences, 1 pattern have 4 occurrences and 1 have 5 occurrences (see Table 5). The 18 patterns that have been validated have high occurrences. All the patterns that have been validated are summarized in Table 6. Each pattern is given an ID to simplify the process of eliminating patterns, classifying patterns and generating rules.
Table 6: Validated patterns
ID Pattern No. of true positive No. of true negative Accuracy (%) 1. C1/H/LA/VL 0 1 0 2. C1/H/LB/VL 1 0 100 3. C2/H/LA/VL 2 1 67 4. C2/H/LB/VL 2 1 67 5. C2/L/LA/VL 4 0 100 6. C2/L/LB/VL 4 0 100 7. C2/V/LA/VL 0 1 0 8. H/L/LA/VL 5 0 100 9. M/H/LA/VL 7 0 100 10 . M/H/LB/VL 3 2 60 11 . M/L/LA/VL 18 0 100 12 . M/L/LB/VL 6 1 86 13 . M/V/LA/VL 1 0 100 14 . W/H/LA/VL 1 2 33 15. W/H/LB/VL 1 0 100 16 . W/L/L/VL 1 0 100 17 . W/L/LA/VL 31 0 100 18 . W/L/LB/VL 5 1 83
Table 6 shows that out of the 18 patterns, three patterns have less than 50% accuracy (pattern ID 1, 7 and 33). Only 15 patterns were used in the classification and rule generation processes. In the pattern classification stage, the patterns were grouped according to size of burnt area (refer Table 7).
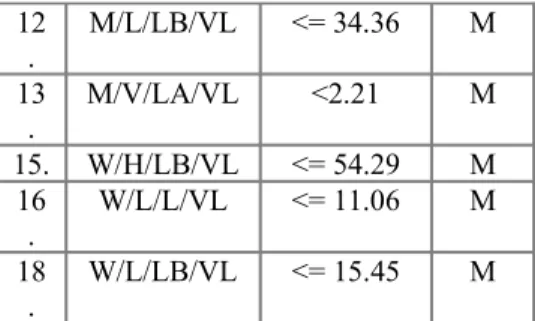
Table 7: Classification of patterns
ID Pattern Burnt
size (ha) Class
17 . W/L/LA/VL <= 1090.84 L 2. C1/H/LB/VL <= 11.19 M 3. C2/H/LA/VL <= 37.02 M 4. C2/H/LB/VL <= 11.24 M 5. C2/L/LA/VL <= 8.31 M 6. C2/L/LB/VL <= 61.13 M 8. H/L/LA/VL <= 64.1 M 9. M/H/LA/VL <= 82.75 M 10 . M/H/LB/VL <= 7.31 M 11 . M/L/LA/VL <= 212.88 M
12 . M/L/LB/VL <= 34.36 M 13 . M/V/LA/VL <2.21 M 15. W/H/LB/VL <= 54.29 M 16 . W/L/L/VL <= 11.06 M 18 . W/L/LB/VL <= 15.45 M
There are 14 patterns under the target class “M” representing medium sized fire (1-500ha), and 1 pattern under target class “L” representing large sized fire (>500ha). There is no pattern associated with target class “S” representing small sized fire (<1ha).
4.0 RULE GENERATION
In the rule generation stage, the patterns that are being extracted and classified are translated into rules that can be used for predicting fire behaviour according to burnt area size. First, the categorical values for the four attributes are converted into their interval representations (refer Table 8).
Table 8: Classified Patterns
ID Temp RH Wind
Speed Rainfall Class
17 . 21-28 <50% 1-5 <0.25 L 2. 0-7 50-80% 6-11 <0.25 M 3. 7-14 50-80% 1-5 <0.25 M 4. 7-14 50-80% 6-11 <0.25 M 5. 7-14 <50% 1-5 <0.25 M 6. 7-14 <50% 6-11 <0.25 M 8. 28-35 <50% 1-5 <0.25 M 9. 14-21 50-80% 1-5 <0.25 M 10 . 14-21 50-80% 6-11 <0.25 M 11 . 14-21 <50% 1-5 <0.25 M 12 . 14-21 <50% 6-11 <0.25 M 13 . 14-21 >80% 1-5 <0.25 M 15. 21-28 50-80% 6-11 <0.25 M 16 . 21-28 <50% <1 <0.25 M 18 . 21-28 <50% 6-11 <0.25 M
From the interval representation, it can be seen that there are some intervals from two different patterns that could be merged into one. Patterns with ID 3 and 4 have similar values for the attributes except for the wind speed. It is apparent that these two records can be merged together.
Similar merging can be performed to patterns with ID numbered 5 and 6. Thus, patterns with ID 3, 4, 5 and 6 are merged to form one rule. Merging patterns with ID 9, 10, 11 and 12 will produce another rule. As a result of merging, 8 rules are generated as depicted in Table 9.
Table 9: Generated rules
ID Temp RH
(%) SpeedWind Rainfall Class
17. 21-28 0-50 1-5 <0.25 L 2. 0-7 50-80 6-11 <0.25 M 3,4,5,6 7-14 0-80 1-11 <0.25 M 8. 28-35 0-50 1-5 <0.25 M 9,10,11,1 2 14-21 0-80 1-11 <0.25 M 13. 14-21 >80 1-5 <0.25 M 15,18 21-28 0-80 6-11 <0.25 M 16. 21-28 0-50 <1 <0.25 M
The first rule can be interpreted as, “when the temperature is between 21 and 28 degrees Celsius, relative humidity between 0 and 50 percent, wind speed between 1 and 5 km/hr and minimal rainfall of less than 0.25 mm/hr, the predicted forest fire size will be large, i.e. more than 500 hectare”. From the patterns, it is apparent that whenever there is forest fire, the rainfall must be minimal or none. In all the patterns observed, the rainfall is below 0.25 mm/hour. Besides that, the first rule generated from the pattern with ID 17 has very high occurrence (refer Table 5, record 31) and the validation shows that this pattern is highly related to forest fire behaviour, and could cause large fire. Another pattern highly related to forest fire behaviour (refer Table 5, record 22) is the pattern with ID 11 which is later being used to form the 5th rule. It can also be concluded that high
temperature is significant to forest fire because out of the eight rules, six of them shows that the temperature is from the range of 14 to 35 degrees Celsius.
5.0 CONCLUSION
Patterns that relate the size of the forest fire and meteorological attributes namely temperature, relative humidity, wind speed and rainfall were obtained using the sliding window technique. These patterns showed that different combinations of the four meteorological conditions will affect the size of forest fires. The rules generated from the obtained patterns can be used to identify the size of burning area of forest fire. By knowing the behaviour of a potential fire, the decision maker can plan for the management of the fire more effectively. Effective prediction of forest fire could increase the efficiency in fire management, thus saving lives and natural resources.
Carvalho, A., Flannigan, M. D., Logan, K., Miranda, A. I., & Borrego, C. (2008). Fire activity in Portugal and its relationship to weather and the Canadian Fire Weather Index System. International Journal of Wildland Fire,
17, 328-338.
Cortez, P. & Morais, A. (2007). A data mining approach to predict forest fires using meteorological Data.
Proceedings of the 13th Portugese Conference on Artificial Intelligence, 512-523.
Gillespie, T., Chu, J., Frankenberg, E. & Thomas, D. (2007). Assessment and prediction of natural hazards from satellite imagery. Progress in Physical Geography, 31(5), 459-470.
Huang, Y. P., Kao, L. J. & Sandnes F. E. (2008). Identifying insightful salinity and temperature variations in ocean data. Proceedings of the 8th IEEE International Conference on Computer and Information Technology, 191-196.
Laneve, G. & Cadau, E. G. (2007). Quality assessment of the fire hazard forecast based on a fire potential index for the Mediterranean area by using a MSG/SEVIRI based fire detection system. Proceedings of the IEEE International Geoscience and Remote Sensing Symposium, 2447-2450.
Li, H. F., Ho, C. C., Kuo, F. F. & Lee S. Y. (2006). A new algorithm for maintaining closed frequent itemsets in data streams by incremental updates. Proceedings of the Sixth IEEE International Conference on Data Mining Workshops, 672-676.
Orozco, S., J. (2008). Forest fire risk model for Michoacan, Mexico. Unpublished M.Sc. thesis, International Institute for Geo-Information Science and Earth Observation, Enschede, The Netherlands.
Rowell, A. & Moore, D. P. F. (2000). Global review of forest fires. International Union for Conservation of Nature and Natural Resources.
Umamaheshwaran, R., Bijker, W., & Stein, A. (2007). Image mining for modeling of forest fires from meteosat Images, IEEE Transactions on Geoscience and Remote Sensing, 45(1), 256-253
Voight, S., Kemper, T., Riedlinger, T., Kiefl, R., Scholte, K., & Mehl, H. (2007). Satellite image analysis for disaster and crisis-management support. IEEE Transactions on Geoscience and Remote Sensing, 45(6), 1520-1528.
Wells, G., Rohling, K., Kapus, J., & Swedberg, T. (2007). The fire-climate connection. Fire Science Digest: Research Supporting Sound Decisions.