Variables Predicting Video Development
Process in Teacher Training
Mehmet Şahin Solak[1], Kevser Hava[2], Can Meşe[3]
http://dx.doi.org/10.17220/mojet.2019.02.007
[1] [email protected], Siirt University, TURKEY.
[2] [email protected], Yozgat Bozok University, TURKEY.
[3] [email protected], Yozgat Bozok University, TURKEY.
ABSTRACT
For pre‐service teachers, it is very important to use digital technology effectively and productively during their teacher training and in the educational institutions that they will work in the future. In this context, video development process is an effective learning environment in improving digital skills of students and acquisition of new skills by them. The present study aimed to determine the factors that predict the use of video development activity in instruction process. Freshmen pre‐service teachers attending different departments participated into the study. During a three‐week application period, students developed videos on subjects related to social responsibility. In the study, which was patterned as a single group experimental design, video development score was determined as the predicted variable while emotion, motivation, personal innovativeness, and self‐efficacy beliefs on educational internet use were determined as predicting variables. In the present study, multivariate regression analysis findings demonstrated that, among these predicting variables, only the emotion variable was a significant predictor of the video development score.
Keywords: Multimedia design, video development process, regression
analysis, teacher training, emotion.
INTRODUCTION
In recent years, learning environment has been redesigned and reorganized to train individuals who can adopt innovations, utilize technologies efficiently, take individual responsibilities, research, inquire and produce. Thus, several technological tools such as whiteboards, smart boards, computers, projection devices are included in the instruction process (Yanpar Yelken, 2017). Today, information and communication technologies are utilized by both teachers and students for many purposes such as audio and video recording, sending SMS, internet access, chatting, and watching videos (Kasumuni, 2011; Traxler & Kukulska‐Hulme, 2005). According to the theory of multimedia learning, instructional content is communicated to learners through various technological instruments and media types such as manuscripts (texts, words), visuals (pictures, images, and illustrations), audio (narration, sounds, voice, spoken), videos and animations (Mayer, 2009). Being one of these media types, videos allow both visual and verbal presentation of information. There are many studies in the literature indicating that videos are an effective method in increasing student motivation and ensuring permanent learning (Hakkarainen, 2009; Kılıç & Çelik, 2014; Kılınç, Fırat & Yüzer, 2017; Mayer, 2009).
2010; Odabaşı et al., 2012). Owing to the fact that mobile technologies are more commonly used, the need for special tools and studios to develop video is reduced, and individuals are now able to produce and share digital videos in an easier way (Tiernan, 2013). Web applications such as YouTube and DailyMotion make it possible for students to develop videos and publish them on digital media. Thus, students can create new content on an online video development medium using several multimedia elements such as audio and visual animation. Similarly, in Turkey, the curriculum of Information Technology and Software Course taught at the 6th grade includes a unit about producing digital products (MEB, 2017). This unit aims students to recognize video‐production tools and create digital videos. The video development activity is considered as an effective method in creating various instructional contents in learning environments where pre‐service teachers will work in the future. For, it is considered to be an important way to use an active method including videos in developing an instructional content. Likewise, structuring the information based on personal perspective is regarded to be more useful when compared to instructing literal knowledge. However, according to Hobbs (1998), there are practical barriers to video or multimedia production such as hardware support, limitation of course periods, personal requirements and teacher training. Certain measures can be taken to overcome these difficulties. But, it is important to determine the factors that affect video development process with respect to students in instruction process. Therefore, it is believed that findings of the present study will guide instructors who use video development activities in the instruction process since it aims to investigate the factors affecting development of video products by pre‐service teachers.
Literature Review
Video Development Process
Digital video is generally defined as the video that can be stored, edited and digitally recorded on electronic media (BECTA, 2003). Considering their potential for easy production and use by both students and teachers in instructional process, active use and design of digital videos in learning practices is significant for increasing the effectiveness of instruction process (Kılıç & Çelik, 2014). Digital video can be considered as a metacognitive instrument that helps learners to observe and analyze self‐performances and reflect their learning (Schuck & Kearney, 2006), as well as a communication tool that facilitates the interaction between learner and teacher (Moore, 1989). According to the findings of a study conducted by Orús et al. (2016) on the digital videos produced by students, it was found that the use of YouTube as an educational tool and the content created by learners contributed positively to the learning outcomes and satisfaction level of students. In a similar study conducted by Greene & Crespi (2012), students were asked to produce videos as a part of classroom evaluation. According to the findings, the students enjoyed video experience and found it both interesting and entertaining. On the other hand, in recent studies, it has been observed that studies on video development by students focus on English language instruction (Bradley & Cole, 2016; Hafner & Miller, 2011; Ting, 2013). For example, a study by Ting (2013) demonstrated that video production was influential on integration of language learning with computer skills. Likewise, Baran, Canbazoğlu‐Bilici & Mesutoğlu (2015) stated that video‐development activities could be used for purposes such as assignments, project development and product promotion in computer courses. Schuck and Kearney (2006) also concluded that the video development process was an entertaining activity. Similarly, Norton and Hathaway (2010) stated that this activity could be an important method for use at the secondary level education and had positive effects on students' motivation and learning performances.
Innovation
(2003). According to this theory, the innovativeness of individuals changes depending on their acceptance of technologies.
Motivation and Emotion
The concept of motivation, which reflects the performance put forth to achieve a specific purpose or complete a specific task (Keller & Deimann, 2012), is frequently observed in studies on learning and teaching. It has been reported in the literature that motivation is a significant factor in the acquisition of specific skills by students and that the concept of motivation influences academic achievement either directly or indirectly (Balantekin & Bilgin, 2017; Dinçer & Doğanay, 2016). Thus, the introduction of a subject after a certain period of time is considered as an important factor that can be affected by motivation variable. Furthermore, similar to motivation, the concept of emotion has been a significant topic in educational research for a long period of time (Leutner, 2014). The emotional factor can be considered as a variable that facilitates the motivation of individuals (Gendolla, 2017). For example, a study by Staus & Falk (2017) found that the emotion factor was one of the predictors of short‐term learning in a video‐assisted learning environment. Similarly, in certain studies in the literature, it was reported that academic achievement was correlated with emotion (Pekrun et al., 2011). Considering the fact that the process of learning with multimedia is influenced by emotional and motivational factors (Leutner, 2014), it is important to examine the emotional and motivational status of students in video development process.
Educational Internet Use Self‐Efficacy
In addition to the emotional status of individuals, their self‐efficacy perceptions are also significant in completing an activity successfully. The concept of self‐efficacy is defined by Bandura (1986) as judgments of individuals on their ability to organize and perform the activities, which would facilitate their achievements in a particular objective. In general, self‐efficacy can be described as beliefs and judgments that affect the problem‐solving ability and performance of an individual in an activity. It is considered that individuals’ self‐ efficacy in internet use of is also effective on video development activities. It was previously mentioned that self‐efficacy in using internet had an impact on the effective use of Web 2.0 tools. In fact, a study conducted by Liaw (2002) demonstrated that internet self‐efficacy of college students positively affected their learning performances. It is believed that self‐efficacy significantly contributes to overcome students’ anxiety and stress that they experience during video development activities with Web 2.0 tools (Kaya, 2009; Yeşilyaprak, 2018). Likewise, certain studies demonstrated that students with low Internet self‐efficacy had a low level of participation in online systems due to their lack of confidence (Livingstone & Helsper, 2010; Shi, Chen & Tian, 2011). Furthermore, in a different study by Tsai and Tsai (2003), it was found that students with high internet use self‐efficacy performed better in web‐based learning when compared to those with low self‐efficacy. Thus, it is considered that self‐efficacy in internet use could be an effective variable on video development process, as well. It is important to create adequate environments where individuals could acquire and use knowledge with a perception of innovation. For, the opportunity provided for students to organize self‐ knowledge by integrating multimedia elements and exhibiting their knowledge as a product during video development process could facilitate the achievement of meaningful learning. However, since video development process using Web 2.0 technologies is considered as a new concept, it is found that the number of studies on students’ video content development are limited (Orús et al., 2016).
In this context, the present study aims to determine the effects of students’ motivation levels, personal innovativeness perceptions, self‐efficacies in educational internet use, and other emotional variables on their performance of developing a video product. Thus, the research question mainly focuses on "What are the variables that predict video development scores of students?"
R
ESEARCHM
ETHODSResearch Model
Since participants were not aimed to share different experiences in the application, and the study did not seek to compare these experiences, all participants experienced the same experimental process. Thus, a group that experienced a video development process was established and the study aimed to determine the variables that affect the video development products produced by this group. As a result, the study was designed with a single group experimental design (Fraenkel, Wallen & Hyun, 2012). The study was conducted with first‐year undergraduates in Computer II course during spring semester. Two educators participated into the application phase.
Participants
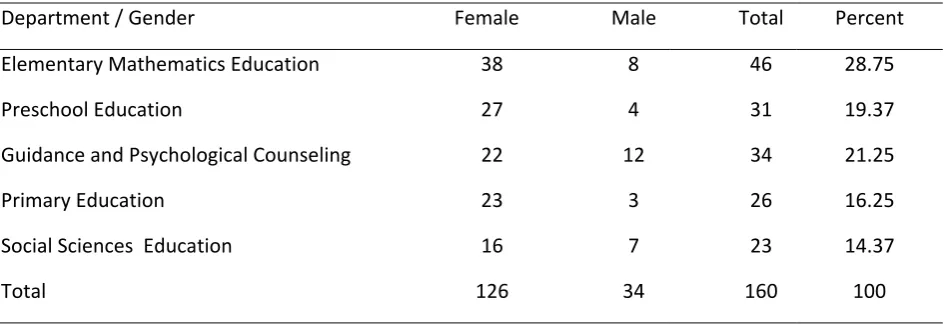
Freshmen pre‐service teachers from different departments in the faculty of education at a Turkish public university participated in the study. Demographic information about the participants is presented in Table 1. As seen in Table 1, the participants were students at the departments of Preschool, Elementary Mathematics Education, Guidance and Psychological Counseling, Primary, and Social Sciences Education. Participants’ gender was distributed as 21.3% male and 78.8% female in the study.
Table 1. Participants’ Demographics
Department / Gender Female Male Total Percent
Elementary Mathematics Education 38 8 46 28.75
Preschool Education 27 4 31 19.37
Guidance and Psychological Counseling 22 12 34 21.25
Primary Education 23 3 26 16.25
Social Sciences Education 16 7 23 14.37
Total 126 34 160 100
Data Collection Tool
Four different data collection instruments were used in the study. These are personal innovativeness scale, educational internet use self‐efficacy beliefs scale, motivation survey and educational video production assessment rubric.
Personal Innovativeness Scale
The Personal Innovativeness Scale was originally developed by Hurt, Joseph & Cook (1977) and adapted to Turkish by Kılıçer & Odabaşı (2010). The five‐point Likert‐type scale includes four factors and 20 items. Eigen value of the scale is 3.334, 2.72, 2.59, and 1.85 and explained variation is 16.68, 13.66, 12.97, and 9.27 for sub‐factors respectively. The total explained variance variation of the scale is 52.51. The reliability coefficient for the scale is 0.82 and the reliability coefficient for the scale factors was calculated to be 0.62 for "Risk taking" dimension, 0.73 for “Opinion Leadership” dimension, 0.77 for “Openness to experience” dimension, and 0.81 for “Resistance to change” dimension. This scale was administered to the participants before the application process.
Educational Internet Use Self‐Efficacy Beliefs Scale
The Educational Internet Use Self‐Efficacy Scale was developed by Şahin (2009). This 5‐point Likert‐ type scale consists of 28 items with a one‐dimensional structure. In the scale, the lowest possible score is 28 and the highest score is 140. For the assessment of self‐efficacy perceptions, it is determined that 28‐65 points correspond to low, 65‐ 102 points correspond to moderate, and 102‐140 points correspond to high level self‐efficacy. The total item correlations of the scale differ between 0.544 and 0.806. The Cronbach alpha internal consistency coefficient for the scale was determined as 0.96. This scale was administered to the participants before the application process.
Instructional Materials Motivation Survey
The measurement tool "Instructional Materials Motivation Survey (IMMS)" was developed by Keller (1987) and adapted to Turkish language by Kutu & Sözbilir (2011). The original survey included 36 items in four factors (attention, compliance, trust, satisfaction). However the Turkish adaptation includes 24 items in two factors (attention‐compliance, trust‐satisfaction). Eigen value is 9.38 and 1.96 for sub‐factors, respectively. It had a 45.36% of total explained variance. The Cronbach Alpha internal consistency coefficient of the survey was 0.83 for the whole survey and 0.79 and 0.69 for sub‐factors, respectively. This scale was administered to the participants after the application process.
Educational Video Production Assessment Rubric
The videos developed by the participants were evaluated with the rubric. Rubrics are considered to be more reliable sources than rating scales because the criteria for marking are clearly stated (Bredekamp, 2015). Analytical rubric was chosen from rubric types for the evaluation of educational videos. An analytical rubric is divided into pieces and evaluated according to work stages or the response, process‐oriented guidelines (Jackson & Larkin, 2002). The rubric was developed based on six main categories (message, originality, use of multimedia elements, consistency of multimedia elements, video flow, scene transition) that could have an impact on the video product such as message design, video product development techniques, multimedia principles.
While developing the rubric, certain steps that have been existent in the literature were taken. These are choosing the desired performance, determining the performance dimensions, and writing the performance definitions (Quinlan, 2006;Moskal, 2003; Saddler & Andrade, 2004; Jackson & Larkin, 2002). The rubric was developed with a 3‐point evaluation method which is presented in Appendix 1. Thus, video products were examined based on six main categories and scored with at least one and at most three points in each category. In addition, the rubrics, developed to increase the reliability and validity, were evaluated by a specialist who had studies in the field of multimedia. Moreover, two researchers independently evaluated the videos produced by the students in accordance with rubrics.
As a result of the evaluation, the percentage of fit between the researchers was calculated using the fit percentage formula of Miles & Huberman (1994) (Compliance% = [Consensus / Agreement + Consensus] * 100) as .85. As a result of the evaluation conducted by researchers and specialist, it is determined that the rubric works in accordance with the purpose of development.
Research Process
It was observed in the literature that video development process is conducted in three stages: pre‐ production, production and post‐production (Callele, Neufeld & Schneider, 2005; Cartwright, 1996; Corbally, 2005; Hobbs et al., 2013). Thus, a three‐week research process was planned based on these three stages. These steps are presented in Figure 1 and described in detail below:
Figure 1. Application process
Pre‐production
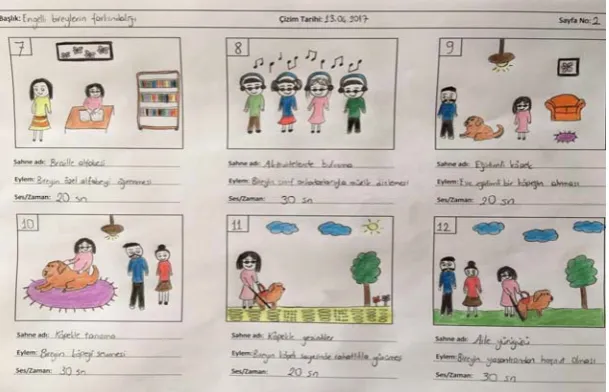
The first phase of the study involved a pre‐production work conducted by participants. Each task, required to be performed in this stage, was presented to the participants in an info graphic. After this process, participants were asked to form groups of 2, 3 or 4 individuals. A learning management system (LMS) was established via Moodle to ensure communications among group members and to present the products. Participants had to enroll at this system. In next stage, the groups were asked to select one of social responsibility topics (health hazards of smoking, animal rights, respect in traffic, global warming, etc.) to produce a video. The groups were not forced to use one of these topics. On the contrary, they were able to choose any social responsibility issue based on their interests. The group members discussed about the issues on LMS and wrote a script for their video. Then, the group members created storyboards based on the scripts. For example, a storyboard, created on the topic of creating awareness for visually impaired people, is presented below in Figure 2.
Figure 2. The storyboard created on the topic of creating awareness for visually impaired people Production
At this stage, the participants developed video products based on the storyboard they created. At the beginning of this process, the participants were informed about access to non‐copyrighted audio and visual materials on the Internet. Thus, the participants in groups searched for relevant multimedia elements on the Internet and downloaded the materials they liked onto the LMS. Participants were then informed about the WeVideo video editing application, downloadable at https://www.wevideo.com/. Then, the groups produced videos using the WeVideo application. WeVideo application was preferred because it had an easy‐to‐use interface, offered Turkish language support and was a web‐based application. Furthermore, it offered 7.5 minutes free video development per month.
Pre‐Production Topic selection Script writing
Developing a storyboard
Production Determining multimedia elements
Combining the files in video editing software
Post‐production
In this stage, the videos developed by the groups were edited. In other words, they edited sound and scene transitions of the video they produced. Also, the groups solved transition problems between the scenes at this stage. The videos of the groups that successfully completed the video development process were presented in the classroom in the presence of all participants.
Figure 3. A screenshot of the video produced on creating awareness for visually impaired people Data Analysis
Data analysis was conducted in two stages in the study. In the first stage, student demographics were presented. Furthermore, descriptive statistics on video assessment, educational Internet use self‐efficacy, personal innovativeness, motivation and emotion scores obtained in the study, were presented. In the second stage, a multivariate linear regression analysis was conducted to determine the variables that affected academic achievement (video development score). The standard (Enter) model was used in this analysis.
FINDINGS
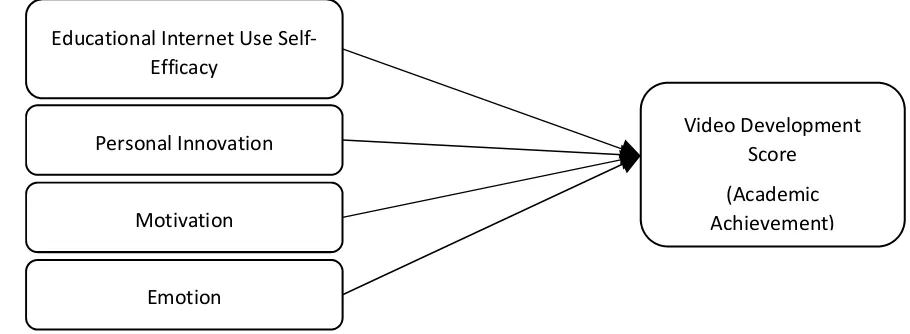
Variables of the study were determined as educational internet use self‐efficacy, personal innovativeness, motivation, and emotion. In addition, academic achievement was identified as the predicted variable of the video product development score model. The purpose of constructing this model was to investigate the factors that influenced the participants while producing a video with desired qualities.
Figure 4. Graphical presentation of regression model
Video Development Score (Academic Achievement) Educational Internet Use Self‐
Efficacy
Personal Innovation
Motivation
Table 2. Descriptive statistics on continuous variables in data collection instruments
n Min Max x̅ SD
Video development score 160 8 18 13.76 2.220
Educational Internet Use Self‐Efficacy 160 43 140 94.98 21.10
Personal Innovativeness 160 42 89 68.29 7.361
Motivation 160 45 111 84.88 12.51
Emotion score 160 1.00 5.00 3.66 1.06
The data obtained with the educational internet use self‐efficacy, personal innovativeness and motivation scales were evaluated according to total scores. The linearity assumptions for all variables used in the study were verified. Furthermore, Skewness and Kurtosis tests demonstrated that the data exhibited normal distribution. The linear multivariate regression findings determined the degree that educational Internet use self‐efficacy, personal innovativeness, motivation and emotion variables predicted the video development score. Table 3 below presents the ANOVA table for the model.
Table 3. ANOVA for the regression model
Sum of Squares sd F p
Regression 54.227 4 2.881 .025*
Residual 729.267 155
Total 783.494 159
*p<0.05; R2 =.069
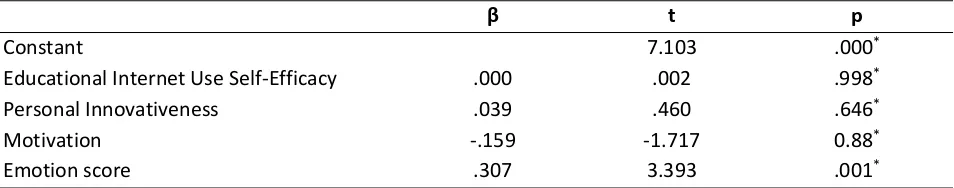
It was determined that the model investigated in the study was significant at p < .05. In the current model, the R‐squared value indicated that determined variables explained 6.9% of the variance in the video scores. In order to identify significant variables in regression model, it was important to investigate variable coefficients. In Table 4, standard coefficients and significance values of the variables included in the regression model are presented.
Table 4. Independent variables’ standard coefficients
β t p
Constant 7.103 .000*
Educational Internet Use Self‐Efficacy .000 .002 .998*
Personal Innovativeness .039 .460 .646*
Motivation ‐.159 ‐1.717 0.88*
Emotion score .307 3.393 .001*
correlations between the variables that affect the video development scores of pre‐service teachers. Results of the analysis are presented in Table 5.
Table 5. Pearson’s Product‐Moment Correlation Coefficient Distributions among the variables that affect video development score
Educational Internet
Use Self‐Efficacy
Personal
Innovativeness Motivation
Personal Innovativeness
r .373**
p .000
n r
160
Motivation
.128 .211**
p .105 .007
n 160 160
Emotion
r .025 .009 .507**
p .751 .914 .000
n 160 160 160
**p<.05
As seen in Table 5, there were significant and positive correlations between total personal innovativeness and educational Internet use self‐efficacy scale scores (r =, 373; p <, 01); motivation and personal innovativeness scale scores (r =, 211; p <, 05); and motivation and emotion scale scores (r =, 507; p <, 05). In order to describe the correlation level, Evans (1996) proposed that the level of correlation should be defined as very weak between 00‐.19, weak between .20‐.39, moderate between .40‐.59, strong between .60‐.79, and very strong between .80‐1.00. Accordingly, it can be stated that there was a weak correlation between personal innovativeness, educational Internet self‐efficacy and motivation, and personal innovativeness in accordance with above mentioned intervals. However, there was a moderate correlation between motivation and emotion.
DISCUSSION
AND
CONCLUSION
complete a video development process in 3 weeks (2 hours a week), however they stated that they spent a great deal of time on the project on their own, as well.
Factors related to video development were analyzed with the regression enter model. Although there are some factors that were determined as statistically insignificant in the model, this study still constitutes a guide for educators. On the other hand, the emotion score associated with the process was a significant factor that affected video development achievement. In the study, students freely selected the topic and group members. Furthermore, students were not guided in expressing their emotions and thoughts. Thus, emotional changes that the students experienced in the process directly affected video achievement scores. At the end of the application process, a large majority of the students stated that they were satisfied with the video development process. Emotion scores obtained in the study also bore witness for this finding. In addition, this finding is consistent with the study of Pirhonen & Rasi (2017). The researchers found out that producing instructional videos about the subject matter provided a student‐centered learning environment in which students could motivate, engage, and had productive roles. They also suggested that video development activity enhanced students’ motivation and positive emotions. Similarly, Koc (2011) claimed that video development process could develop pre‐service teachers’ motivation, and the construction of professional identity. Moreover, according to Girod (2007), video development activity offered a valuable opportunity to help students pay attention to the issues on the role of group process, audience, and educational outcome.
In the present study, it was determined that educational Internet self‐efficacy, personal innovativeness and motivation factors were not statistically significant predictors of video development achievement. However, this finding was inconsistent with the studies in the literature. For example, technical skill is an important variable that affects academic achievement or student participation in computer‐aided learning environments according to Dennis et al. (2010) cited in Çakir (2013). Similarly, Reeves, Caglayan, & Torr (2017) state that students need to have at least a basic technical skill in terms of maximizing the benefits of video development process. Therefore, it can be thought that internet use self‐efficacy does not affect the video production process as the students produce videos without the need of technical skills thanks to the web 2.0 tools. Likewise, in the current study, it was determined that the educational Internet use self‐efficacy did not directly affect the video development scores. Secondly, it was concluded in the current study that students’ motivation levels were not a factor that affected the video development scores. However, it was reported in the literature that the motivation level was a significant factor that affected student achievements (Gbollie & Keamu, 2017; Amrai et al., 2011; Tella, 2007; Vansteenkiste et al., 2005). There might be a few reasons for the insignificance of this variable in the current study. The first reason could be the fact that students developed videos in groups in the current study, thus every student did not contribute equally to the produced video which resulted in disagreements within the groups. Moreover, the fact that the application was completed in a short period of only 3 weeks could have also led to the above‐mentioned result.
The fact that two different educators were included in the application process was a limitation of the current study. This may have led to certain differences in the activities. Future studies can be conducted to investigate the effects of different variables such as critical thinking and creative thinking skills. In addition, studies including video development activities conducted over a longer time span, and carried out by individual students, not groups will also be more effective.
Appendix 1: Educational Video Assessment Rubric
Items 1 2 3 Score
Message The information provided was insufficient to describe the subject. The information provided was sufficient to describe the subject. The provided information reflected the objective of the subject to the audience in an interesting manner. Originality The message of the subject was presented with a common construct. The presentation of the message included unaccustomed emotions, thoughts and perspectives The message was presented with an original construct Use of multimedia elements Textual, visual and audio elements were included in the same scene or one element was dominant in one scene. Use of textual and verbal elements together was avoided. Only visual and verbal multimedia elements related to the topic were used economically. Consistency of multimedia elements Multimedia elements that were inconsistent with the subject were used. Multimedia elements that were consistent with the subject were used. Multimedia elements were both consistent with the subject and in harmony with one another. Video Stream There were problems that disrupt the video stream (resolution, dimension, rotation, cropping, etc.). There were audio problems that disrupt the video stream (volume, external sounds, unrelated voices, etc.). There were not audiovisual elements that disrupted the video stream. Scene transitions No scene transitions were utilized, or unrelated transitions were used. Appropriate effects and transitions were included in the video. Transitions that did not disrupt the concentration of the audience and did not disrupt the video stream were used. Total Score:
R
EFERENCESAmrai, K., Motlagh, S. E., Zalani, H. A., & Parhon, H. (2011). The relationship between academic motivation and academic achievement students. Procedia‐Social and Behavioral Sciences, 15, 399‐402.
Atıcı, B., & Yıldırım, S. (2010). Web 2.0 uygulamalarının e‐öğrenmeye etkisi. Akademik Bilişim, 10, 10‐12. Balantekin, Y., & Bilgin, A. (2017). ARCS Motivasyon Modeli’nin Öğrencilerin Motivasyonlarına, Tutumlarına
ve Akademik Başarılarına Etkisi. İlköğretim Online, 16(1), 161–177.
Baran, E., Canbazoğlu‐Bilici, S., & Mesutoğlu, C. (2015). Fen, Teknoloji, Mühendislik ve Matematik (FeTeMM) Spotu Geliştirme Etkinliği. Araştırma Temelli Etkinlik Dergisi (ATED), 5(2), 60‐69.
Bradley, J. P., & Cole, D. R. (2016). On multiple literacies and language learning: video production and embodied subjectivities. In ELTWO: Special Issue on 5th CELC Symposium Proceedings: Selected Papers from the Fifth CELC Symposium for English Language Teachers, National University of Singapore, 25‐27 May 2016 (pp. 94‐105).
Bredekamp, S. (2015). Erken çocukluk eğitiminde etkili uygulamalar (H.Z. İnan & T. İnan Çev. Ed.). Ankara: Nobel.
British Educational Communications and Technology Agency (Becta) (2003). What the research says about digital video in teaching and learning. Retrieved from:
http://www.nsead.org/ict/resources/downloads/Research15_DigitalVideo.pdf
Cakir, H. (2013). Use of blogs in pre‐service teacher education to improve student engagement. Computers & Education, 68, 244‐252.
Callele, D., Neufeld, E., & Schneider, K. (2005, August). Requirements engineering and the creative process in the video game industry. In Requirements Engineering, 2005. Proceedings. 13th IEEE International Conference on (pp. 240‐250). IEEE.
Cartwright, S. R. (1996). Pre‐production planning for video, film, and multimedia (1st Edition). Taylor & Francis. Corbally, M. A. (2005). Considering video production? Lessons learned from the production of a blood
pressure measurement video. Nurse education in practice, 5(6), 375‐379.
Dinçer, S., & Doğanay, A. (2016). Öğretim materyali’ne İlişkin motivasyon ölçeği (ÖMMÖ) Türkçe uyarlama çalışması. Elementary Education Online, 15(4), 1131–1148. doi.org/10.17051/io.2016.19056
Evans, J. D. (1996). Straightforward statistics for the behavioral sciences. Pacific Grove, CA: Brooks/Cole Publishing. GIEC, 2007
Fraenkel, J. R., Wallen, N. E., & Hyun, H. H. (2012). How to design and evaluate research in education (Vol. 7). New York: McGraw‐Hill.
Gaston, J. P., & Havard, B. (2019). The Effects of Collaborative Video Production on Situational Interest of Elementary School Students. TechTrends, 63(1), 23‐32.
Gbollie, C., & Keamu, H. P. (2017). Student academic performance: The role of motivation, strategies, and perceived factors hindering Liberian junior and senior high school students learning. Education Research International, 2017, 1‐11.
Girod, M., Bell, J., & Mishra, P. (2007). Using digital video to re‐think teaching practices. Journal of Computing in Teacher Education, 24(1), 23‐29.
Goldsmith, R. E., & Foxall, G. R. (2003), “The measurement of Innovativeness”, in Shavinina L.V. (Ed.), The International Handbook of Innovation, Elsevier Science, Oxford, pp.321‐330.
Greenberg, A. D., & Zanetis, J. (2012). The impact of broadcast and streaming video in education. Retrieved from: http://www.cisco.com/web/strategy/docs/education/ciscovideowp.pdf
Greene, H., & Crespi, C. (2012). The value of student created videos in the college classroom–an exploratory study in marketing and accounting. International Journal of Arts and Sciences, 5(1), 273‐283.
Hafner, J., & Hafner, P. (2003). Quantitative analysis of the rubric as an assessment tool: an empirical study of student peer‐group rating. Int. J. Sci. Educ., 25(12), 1509‐1528.
Hafner, C. A., & Miller, L. (2011). Fostering learner autonomy in English for science: A collaborative digital video project in a technological learning environment. Language Learning & Technology, 15(3), 68‐86. Hakkarainen, P. (2009). Designing and implementing a PBL course on educational digital video production: lessons learned from a design‐based research. Educational Technology Research and Development, 57, 211–228.
Hobbs, R. (1998). The seven great debates in the media literacy movement. Journal of communication, 48(1), 16‐32.
Hobbs, R., Donnelly, K., Friesem, J., & Moen, M. (2013). Learning to engage: How positive attitudes about the news, media literacy, and video production contribute to adolescent civic engagement. Educational Media International, 50(4), 231‐246.
Hurt, H. T., Joseph, K., & Cook, C. D. (1977). Scales for the measurement of innovativeness. Human Communication Research, 4, 58‐65.
Jackson, M.,& Larkin, J.M. 2002. Teaching Students to Use Grading Rubrics. Teaching Exceptional Children, 35 (1), 40‐45.
Kasumuni, L. (2011). Delivering video by mobile phone to classrooms in Tanzania. Retrieved from http://ela‐ newsportal.com/delivering‐video‐by‐mobile‐phone‐to‐classrooms‐in‐tanzania/. Last Accessed 22 Jan 2019.
Kaya, A. (2009). Eğitim Psikolojisi (3rd Ed.) PegemA Publishing, Ankara.
Kearney, M., & Schuck, S. (2006). Spotlight on authentic learning: Student developed digital video projects. Australasian Journal of Educational Technology, 22(2).
Kılıç, E., & Çelik, B. (2014). Dijital Video Kullanımının Prosedürel Öğrenme Sürecinde Kullanımının Teknoloji Kabul Modeli ile Değerlendirilmesi. İlköğretim Online, 13(3), 980‐991.
Kılıçer, K., & Odabaşı, H.F. (2010) Bireysel yenilikçilik ölçeği (BYÖ): Türkçe’ye uyarlama, geçerlik ve güvenirlik çalışması, Hacettepe Üniversitesi Eğitim Fakültesi Dergisi, 38, 150‐164.
Kılınç, H., Fırat, M. & Yüzer, T. V. (2017). Trends of video use in distance education: A research synthesis. Pegem Journal of Education and Instruction, 7(1), 55.
Koc, M. (2011). Let’s make a movie: Investigating pre‐service teachers’ reflections on using video‐recorded role playing cases in Turkey. Teaching and Teacher Education, 27(1), 95‐106.
Kutu, H., & Sözbilir, M. (2011). Öğretim materyalleri motivasyon anketinin Türkçeye uyarlanması: Güvenirlik ve geçerlik çalışması. Necatibey Eğitim Fakültesi Elektronik Fen ve Matematik Eğitimi Dergisi (EFMED), 5(1), 292‐312.
Leutner, D. (2014). Motivation and emotion as mediators in multimedia learning. Learning and Instruction, 29, 174–175. doi.org/10.1016/j.learninstruc.2013.05.004
Liaw, S. S. (2002). Understanding user perceptions of world‐wide web environments. Journal of Computer Assisted Learning, 18, 137–148.
Livingstone, S., & Helsper, E. (2010). Balancing opportunities and risks in teenagers’ use of the internet: The role of online skills and internet self‐efficacy. New media & society, 12(2), 309‐329.
Mayer, R. E. (2009). Multimedia learning (2nd Ed.). New York: Cambridge University Press.
MEB (2017). Bilişim Teknolojileri ve Yazılım Dersi Öğretim Programı. Retrived from: http://mufredat.meb.gov.tr/Dosyalar/2018124103559587‐
Bili%C5%9Fim%20Teknolojileri%20ve%20Yaz%C4%B1l%C4%B1m%205‐ 6.%20S%C4%B1n%C4%B1flar.pdf
Miles, M, B., & Huberman, A. M. (1994). Qualitative data analysis: An expanded Sourcebook. (2nd ed). Thousand Oaks, CA: Sage.
Moore, M. (1989). Three types of interaction. The American Journal of Distance Education, 3(2), 1–6. Moskal, M. B. 2003. Recommendations for Developing Classroom Performance Assessments and Scoring
Rubrics. Retrieved from: http://pareonline.net/getvn.asp?v=8&n=14
Norton, P., & Hathaway, D. (2010). Video production as an instructional strategy: Content learning and teacher practice. Contemporary Issues in Technology and Teacher Education, 10(1), 145‐166.
Odabaşı, H. F., Mısırlı, Ö., Günüç, S., Timar, Z. Ş., Ersoy, M., Som,S., & Erol, O. (2012). Eğitim için Yeni Bir Ortam: Twitter. Anadolu Journal of Educational Sciences International, 2(1), 89‐103.
Pekrun, R., Goetz, T., Frenzel, A. C., Barchfeld, P., & Perry, R. P. (2011). Measuring emotions in students’ learning and performance: The Achievement Emotions Questionnaire (AEQ). Contemporary Educational Psychology, 36(1), 36–48. doi.org/10.1016/j.cedpsych.2010.10.002
Pirhonen, J., & Rasi, P. (2016). Student‐generated instructional videos facilitate learning through positive emotions. Journal of Biological Education, 51(3), 215–237.
https://doi.org/10.1080/00219266.2016.1200647
Quinlan, A. M. (2006). A Complete Guide to Rubrics. Oxford: Rowman &Littlefield Education.
Rogers, E. M. (2003). Diffusion of innovations (Fifth Edition). New York, NY: The Free Press.
Reeves, T., Caglayan, E., & Torr, R. (2017). Don’t shoot! Understanding students’ experiences of video‐based learning and assessment in the arts. Video Journal of Education and Pedagogy, 2(1), 1‐13.
Saddler, B. & Andrade, H. (2004). The Writing Rubric. Educational Leadership, 62(2), 48‐52.
Schuck, S., & Kearney, M. (2006). Capturing Learning through Student‐Generated Digital Video. Australian Educational Computing, 21(1), 15–20.
Shi, J., Chen, Z., & Tian, M. (2011). Internet self‐efficacy, the need for cognition, and sensation seeking as predictors of problematic use of the Internet. Cyberpsychology, Behavior, and Social Networking, 14(4), 231‐234.
Staus, N. L., & Falk, J. H. (2017). The Role of Emotion in Informal Science Learning: Testing an Exploratory Model. Mind, Brain, and Education, 11(2), 45–53.
Şahin, İ. (2009). Eğitsel internet kullanım öz‐yeterliği inançları ölçeğinin geçerliği ve güvenirliği. Selçuk Üniversitesi Sosyal Bilimler Enstitüsü Dergisi, 21, 461‐471.
Tella, A. (2007). The impact of motivation on student’s academic achievement and learning outcomes in mathematics among secondary school students in Nigeria. Eurasia Journal of Mathematics, Science & Technology Education, 3(2), 149‐156.
Tiernan, P. (2015). An inquiry into the current and future uses of digital video in University teaching. Education and Information Technologies, 20(1), 75‐90.
Ting, N. C. (2013). Classroom Video Project: An Investigation on Students Perception. Procedia‐Social and Behavioral Sciences, 90, 441‐448.
Traxler, J., & Kukulska‐Hulme, A. (2005). Mobile Learning in Developing Countries. Commonwealth of Learning, Vancouver, BC: Commonwealth of Learning.
Vansteenkiste, M., Zhou, M., Lens, W., & Soenens, B. (2005). Experiences of autonomy and control among Chinese learners: Vitalizing or immobilizing? Journal of educational psychology, 97(3), 468.
Yanpar Yelken, T. (2017). Öğretim teknolojileri ve materyal tasarımı. Anı Publishing, Ankara.