R E S E A R C H
Open Access
Quantifying microstructural changes
in retinitis pigmentosa using spectral
domain
–
optical coherence tomography
B. Poornachandra
1, Aruj K. Khurana
1, Preethi Sridharan
1, Priyansha Chatterjee
2, Chaitra Jayadev
1*,
Naresh Kumar Yadav
1and Rohit Shetty
2Abstract
Background:Most patients of established retinitis pigmentosa (RP) have subnormal peripheral vision and heavily rely on central vision for their daily activities. Central visual acuity is dependent on photoreceptor survival at the macula. Identification of structural changes that precede visual loss is essential. The aim of this study was to correlate the Spectral Domain-Optical Coherence Tomography (SD-OCT) characteristics with visual acuity in patients with typical RP.
Methods:This was a retrospective, observational case series of 224 eyes of 113 RP patients conducted a tertiary eye care center. SD-OCT imaging was done for all eyes. Central retinal thickness (CRT), photoreceptor outer segment length (PROS), foveal outer segment pigment epithelial thickness (FOSPET) and ellipsoid zone (EZ) extent were measured. A new variable, FOSPET-PROS ratio (FPR), obtained by dividing FOSPET by PROS is defined and correlated to corrected distance visual acuity (CDVA) in logMAR using linear regression.
Results:Out of 113 patients, 71 were males and 42 females. Mean age of the patients was 35.4 ± 15.1 years. Mean CDVA was 0.33 ± 0.25 logMAR with no difference between the genders. Mean CRT (218.74 ± 83.5μm) and FPR (1.63 ± 0.22) significantly correlated to CDVA with a correlation coefficient of r =−0.139 (p= 0.048) and r = 0.842 (p= 0.0001), respectively. FOSPET (mean = 71.15 ± 13.8μm) and PROS (mean = 44.85 ± 12.5μm) did not show a significant correlation to CDVA, independent of FPR.
Conclusions:Retinal microstructural changes on SD-OCT, especially the FPR, can be used as a surrogate marker to monitor disease progression in the central retina in degenerative diseases like RP.
Keywords:Retinitis Pigmentosa, Photoreceptor outer segment length (PROS), Foveal outer segment pigment epithelial thickness (FOSPET), Ellipsoid zone (EZ), FOSPET-PROS ratio (FPR)
Background
Retinitis pigmentosa (RP) is a complex hereditary disease characterized by progressive degeneration of photore-ceptors [1]. Worldwide prevalence of RP ranges from 1:1878 to 1:7000 across different racial groups [1]. Preva-lence in India has been reported to be much higher, ran-ging from 1:372 in rural to 1:950 in urban populations [2]. Mutations in multiple genes, many of which encode
proteins that are essential for photoreceptor structure and function are said to be the cause for RP [3]. The key fundus features include attenuation of retinal arterioles,
‘waxy pallor’ of the optic nerve head and ‘bone-spicule’ retinal pigment, thinning and atrophy of the retinal pig-ment epithelium in the mid- and far-peripheral retina and characteristic electroretinogram findings of diffuse photoreceptor disease [1].
Patients typically present with visual impairment in-volving night and peripheral vision with gradual deteri-oration of the central visual acuity. Photoreceptor survival in central retina correlates closely with visual function in these patients [4]. Therefore, assessment of
© The Author(s). 2019Open AccessThis article is distributed under the terms of the Creative Commons Attribution 4.0 International License (http://creativecommons.org/licenses/by/4.0/), which permits unrestricted use, distribution, and reproduction in any medium, provided you give appropriate credit to the original author(s) and the source, provide a link to the Creative Commons license, and indicate if changes were made. The Creative Commons Public Domain Dedication waiver (http://creativecommons.org/publicdomain/zero/1.0/) applies to the data made available in this article, unless otherwise stated.
* Correspondence:[email protected]
1Department of Vitreo Retina, Narayana Nethralaya Eye Institute, Bangalore,
India
photoreceptor status may be the most important clinical aspect for monitoring disease progression. Visual wors-ening in RP can also be due to cataract, cystoid macular edema, epiretinal membranes, macular holes and vitreo-macular traction syndrome [5].
Optical coherence tomography (OCT) is a
well-established method of analyzing in vivo retinal architecture [6] and has been used in the management of retinal diseases. Several OCT studies of RP have been reported, most of which show the capacity of OCT to recognize and follow retinal changes in RP patients, es-pecially of the photoreceptors and their integrity, from a hyper-reflective zone in the outer retina, called as the el-lipsoid zone (EZ) [5, 7–10]. The current study was undertaken to study and characterize the various mor-phological changes of photoreceptors on SD-OCT and to determine which of them are predictors for visual acuity loss in RP.
Methods
This was a retrospective, observational, cross-sectional study of 224 eyes of 113 patients with RP, evaluated at a tertiary eye care center between 2011 and 2014 after ap-proval from the Ethics Committee and Research Board of Narayana Nethralaya Eye Institute, Bangalore, India. The diagnosis of RP was based on a history of night vi-sion problem, impairment in peripheral visual fields, re-duction in electroretinogram rod and cone amplitudes using ISCEV (International Society for Clinical Electro-physiology of Vision) standard full-field electroretino-grams [11] (in selected patients), and the presence of characteristic fundus changes. Only eyes with typical RP, defined clinically as the presence of disc pallor, arteriolar attenuation and bony spicules in the mid-peripheral fun-dus, with a clinically normal macula, with corrected dis-tance visual acuity (CDVA) < 1.0 logMAR were included. Pedigree charts were included for the analysis whenever available.
Exclusion criteria were the presence of media opacities including cataract, an intraocular pressure of 21 mmHg or higher, inability to hold steady fixation, associated
ret-inal abnormalities like cystoid macular edema,
epi-retinal membrane, diabetic and other vitreomacular interface abnormalities, systemic conditions that could affect the visual system, history of ocular trauma, or concomitant ocular diseases, including a history of glau-coma, laser therapy, or ocular abnormalities affecting the cornea, lens, or optic nerve. Those eyes, where SD-OCT images were not available or were deemed not of good quality were also excluded.
SD-OCT scans were acquired using the Spectral– do-main Heidelberg retinal angiograph + optical coherence tomography (SD-HRA + OCT)© Heidelberg Engineering. The OCT component of the machine is a spectral/
Fourier domain OCT with 5μm axial resolution and an image acquisition speed of 40,000 scans/second. It em-ploys a broad band 870 nm super luminescent diode source. Sixteen OCT scans were averaged to reduce noise. An experienced operator certified by the DARC (Digital Angiogram Reading Center, USA) acquired all images through a dilated pupil. Two independent ob-servers (PBC and AKK) did the measurements in hori-zontal and vertical scans through the fovea by first magnifying the OCT scan 400% (Fig.1a) and the values were averaged.
The central retinal thickness (CRT): distance between the internal limiting membrane (ILM) and the outer border of the retinal pigment epithelium (RPE) at the fovea.
The photoreceptor outer segment length (PROS) -distance between the inner border of the EZ and the inner border of RPE. [12]
The foveal outer segment pigment epithelial thickness (FOSPET) - distance between the EZ and the outer border of the RPE, measured at the thinnest point of fovea (Fig.1b). [13]
Extent of the preserved EZ line was also measured in horizontal and vertical scans, centered at the fovea (Fig. 2). All measurements were done using the calipers of the Heidelberg reader software [14].
To assess the inter-observer repeatability of the mea-surements of preserved EZ extent and meamea-surements of CRT, PROS and FOSPET on SD-OCT images, the methods described by Bland and Altman were used [15]. The mean difference between two measurements (Ob-server1–Observer2) for each of the SD-OCT images rep-resented the bias. The 95% limits of agreement (LoA), an expected difference between two measurements, were calculated as the mean of the differences ±1.96 standard deviation (SD) of the difference. The coefficient of re-peatability (1.96 × SD of the difference), an indicator of the amount of variation that can be attributed to meas-urement error, was also calculated.
To ascertain the mean CDVA and across pedigree groups as well as for statistical analysis, Snellen’s visual acuity was converted to logMAR units and patients were categorized into 3 subgroups based on their visual acuity as follows:
1. Normal: CDVA = logMAR 0 in both eyes. 2. Mild visual impairment: logMAR 0 < CDVA <
logMAR 0.477.
3. Moderate visual impairment: logMAR 0.477 < CDVA < logMAR 1. Data was analyzed by Shapiro Wilk test to test for normality. To determine the correlation between CDVA and the retinal
microstructure on the SD-OCT, a linear mixed model (LMM) analysis was performed with CDVA as a dependent variable and SD-OCT values as co-variates, as well as their interaction terms. All data were analyzed using the statistical software package SPSS version 22.0 (IBM Corporation, New York City, NY, USA).
Results
Patient data
Overall, 224 eyes of 113 patients were included in the study. These included both eyes of 111 patients and one eye in two patients. The other eye of these two patients
were excluded due to a macular hole and post traumatic phthisical eye. 71 patients were male and 42 were females. Mean age of patients was 35.4 years (range 8– 72 years). Mean CDVA was 0.33 logMAR (converted Snellen’s visual acuity = 20/42) with a range of 0.0–1.0 (SD = 0.25, Kurtosis = 0.38, skewness = 0.93).
On classifying the eyes based on the above mentioned criteria for vision, 54.5% (n = 122) had normal CDVA, 26.3% (n= 59) had mild visual impairment and 19.2% (n= 43) had moderate visual impairment. Pedigree charts were available for 72.5% (n = 82) patients. Most common inheritance pattern was the Simplex variant, seen in 34.5% (n = 39) followed by autosomal recessive (AR) (19.5%, n = 22), autosomal dominant (AD) (13.3%,
n = 15) and X-linked (5.3%, n = 6). Mean CDVA across pedigree groups did not show a significant difference (Table3).
SD-OCT measurements
Mean values of SD-OCT measurements were CRT = 218.74μm (range = 90–285μm), PROS = 44.85μm (range = 20–68μm) and FOSPET = 71.15μm (range = 45
–95μm). A new variable, termed the FOSPET-PROS ra-tio (FPR), was derived by dividing the FOSPET value by the PROS value. Mean FPR was 1.63 (range = 1.30–2.23). Fig. 2Measurement of the preserved ellipsoid zone length centered
on the fovea
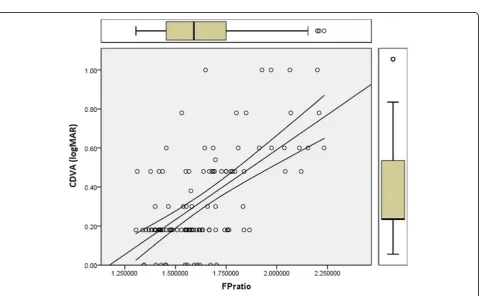
Mean values of CRT, PROS, FOSPET and FPR across visual acuity groups are given in Table1and show a sig-nificant difference. Multivariate analysis demonstrates that both CRT (p = 0.048) (Fig. 3) and FPR (p < 0.001) (Fig. 4) showed a significant correlation to logMAR CDVA; PROS and FOSPET however, did not show a sig-nificant correlation with CDVA as shown in Table 2. Age was adjusted for this analysis.
Mean extent of the preserved EZ in the horizontal and vertical direction was 2856.4μm (range = 518–8799μm) and 2446.3μm (range = 528–7914μm), respectively, and strongly correlated to each other with r2 = 0.874, p < 0.001, but not to CDVA. None of these three measure-ments of the outer retina showed any significant correl-ation to preserved EZ extent.
Mean values of CDVA, CRT, PROS, FOSPET, FPR, and the horizontal and vertical extent of the preserved EZ in different pedigree subgroups are shown in Table3. While the PROS showed a significant difference across pedigree groups (p = 0.44), none of the other variables were significantly different. The mean difference in CRT, PROS and FOSPET between Observer 1 and 2 were + 4μm, + 3.5μm and + 4.4μm, respectively, and there was no significant bias between the observers (p= 0.953, p= 0.937,p= 0.924, respectively). The bias for the measure-ments of preserved EZ in the SD-OCT images was 10.4μm and 11.2μm in horizontal and vertical scan re-spectively with no significant bias between the observers (p= 0.983,p= 0.952, respectively).
Discussion
In recent years, several authors [16, 17] have reported on the utility of SD-OCT in the evaluation of eyes with RP, a disease that primarily affects the photoreceptors and the RPE [1]. In this study, the CRT, PROS length and FOSPET were measured. The extent of the pre-served EZ at the fovea was measured as well. We also introduced a new variable obtained by dividing the FOS-PET value by the PROS, called the FOSFOS-PET-PROS ratio (FPR).
The earliest histopathological change in the photore-ceptors of eyes with RP is a shortening of the photo-receptor outer segments [18] while the loss of the cones is associated with reduced central vision at the end stage of the disease. Several OCT studies in RP patients study
the correlation between the presence and continuity of the inner segment/outer segment (IS/OS) line, what is now called as EZ and the visual function [13, 17–24]. Using Fourier Domain OCT in eyes with retinal dys-trophy, Lim et al. have demonstrated a 11% decrease in the macular inner retina layer and a 45% decrease in the macular ORL compared with normal [25]. Sandberg et al. [21] found a significant correlation between the grade of EZ and the visual acuity in RP patients. Aizawa et al. also reported that the length of the EZ significantly cor-relates with the retinal sensitivity and visual acuity of RP patients [24, 26]. The positive correlation between cen-tral visual acuity and extent of preserved EZ line possibly indicates that the degeneration of the central cones cor-relates with peripheral rods’ degeneration. In our study, we have found no significant correlation between CDVA, which signifies the cone function, and the extent of pre-served EZ on SD-OCT. This could be attributed to early or late onset of cone degeneration secondary to the genetic heterogeneity of RP. Thus, the preserved EZ, rather than central visual acuity, may correlate better with visual field loss and retinal sensitivity on microperimetry.
Foveal thinning, probably secondary to photoreceptor loss, as measured on OCT has been shown to correlate with visual acuity in RP [13, 27]. In our study, the CRT significantly correlated with the CDVA. Photoreceptor loss has also been described using SD-OCT in other macular disorders [28, 29]. In RP patients, qualitative measures of photoreceptor structure such as external limiting membrane (ELM) status, foveal EZ and inter-digitation zone (IZ) have been studied and have been shown to be significantly associated with central CDVA [8, 27, 30]. While PROS length has correlated with CDVA in many macular diseases [31–34], decreased PROS length is associated with loss of contrast sensitiv-ity and color vision in RP patients with good CDVA [35]. Hence, we quantitatively measured the PROS length in our study. Foveal outer segment retinal epithe-lial thickness has been described as a quantitative meas-ure of photoreceptor structmeas-ure with correlation to the CDVA [13]. Neither PROS nor FOSPET significantly correlated with CDVA independently in our study. Add-itionally, we divided the value of FOSPET by the value
of PROS to define a new variable called the
Table 1Mean values of CRT, PROS, FOSPET and FPR across visual acuity groups
Visual acuity subgroup Normal Mild visual impairment Moderate visual impairment Pvalue
CRT (μm) 237 ± 49 216 ± 40 173 ± 101 0.008
PROS (μm) 52 ± 9 38 ± 10 34 ± 9 0.001
FOSPET (μm) 79 ± 11 63 ± 12 61 ± 10 0.001
FPR 1.53 ± 0.13 1.65 ± 0.19 1.90 ± 0.23 < 0.001
CRT= central retinal thickness;PROS= photoreceptor outer segment;FOSPET= foveal outer segment pigment epithelial thickness;FPR= FOSPET:PROS ratio
Fig. 3Scatter plot with central retinal thickness on the x-axis and CDVA on the y-axis
FOSPET-PROS ratio or FPR. Using a multivariate model, we have demonstrated a significant inverse correlation between FPR and CDVA in RP. Moreover, the mean FPR was shown to be significantly different across various visual acuity groups. These correlations were independ-ent of the age of the patiindepend-ent.
There are two possible explanations for the strong cor-relation of FPR with CDVA. The height of the RPE-Bruch’s complex may correlate with the height of photoreceptor outer segments, measured as PROS on SD-OCT. Instead of absolute values, a ratio may be a more accurate reflection of shortening of the photo-receptor outer segments, i.e. PROS shortening with ref-erence to the RPE. Moreover, the RPE-Bruch’s complex is itself thickened and may reflect an additional path-ology in the disease process, i.e. PROS thinning and RPE-Bruch’s complex thickening occur as the disease progresses despite a clinically normal appearing mac-ula. Indeed, some histopathological reports mention the presence of acidic mucosal substances in the inter photoreceptor matrix space [36] and widespread de-posits of abnormal material between the RPE and inner collagenous layer of Bruch’s membrane [37–39]. Although foveal thinning in RP is predominantly due to photoreceptor loss or shortening, on multivariate analysis the CRT independently correlated to the CDVA.
The CDVA, PROS, FOSPET and FPR showed a trend toward progressive decline when analyzed across pedi-gree subgroups with simplex or sporadic cases being the best and X-linked, the worst (Table 3); however, apart from PROS, the differences did not reach statistical sig-nificance. This further lends support to our hypothesis
that the FPR, instead of absolute values of PROS, is a better surrogate marker for CDVA in RP patients.
Our study is an attempt to identify microstructural changes at the macula on SD-OCT that precede func-tional loss. Most patients of established RP have subnor-mal peripheral vision and heavily rely on central vision for their daily activities. Central visual acuity is dependent on photoreceptor survival at the macula. Identification of structural changes that precede visual loss is essential. To the best of our knowledge this is the first study that has quantitatively measured three vertical foveal parameters on OCT, the CRT, PROS and FOS-PET, and their correlation with CDVA in RP patients. We have also measured the FOSPET: PROS ratio (FPR) and demonstrated that the FPR has the best correlation with CDVA compared to the other vertical foveal pa-rameters and strongly believe that it is a potential marker of disease progression. Further research and es-tablishment of a normative database of FPR might help us in early detection of progression of the disease, much before drop in visual acuity. Further, it might also help in monitoring treatment response. Studies are required to establish the role of the RPE-Bruch’s complex in pa-tients with RP and the interaction of transverse outer retinal structures such as ELM, EZ and IZ with vertical measurements to clearly delineate the true measure and predictor of CDVA, contrast sensitivity and color vision in retinal degenerative disorders. It is possible that these SD-OCT measurements denote different aspects of photoreceptor functions. Identifying these markers can also help to formulate the inclusion and exclusion cri-teria for clinical trials in RP.
The limitations of our study are the use of Snellen’s visual acuity for measurement of CDVA, lack of docu-mentation of transverse structural changes and their cor-relation to CDVA. We did not have the genetic mutational data for all patients and did not use other functional measures of central vision or a control group.
Conclusion
There is a continuous need to detect micro structural changes in degenerative diseases like RP in its earliest stage when therapy may be most useful. To identify
Table 2Age-adjusted multivariate analysis of CRT, PROS, FOSPET and FPR with CDVA as an independent variable
Measurement Standardized coefficient P value
CRT −0.139 0.048
PROS 0.122 0.591
FOSPET 0.329 0.128
FPR 0.842 0.0001
CRT= central retinal thickness;PROS= photoreceptor outer segment;FOSPET = foveal outer segment pigment epithelial thickness;FPR= FOSPET:PROS ratio
Table 3Mean values of CDVA and SD-OCT measurements in pedigree subgroups
Pedigree CDVA
(logMAR)
CRT (μm)
PROS (μm)
FOSPET (μm)
Horizontal EZ (μm)
Vertical EZ (μm)
FPR
Simplex 0.27 ± 0.20 211 ± 87 49 ± 11 75 ± 11 2803 ± 2137 2393 ± 1979 1.59 ± 0.21
AD 0.32 ± 0.19 227 ± 87 46 ± 12 72 ± 11 3147 ± 1988 2644 ± 2068 1.60 ± 0.22
AR 0.38 ± 0.22 232 ± 124 41 ± 13 66 ± 14 2926 ± 2254 2450 ± 1717 1.68 ± 0.24
X-linked 0.49 ± 0.30 222 ± 45 36 ± 12 64 ± 17 2897 ± 584 2880 ± 1316 1.82 ± 0.22
Not known 0.34 ± 0.25 216 ± 42 44 ± 13 71 ± 16 2722 ± 1778 2408 ± 1760 1.64 ± 0.20
AD= autosomal dominant;AR= autosomal recessive;CDVA= corrected distance visual acuity;CRT= central retinal thickness;PROS= photoreceptor outer segment;FOSPET= foveal outer segment pigment epithelial thickness;EZ= ellipsoid zone;FPR= FOSPET:PROS ratio
surrogate end points to monitor response to therapeutic intervention before true functional loss has occurred is the need of the hour.
Acknowledgements
None.
Funding
None.
Availability of data and materials
All data generated or analyzed during this study are included in this manuscript.
Authors’contributions
All authors contributed equally to the manuscript. All authors read and approved the final manuscript.
Ethics approval and consent to participate
Approved from the Narayana Nethralaya Eye Institute’s ethics committee.
Consent for publication
Consent was obtained from enrolled patients.
Competing interests
The authors declare that they have no competing interests.
Author details 1
Department of Vitreo Retina, Narayana Nethralaya Eye Institute, Bangalore, India.2Department of Ophthalmology, Narayana Nethralaya Eye Institute,
121/C, Chord Road, 1“R”Block, Rajajinagar, Bangalore, Karnataka 560010, India.
Received: 9 November 2018 Accepted: 16 April 2019
References
1. Hartong DT, Berson EL, Dryja TP. Retinitis pigmentosa. Lancet. 2006; 368(9549):1795–809.
2. Sen P, Bhargava A, George R, Ve Ramesh S, Hemamalini A, Prema R, et al. Prevalence of retinitis pigmentosa in south Indian population aged above 40 years. Ophthalmic Epidemiol. 2008;15(4):279–81.
3. Lee SH, Yu HG, Seo JM, Moon SW, Moon JW, Kim SJ, et al. Hereditary and clinical features of retinitis pigmentosa in Koreans. J Korean Med Sci. 2010; 25(6):918–23.
4. Brown J Jr, Webster AR, Sheffield VC. Molecular genetics of retinal disease. In: Ryan SJ, Hinton DR, Schachat AP, Wilkinson CP, editors. Retina. 4th ed. Philadelphia, PA: Elsevier Mosby; 2006. p. 373–94.
5. Hagiwara A, Yamamoto S, Ogata K, Sugawara T, Hiramatsu A, Shibata M, et al. Macular abnormalities in patients with retinitis pigmentosa: prevalence on OCT examination and outcomes of vitreoretinal surgery. Acta Ophthalmol. 2011;89(2):e122–5.
6. Alam S, Zawadzki RJ, Choi S, Gerth C, Park SS, Morse L, et al. Clinical application of rapid serial fourier-domain optical coherence tomography for macular imaging. Ophthalmology. 2006;113(8):1425–31.
7. Apushkin MA, Fishman GA, Janowicz MJ. Monitoring cystoid macular edema by optical coherence tomography in patients with retinitis pigmentosa. Ophthalmology. 2004;111(10):1899–904.
8. Birch DG, Locke KG, Wen Y, Locke KI, Hoffman DR, Hood DC. Spectral-domain optical coherence tomography measures of outer segment layer progression in patients with X-linked retinitis pigmentosa. JAMA Ophthalmol. 2013;131(9):1143–50.
9. Smith TB, Parker M, Steinkamp PN, Weleber RG, Smith N, Wilson DJ; VPA Clinical Trial Study Group; EZ Working Group. Structure–function modeling of optical coherence tomography and standard automated perimetry in the retina of patients with autosomal dominant retinitis pigmentosa. PLoS One. 2016;11(2):e0148022.
10. Litts KM, Zhang Y, Freund KB, Curcio CA. Optical coherence tomography and histology of age-related macular degeneration support mitochondria as reflectivity sources. Retina. 2018;38(3):445–61.
11. Marmor MF, Fulton AB, Holder GE, Miyake Y, Brigell M, Bach M. International Society for Clinical Electrophysiology of Vision. ISCEV Standard for full-field clinical electroretinography (2008 update). Doc Ophthalmol. 2009;118(1):69–77. 12. Shiono A, Kogo J, Klose G, Takeda H, Ueno H, Tokuda N, et al.
Photoreceptor outer segment length: a prognostic factor for idiopathic epiretinal membrane surgery. Ophthalmology. 2013;120(4):788–94. 13. Witkin AJ, Ko TH, Fujimoto JG, Chan A, Drexler W, Schuman JS, et al. Ultra-high
resolution optical coherence tomography assessment of photoreceptors in retinitis pigmentosa and related diseases. Am J Ophthalmol. 2006;142:945–52. 14. Dhoot DS, Huo S, Yuan A, Xu D, Srivistava S, Ehlers JP, et al. Evaluation of
choroidal thickness in retinitis pigmentosa using enhanced depth imaging optical coherence tomography. Br J Ophthalmol. 2013;97(1):66–9. 15. Bland JM, Altman DG. Statistical methods for assessing agreement between
two methods of clinical measurement. Lancet. 1986;1(8476):307–10. 16. Rangaswamy NV, Patel HM, Locke KG, Hood DC, Birch DG. A comparison of
visual field sensitivity to photoreceptor thickness in retinitis pigmentosa. Invest Ophthalmol Vis Sci. 2010;51(8):4213–9.
17. Wakabayashi T, Sawa M, Gomi F, Tsujikawa M. Correlation of fundus autofluorescence with photoreceptor morphology and functional changes in eyes with retinitis pigmentosa. Acta Ophthalmol. 2010;88(5):e177–83. 18. Milam AH, Li ZY, Fariss RN. Histopathology of the human retina in retinitis
pigmentosa. Prog Retin Eye Res. 1998;17(2):175–205.
19. Horio N, Kachi S, Hori K, Okamoto Y, Yamamoto E, Terasaki H, et al. Progressive change of optical coherence tomography scans in retinal degeneration slow mice. Arch Ophthalmol. 2001;119(9):1329–32. 20. Robson AG, Saihan Z, Jenkins SA, Fitzke FW, Bird AC, Webster AR, et al.
Functional characterisation and serial imaging of abnormal fundus autofluorescence in patients with retinitis pigmentosa and normal visual acuity. Br J Ophthalmol. 2006;90(4):472–9.
21. PopovićP, Jarc-Vidmar M, Hawlina M. Abnormal fundus autofluorescence in relation to retinal function in patients with retinitis pigmentosa. Graefes Arch Clin Exp Ophthalmol. 2005;243(10):1018–27.
22. Robson AG, El-Amir A, Bailey C, Egan CA, Fitzke FW, Webster AR, et al. Pattern ERG correlates of abnormal fundus autofluorescence in patients with retinitis pigmentosa and normal visual acuity. Invest Ophthalmol Vis Sci. 2003;44(8):3544–50.
23. Sandberg MA, Brockhurst RJ, Gaudio AR, Berson EL. The association between visual acuity and central retinal thickness in retinitis pigmentosa. Invest Ophthalmol Vis Sci. 2005;46:3349–54.
24. Aizawa S, Mitamura Y, Baba T, Hagiwara A, Ogata K, Yamamoto S. Correlation between visual function and photoreceptor inner/outer segment junction in patients with retinitis pigmentosa. Eye (Lond). 2009; 23(2):304–8.
25. Lim JI, Tan O, Fawzi AA, Hopkins JJ, Gil-Flamer JH, Huang D. A pilot study of Fourier-domain optical coherence tomography of retinal dystrophy patients. Am J Ophthalmol. 2008;146(3):417–26.
26. Mitamura Y, Aizawa S, Baba T, Hagiwara A, Yamamoto S. Correlation between retinal sensitivity and photoreceptor inner/outer segment junction in patients with retinitis pigmentosa. Br J Ophthalmol. 2009;93:126–7. 27. Battu R, Khanna A, Hegde B, Berendschot TT, Grover S, Schouten JS.
Correlation of structure and function of the macula in patients with retinitis pigmentosa. Eye (Lond). 2015;29(7):895–901.
28. Zambarakji HJ, Schlottmann P, Tanner V, Assi A, Gregor ZJ. Macular microholes: pathogenesis and natural history. Br J Ophthalmol. 2005;89:189–93. 29. Piccolino FC, de la Longrais RR, Ravera G, Eandi CM, Ventre L, Abdollahi A,
et al. The foveal photoreceptor layer and visual acuity loss in central serous chorioretinopathy. Am J Ophthalmol. 2005;139:87–99.
30. Cai CX, Locke KG, Ramachandran R, Birch DG, Hood DC. A comparison of progressive loss of the ellipsoid zone (EZ) band in autosomal dominant and x-linked retinitis pigmentosa. Invest Ophthalmol Vis Sci. 2014;55(11):7417–22. 31. Wu Z, Ayton LN, Luu CD, Guymer RH. Relationship between retinal
microstructures on optical coherence tomography and microperimetry in age-related macular degeneration. Ophthalmology. 2014;121(7):1445–52. 32. Matsumoto H, Kishi S, Otani T, Sato T. Elongation of photoreceptor outer
segment in central serous chorioretinopathy. Am J Ophthalmol. 2008;145(1): 162–8.
33. Sugita T, Kondo M, Piao CH, Ito Y, Terasaki H. Correlation between macular volume and focal macular electroretinogram in patients with retinitis pigmentosa. Invest Ophthalmol Vis Sci. 2008;49(8):3551–8.
segment junctions and macular hole surgery outcomes. Graefes Arch Clin Exp Ophthalmol. 2009;247(3):325–30.
35. Yioti GG, Kalogeropoulos CD, Aspiotis MB, Stefaniotou MI. Contrast sensitivity and color vision in eyes with retinitis pigmentosa and good visual acuity: correlations with SD-OCT findings. Ophthalmic Surg Lasers Imaging. 2012;43(6 Suppl):S44–53.
36. LaVail MM, Yasumura D, Porrello K. Histochemical analysis of the interphotoreceptor matrix in hereditary retinal degenerations. Prog Clin Biol Res. 1985;190:179-93.
37. Duvall J, McKechnie NM, Lee WR, Rothery S, Marshall J. Extensive subretinal pigment epithelial deposit in two brothers suffering from dominant retinitis pigmentosa. A histopathological study. Graefes Arch Clin Exp Ophthalmol. 1986;224(3):299–309.
38. Brosnahan DM, Kennedy SM, Converse CA, Lee WR, Hammer HM. Pathology of hereditary retinal degeneration associated with hypobetalipoproteinemia. Ophthalmology. 1994;101(1):38–45.
39. Kuntz CA, Jacobson SG, Cideciyan AV, Li ZY, Stone EM, Possin D, et al. Sub-retinal pigment epithelial deposits in a dominant late-onset retinal degeneration. Invest Ophthalmol Vis Sci. 1996;37(9):1772–82.