Data Acquisition and Mining Algorithm of Car
Networking under Big Data Background
https://doi.org/10.3991/ijoe.v15i01.9772
Guohua Xiong
Guandong Construction Polytechnic, Guangdong, China
Abstract—In order to solve the problem of traffic jams, intelligent traffic technology and car networking technology were applied. In the context of big data, data acquisition and mining algorithms for vehicular network were studied. First, the overall architecture of the system was introduced. Then, the data acquisition technology based on the car network and the data mining technology based on the cloud plat-form were introduced. Finally, simulation experiments of real-time traffic information collection and recognition algorithms were performed. The results showed that the proposed mining algorithm had better data repair effect and better clustering effect, and the probability of misjudgment was smaller. Therefore, the algorithm can obtain accurate road traffic conditions.
Key Words—Big data, car networking, data acquisition, mining algorithm
1
Introduction
2
State of the art
Arpaia and Cimmino [1] pointed out that the goal of the car networking is to achieve fully automated driving of the car. Therefore, this requires that the car networking technology not only has the characteristics of information collection, communication, storage, and intelligence, but also has the ability of self-learning. In 2012, U.S. Google developed a driverless car that was licensed on the road. Yang et al. [2] pointed out that driverless cars incorporate multiple technologies. Through the high-speed mobile communication network, the car exchanges data with the remote cloud host in real time, so as to achieve the purpose of automatic driving. Later, the United States will make the driverless car safer through experiments. Therefore, driverless will be widely concerned and will become a part of intelligent transportation.
positioning devices on each truck. With this device, the position and speed of the vehicle are acquired. Then, these data are tapped. Finally, through the terminal equipment, real-time traffic conditions and other information are passed to the driver. This can help the driver to avoid some congestion or accidents in the road section, thereby improving transport efficiency. In addition, according to the excavated information, the data processing center can judge the current condition of the vehicle itself. For example, the vehicle currently needs to be maintained. In this way, maintenance can be avoided after a vehicle failure, which greatly improves efficiency and reduces safety risks.
In summary, there are many literatures on the study of car networking. There are also many innovative insights and rich results. The combination of big data and car networking is an inevitable trend. However, most existing researches on the application of big data in car networking still have certain deficiencies. Therefore, based on the above research status, the data collection and mining algorithms of car networking in the context of big data are studied. First, the overall architecture of the system is introduced. Then, the data collection technology based on the car network and the data mining technology based on the cloud platform are introduced. Finally, simulation experiments of real-time traffic information acquisition and recognition algorithms are performed, and the simulation results are analyzed and explained.
3
Methodology
3.1 The introduction of car networking
Car networking technology is the application of the Internet of Things technology in the car and is a branch of the Internet of Things technology. Therefore, the car networking system also mainly follows the architecture of the Internet of Things. The car networking architecture mainly includes three layers: the perception layer, the network layer, and the application layer.
The role of the sensory layer in car networking is equivalent to the role of "nuclei" in the human body. Using radio frequency identification technology RFID, GPS positioning technology, various sensor devices and video equipment, the sensing layer realizes the real-time perception and detection of vehicle driving conditions and driving environment. Then, it collects and obtains information such as the driving behavior of the driver, the condition of the vehicle, and the driving environment of the vehicle during driving. This provides the data foundation for the later data analysis phase.
The role of application layer in car networking is equivalent to the "body" and "four limbs" of the human body. It summarizes the results of data processing in the cloud platform and has been applied in various fields. Therefore, the car networking application layer is the driving force for the continuous advancement of car networking technology. Car networking has good application prospects in traffic management, personal driving behavior, auto insurance and entertainment information services.
3.2 The overall architecture of the system
There is already a lot of research on real-time traffic information systems. However, there is relatively little introduction to the complete application of car networking technology in real-time traffic information systems. Therefore, a brief introduction to the real-time traffic information system architecture based on car networking will be provided. The system architecture is based on the end-pipe-cloud architecture of car networking. It includes three subsystems, namely the end system, the management system and the cloud system. The management system is mainly used to collect vehicle driving information. The management system then passes the collected data over the communication network to the cloud system. The cloud system stores, processes, monitors, and analyzes data transmitted from the management system. The main function of the end system is to display relevant information such as real-time road conditions to the user through a mobile terminal or some on-board terminals. The overall architecture of the system is shown in Figure 1.
Fig. 1. The overall architecture of the system
3.3 Real time traffic information perception and acquisition technology based on vehicle interconnection
The collection of traffic information refers to the acquisition of traffic information data on the road through various acquisition methods. Traffic information mainly includes static traffic information and dynamic traffic information. Static traffic information refers to the fixed state information in the road, including fixed data such as the length of the road section in the road network, the layout of the intersection, and the number of lanes. Dynamic traffic information refers to information that
Car cloud platform
PC、Phone Car
Cloud
End Tube
Network
Network
changes over time, such as vehicle speed, traffic volume, and traffic events. In the collection of traffic information, due to the static nature of the traffic information, its acquisition is relatively simple. However, the collection of dynamic traffic information is difficult. Therefore, the current research focuses on dynamic traffic information collection.
Dynamic traffic information collection methods are mainly divided into two types, namely, fixed information acquisition and mobile information collection. Fixed information acquisition methods mainly include ground coils and infrared detection. These technologies are now quite mature and have been widely used. However, there are many shortcomings in the fixed information acquisition equipment, which can no longer meet the current data requirements. Mobile acquisition has become a widely used method of information collection. With the increase in the number of cars and the development of car networking technology, the main research hotspot information collection method is floating car technology.
A floating car is an ordinary vehicle equipped with a global positioning system and wireless communication equipment. These vehicles can record information such as vehicle position, driving direction, and vehicle speed during driving. Then, this information is passed to the data processing center, which analyzes the data according to various data models and algorithms to associate the floating car with the road. In the end, the average speed and status of the floating car on the road section were obtained. According to the characteristics of the use of vehicles, floating cars can be divided into private cars, buses, taxis, official vehicles and other special vehicles.
Several related technologies based on information acquisition of floating vehicles mainly include GPS positioning technology, RFID technology, and sensor technology. GPS is the global positioning system. It is a satellite-based radio positioning navigation system developed by the United States. GPS positioning technology can be divided into two kinds of services according to the nature of applications, namely, military services and civil services. The GPS system can provide location, speed and direction, and time information. Nowadays, daily life is inseparable from GPS positioning. For example, vehicle navigation systems are now installed in cars, which can provide users with navigation functions.
RFID, also known as radio frequency identification, is a wireless communication technology that originated in radar technology. RFID technology does not require direct contact with objects. It can automatically identify objects and obtain relevant information only through the coupling of RF signals. The advantage of radio frequency identification technology is that the recognition speed is fast, the operation is simple, and it can work in a relatively bad environment.
element. Since the Internet of Things is based on sensors for information collection, sensors determine the success or failure of the Internet of Things.
3.4 Data mining technology based on cloud platform
The cloud platform is a platform for aggregating, storing, analyzing, and scheduling large amounts of data. In a real-time traffic information system, it stores, analyzes, mines, and applies real-time traffic data to provide real-time road traffic status.
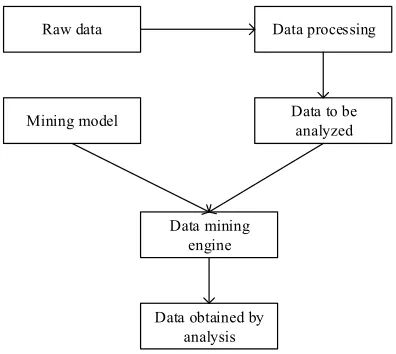
There are ten classic algorithms in data mining algorithms. They are C4.5 classification decision tree algorithm, K-means clustering algorithm, support vector machine, association rule algorithm, EM (Expectation Maximization) maximum expectation algorithm, Naive Bayes algorithm, CART classification algorithm, PageRank algorithm, AdaBoost algorithm, and K nearest neighbor classification algorithm. There are many studies based on these algorithms. These algorithms are constantly being improved. Data mining goes through three phases: data preparation, data mining, and results analysis. The specific process is shown in Figure 2.
Fig. 2. Data mining process
With the rapid development of information technology, data is now growing exponentially. Finding valuable information from vast amounts of data is currently a hot topic of research. Data mining algorithms take longer to process large amounts of data. Sometimes, the processing of massive data cannot be completed. Therefore, many data mining operations are now performed on the cloud platform using big data-related technologies, thereby speeding up data processing and analysis.
Raw data
Mining model Data to be analyzed
Data obtained by analysis Data mining
engine
4
Result Analysis and Discussion
4.1 Information collection and processing technology of vehicle network based on floating car
GPS positioning system uses satellite systems to achieve geographic location. Each location on the earth can be monitored by four satellites at the same time. The GPS device on the vehicle terminal will measure the propagation time of the satellite signal in real time after receiving the satellite signal. The latitude and longitude of the floating car and the instantaneous speed of the vehicle are calculated. The data is stored and then processed together with the differential correction data. The wireless communication module then transmits the acquired data to the information processing platform and also receives the information transmitted from the information processing platform.
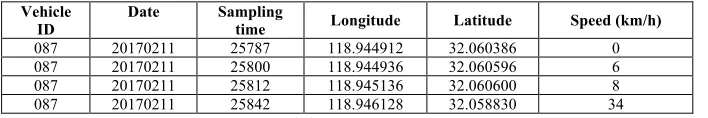
The collected GPS data should have its own standard storage format. Each GPS record should include data such as latitude and longitude, instantaneous speed, sampling time, and vehicle ID of the location of the vehicle.
After the data is stored in the specified storage format, the data needs to be cleaned. Data cleaning can generally be divided into two types. One is to clean the signals that are disturbed by noise. This cleaning is to eliminate noise and it belongs to the cleaning of normal data. The other is cleaning the abnormal raw data that is inconsistent, erroneous and repetitive. This is the cleaning of abnormal data. The cleaning process is actually a process of verifying whether the data follows certain rules. These rules are set through scientific research and experience. The storage format of the cleaned vehicle GPS data is shown in Table 1.
Table 1. Storage format of vehicle GPS data
Vehicle
ID Date Sampling time Longitude Latitude Speed (km/h) 087 20170211 25787 118.944912 32.060386 0 087 20170211 25800 118.944936 32.060596 6 087 20170211 25812 118.945136 32.060600 8 087 20170211 25842 118.946128 32.058830 34
4.2 FCM algorithm based on speed change characteristics
The Xie-Beni indicator (XB indicator) is used to dynamically and adaptively determine the value of m.
The FCM algorithm is one of the clustering algorithms. It allows one data to belong to two or more clusters at the same time, instead of confining the data to only one cluster. Probabilistic coefficients can be used to represent this feature. Data collection is clustered. The objective function of this algorithm is shown in formula (1).
. (1)
In formula (1), is the j-th sample data. is the cluster center of the i-th cluster. is the degree of membership of in cluster i. N represents the number of samples. c represents the number of clusters.
4.3 Traffic state recognition based on improved fuzzy c means clustering algorithm
Traffic lights will cause temporary parking of cars. From the average speed of the cluster, it also has the characteristics of traffic congestion. However, this short-term congestion and real congestion are different in terms of congestion length and congestion time. Therefore, this feature is used to determine whether the congestion is caused by the temporary stop of the car. The threshold for the length of traffic jams is related to time, location, and so on. The threshold of traffic congestion needs to be dynamically changed according to a specific environment. A J48 decision tree classification model based on training set was used. The classification model mainly includes two steps: The first is to use the binary traffic output algorithm (BTOA) to obtain the length of congestion on the congested area and to determine the location of the traffic lights. The second is to use the J48 decision tree algorithm to update the previous classification model.
The main idea of BTOA is to first calculate the average speed V0 within each cluster. If the speed is within the speed threshold when the traffic is congested, the length m of the current cluster is added to the congestion length L. The algorithm ends when all the clusters are compared or the state in the next cluster is no longer congested. Finally, the obtained congestion length L is compared with the traffic congestion length threshold L0. If L<L0, it is determined that the current area is a temporary parking of the car; otherwise, it is determined to be a congested area.
4.4 Simulation and analysis of information collection and processing technology of vehicle network based on floating car
The data is GPS data collected within 30 days of the road section, and these data are provided by Jiangsu Nanyi Dina Technology Co., Ltd. Only 57 road sections are
1
1 1
( , , , )
c N mm c ij j i
i j
J U V
V
µ
x V
= =
=
åå
×
-!
j
x
V
iij
considered here and the 57 road sections will be used to establish a network of adjacent road nodes. As these sections are within the urban roads, the maximum speed is not more than 40km/h according to regulations. Because the laws of vehicle speed and speed on roads on working days and weekends are different, they should be studied separately. There are few vehicles on the road every morning and late at night. Only data from 6:00 am to 22:00 pm from Monday to Friday will be studied. Due to information collection equipment and weather reasons, there may be incorrect data in the collected traffic information. Table 2 shows some of the driving data of a certain vehicle obtained. Because there are too many data, only a small number of data are displayed here.
Table 2. Raw GPS data
Vehicle
ID Longitude Latitude (km/h) Speed Vehicle ID Longitude Latitude (km/h) Speed 1 118.80133 32.00833 16.78 6 118.80192 32.01053 21.88 2 118.80116 32.00847 18.05 7 118.80284 32.01181 -2.35 3 118.80112 32.00858 18.76 8 118.80437 32.01315 23.73 4 118.80113 32.00866 19.17 9 118.80464 32.01356 22.18 5 118.80116 32.00878 19.78 10 118.80492 32.01439 22.28
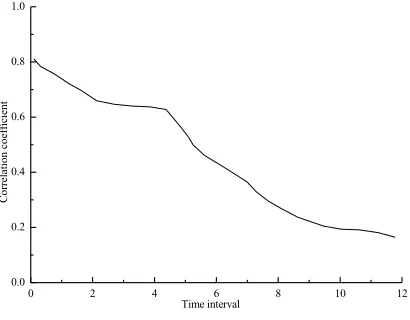
In the previous analysis, it can be seen that the speed of the floating car has a certain correlation between the adjacent time and the adjacent space. As time or space distance changes, the correlation between these data also changes. Figure 3 and Figure 4 show the relationship between traffic information data and time and distance on a certain road section. From Figure 3, it can be seen that the correlation between data is getting smaller and smaller with the continuous extension of time. Figure 4 also shows the same rule. The greater the distance between two road segments, the smaller the correlation coefficient between the data on the road segments.
Fig. 3. Relationship between traffic data and time
0 2 4 6 8 10 12
0.0 0.2 0.4 0.6 0.8 1.0
Cor
rel
at
ion
coef
fici
ent
Fig. 4. Correlation between traffic data and road segment distance
It can be seen from Figures 3 and 4 that the collected traffic data does have a correlation in both time and space, and this correlation will decrease with time or distance. Therefore, when the traffic data is repaired, if the temporal correlation and spatial correlation between the traffic data are comprehensively considered, the repaired data result is more accurate. When the data is missing in time series, its spatial correlation can be used to repair it.
4.5 Simulation and analysis of traffic state recognition based on improved fuzzy c means clustering algorithm
The problem of traffic congestion is getting worse. Especially around the holidays, the overall traffic conditions are relatively slow. Figure 5 shows the average speed of the peak period around the Mid-Autumn Festival in 2016. Vehicles are basically in a state of slowness and congestion. Therefore, it is very important to identify road traffic conditions.
1 2 3 4 5 6
0.0 0.2 0.4 0.6 0.8 1.0
Cor
rel
at
ion
coef
fici
ent
Fig. 5. The average speed of the peak period around the Mid-Autumn Festival in 2016
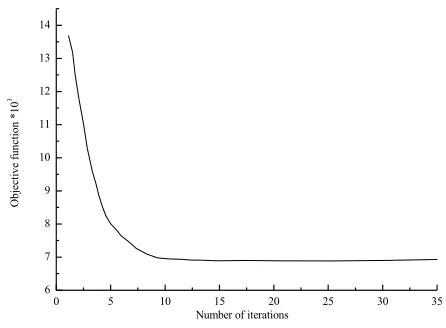
In the identification of road traffic conditions, many studies are based on the k-means clustering algorithm and the FCM algorithm. The reason why the FCM algorithm is adopted is mainly due to the ambiguity in the traffic state itself. Therefore, the FCM algorithm is more appropriate than the k-means clustering algorithm. The FCM algorithm determines the type of the sample based on the degree of membership between the sample data and the cluster center. The k-means clustering is based on the Euclidean distance between the sample data and the cluster center. For this phenomenon, Canopy-based FCM algorithm and Canopy-based k-means clustering algorithm are compared. Figure 6 compares the miscalculations of the two algorithms when clustering data. It can be seen from the figure that the probability of misjudgment based on Canopy's FCM algorithm is smaller and the clustering effect is better. The clustering process of the improved FCM algorithm is convergent. Figure 7 shows the convergence of the algorithm.
9.12 9.13 9.14 9.15 9.16 9.17 9.18 17
18 19 20 21 22 23 24
Km
/h
Fig. 6. Comparison of sample misjudgment based on two improved clustering algorithms
Fig. 7. The convergence process of the algorithm
The clustering algorithm can divide roads into clusters and calculate the average traffic speed in each cluster. Then, according to the BTOA algorithm and the corresponding road traffic condition evaluation standard, the traffic conditions in the area are determined, such as very congested, congested, slow and smooth. Figure 8 shows the effect of traffic distribution at 2:30 pm in a certain area of a city. Here, different colors represent different traffic conditions. In order to be consistent with the
Open Slow down Traffic jam Serious congestion 0
20 40 60 80
100 Sample number
K mean clustering based on Canopy Fuzzy C mean clustering based on Canopy
0 5 10 15 20 25 30 35
6 7 8 9 10 11 12 13 14
O
bj
ect
ive
funct
ion
*10
3
daily subjective understanding, green represents smooth flow, yellow represents slow motion, red represents congestion, and purple represents very heavy traffic.
Fig. 8. Distribution of real time road traffic
5
Conclusion
Firstly, the real-time traffic information data acquisition method based on floating car and the characteristics of initial traffic data are introduced. Then, the improved FCM algorithm was introduced. According to the characteristics of the original traffic data, a suitable data storage format was designed. According to the space-time characteristics of traffic data, a dynamic adaptive data restoration algorithm is proposed and simulated. Experimental results show that the algorithm can effectively repair the data. The data repair performance is obviously better than the time and space data repair models. Through simulation, it can be seen that the improved FCM algorithm has a better clustering effect and a lower probability of misjudgment.
6
References
[1]Arpaia, P., Cimmino, P. (2016). Flexible architecture of data acquisition firmware based on multi-behaviors finite state machine. Review of Scientific Instruments, 87(11): 21-24
https://doi.org/10.1063/1.4967467
[2]Yang, C., Zheng, W., Zhang, M.,Yuan, T. (2016). A real-time data acquisition and processing framework based on flexrio fpga and iter fast plant system controller. IEEE
Transactions on Nuclear Science, 63(3): 1715-1719 https://doi.org/10.1109/
TNS.2016.2542858
[3]Wu, X., Chen, H., Zhang, Q., Zhang, S., Wu, G., Liu, J., et al. (2015). Knowledge engineering with big data. IEEE Intelligent Systems, 30(5): 46-55 https://doi.org/10.1 109/MIS.2015.56
[4]Jang, J., Yang, Y., Smyth, A. W., Cavalcanti, D., Kumar, R. (2016). Framework of data acquisition and integration for the detection of pavement distress via multiple vehicles. Journal of Computing in Civil Engineering, 31(2): 04016052
[5]Lin, K. C., Zhang, K. Y., Huang, Y. H., Hung, J. C., Yen, N. (2016). Feature selection based on an improved cat swarm optimization algorithm for big data classification. Journal of Supercomputing, 72(8): 3210-3221 https://doi.org/10.1007/s11227-016-1631-0
[6]Altmann, Y., Ren, X., Mccarthy, A., Buller, G., Mclaughlin, S. (2016).
Lidar waveform based analysis of depth images constructed using sparse single-photon data. IEEE Transactions on Image Processing, 25(5): 1935-1946
https://doi.org/10.1109/TIP.2016.2526784
[7]Tian, J., Yu, B., Yu, D., Ma, S. (2014). Missing data analyses: a hybrid multiple imputation algorithm using gray system theory and entropy based on clustering. Applied Intelligence, 40(2): 376-388 https://doi.org/10.1007/s10489-013-0469-x
[8]Peng, Z., Peng, J., Zhao, W., Chen, Z. (2015). Research on fcm and nhl based high order mining driven by big data. Mathematical Problems in Engineering, 2015(4): 1-7
https://doi.org/10.1155/2015/802505
7
Authors
Guohua Xiong is a Researcher of Guandong Construction Polytechnic, Guangdong, China. His research interests include Car Networking.