2001 Biological Procedures Online. All rights reserved. Paper-based copying and internal distribution permitted for educational or non-profit purposes. Printing for personal use permitted. Electronic copying, storage or redistribution prohibited.
A fluorescence microscopy method for quantifying the detection of prostaglandin
endoperoxide H synthase-1 and CD-41 in MEG-01 cells
Douglas J. Franks
1*Cameron Mroske
2and Odette Laneuville
21Department of Pathology and Laboratory Medicine, 2Department of Biochemistry, Microbiology and Immunology, Faculty of
Medicine, University of Ottawa, 451 Smyth Road, Ottawa, Canada, K1H 8M5
*To whom correspondence should be addressed: Douglas J. Franks, Department of Pathology and Laboratory Medicine, Faculty of
Medicine, University of Ottawa, 451 Smyth Road, Ottawa, Ontario, Canada, K1H 8M5 Tel: (613) 562-5800 ext. 8330; Fax: (613) 562-5442; Email:[email protected]
Submitted: August 15, 2001; Accepted: November 12, 2001; Published: December 12, 2001 Indexing terms: immunocytochemistry, fluorescence microscopy, cell differentiation
ABSTRACT
In platelets, PGHS-1-dependant formation of thromboxane A2
is an important modulator of platelet function and a target for pharmacological inhibition of platelet function by aspirin. Since platelets are anucleated cells, we have used the immortalized human megakaryoblastic cell line MEG-01, which can be induced to differentiate into platelet-like structures upon addition of TPA as a model system to study PGHS-1 gene expression. Using a specific antibody to PGHS-1 we have developed a technique using immunofluorescence microscopy and analysis of multiple digital images to monitor PGHS-1 protein expression as MEG-01 cells were induced to differentiate by a single addition of TPA (1.6 x 10⁻⁸M) over a period of 8 days. The method represents a rapid and economical alternative to flow cytometry. Using this technique we observed that TPA induced adherence of MEG-01 cells, and only the non-adherent TPA-stimulated cells demonstrated compromised viability. The differentiation of MEG-01 cells was evaluated by the expression of the platelet-specific cell surface antigen, CD-41. The latter was expressed in MEG-01 cells at the later stages of differentiation. We demonstrated a good correlation between PGHS-1 expression and the overall level of cellular differentiation of MEG-01 cells. Furthermore, PGHS-1 protein expression, which shows a consistent increase over the entire course of differentiation can be used as an additional and better index by which to monitor megakaryocyte differentiation.
INTRODUCTION
The enzyme prostaglandin endoperoxide H synthase (PGHS) catalyses the synthesis of prostaglandin H2 (PGH2), which is
then converted in platelets to the potent aggregatory substance thromboxane A2[1]. Study of the PGHS enzyme is important
because it is the pharmacological target for aspirin. Two PGHS isozymes, PGHS-1 and PGHS-2, are known to exist [1-3] and each is encoded by a different gene. PGHS-1 and PGHS-2 both catalyze the conversion of arachidonic acid to PGH2, and the
activity of both enzymes is inhibited by aspirin [4,5]. The major difference between the two PGHS isozymes is in their expression. PGHS-2 is undetectable in most resting tissues [6]. However, PGHS-2 expression is induced in response to inflammation [7] and it is therefore referred to as the inducible form of the enzyme [6]. In contrast, PGHS-1 is detectable in most tissues and is therefore the constitutive form of the enzyme [6].
Treatment of suspension cultures of MEG-01 cells with TPA (12-0-tetradecanoylphorbol-13-acetate) induces some of the cells to adhere to the substratum and to begin a process of differentiation that terminates after 7 to 10 days [13]. Using DAPI (4’,6-diamidino-2-phenylindole) as a fluorescent nuclear marker, we assessed cell number and specific antibodies to PGHS-1 and CD-41 in order to identify cells expressing these two megakaryocyte differentiation markers in both adherent and non-adherent cells in control and TPA-treated MEG-01 cells.
Flow cytometry is undoubtedly the best technique for the quantification of data from fluorescent labeled cells. However flow cytometry of multiply labeled cells is often technically difficult. We used DAPI as a nuclear label so as to achieve sufficient color separation between nuclei and PGHS-1, which is a cytosolic enzyme. Our flow cytometer is not equipped with a UV laser, and therefore was not able to detect DAPI fluorescence. Therefore, it would not have been possible for us to perform the type of study proposed by flow cytometry. As an alternative, we developed a quantitative fluorescence microscopic technique using extensive image analysis that enabled us to obtain quantitative data that clearly showed that PGHS-1 expression is an excellent marker of early megakaryocyte differentiation.
MATERIALS AND METHODS
Materials
Polyclonal rabbit-anti PGHS-1 IgG raised against the ovine PGHS-1 amino acid sequence L272-Q283 (LMHYPRGIPPQ-C) which is 100% identical to the corresponding human peptide sequence was a gift from Dr. W.L. Smith, Michigan State University and was at a stock concentration of 0.5 mg/mL. Monoclonal mouse anti-human platelet CD41 (5B12) was obtained from DAKO (Carpintera, CA). Rhodamine-conjugated donkey-anti rabbit IgG (H+L) and Cy3-Rhodamine-conjugated secondary donkey-anti-mouse IgG (H+L) were purchased from Jackson ImmunoResearch Laboratories, Inc. (West Grove, PA).
Cell Culture
MEG-01 cells were obtained from the American Type Culture Collection (ATCC, Manassas, VA). Cells for immunolabelling studies were seeded at a concentration of 2 x 10⁵cells/mL into Falcon 6-well tissue culture dishes containing 18 mm2 glass coverslips or 75 cm2tissue culture flasks containing 40 mL of RPMI 1640 supplemented with 10% FBS in the absence of antibiotics. In each case, the spent media was partially replaced with fresh RPMI 1640 supplemented with 10% FBS every 4 days. Prior to analysis, the cells were cultured inside a humidified incubator for 2 weeks in an atmosphere of 5% CO2
and air at a temperature of 37oC. When indicated cultures were treated with TPA dissolved in dimethylsulphoxide (DMSO) at
a final concentration of 1.6 x 10⁻⁸ M. Controls were treated with DMSO vehicle.
Separation of cell populations
MEG-01 cells in culture form three distinct populations; nucleated cells that remain in suspension in the culture media, nucleated cells that adhere to the substratum, and anucleated platelet-like structures. In order to harvest the three cell populations separately, the non-adherent cells were first collected by removing the liquid media. Adherent cells were rinsed once with culture media and the liquid media is pooled with the non adherent fraction. The adherent cells are scraped with a plastic policeman and resuspended in fresh media. Platelet-like structures were then isolated from the non-adherent and the non-adherent cell fractions by centrifugation [14]. Each fraction was centrifuged at 330 g for 5 min. to collect the nucleated cells. The supernatants were centrifuged at 900 g for 15 min. to collect the anucleated platelet-like structures. Following centrifugation, pellets were washed three times in PBS and fixed for immunocytochemistry.
Immunocytochemistry
Detection of intracellular PGHS-1 was carried out by indirect immunofluorescence. Adherent cells on coverslips were rinsed in PBS and fixed with 2% paraformaldehyde in PBS for 45 min. The coverslips were then washed in PBS/10% FBS three times for 5 min. Coverslips were incubated in a humid chamber with polyclonal rabbit anti-PGHS-1 at a concentration of 0.01 mg/mL in the presence of PBS, 2% saponin, and 10% FBS. Following the incubation with primary PGHS-1 antibody, the coverslips were washed 3 times in PBS/10% FBS for 5 min. The coverslips were washed twice more in PBS/10% FBS, once in PBS and mounted onto microscope slides in 15µL of Permafluor mounting media. In order to assess nonspecific binding of the secondary antibody, the same procedure was carried out in the absence of primary antibody. Anti-PGHS-1 antibody incubated with the antigenic peptide was also used as a negative control.
For detection of CD-41, cells grown on coverslips were fixed in Zamboni’s fixative (4% formaldehyde/14% picric acid in PBS) for 45 min, washed in PBS and incubated in a humid chamber for 45 min with monoclonal mouse anti-hCD-41 at a 1:100 dilution in PBS. The coverslips were then incubated in a humid chamber for a further 45 min. with Cy3-labeled secondary donkey anti-mouse IgG diluted 1:150 in PBS. After three further washes in PBS the coverslips were incubated for 2 min. with DAPI (5µg/mL) and mounted on glass microscope slides in 15 µL of Permafluor. Nonspecific binding was assessed in coverslips that were labeled with secondary antibody only.
re-centrifuged and re-suspended in 5 mL of PBS. 0.5 mL aliquots of the cell suspensions were plated onto 18 mm2 1.5 glass coverslips that had been previously incubated at room temperature for 10 min. with 1 mg/mL poly-L-lysine and attached by further incubation for 1 min at room temperature. The attached cells were fixed in paraformaldehyde/PBS and labeled with anti-PGHS-1 and DAPI as described above.
Assessment of viability of adherent MEG-01 cells was performed on cells grown on glass coverslips. Cells were rinsed in PBS and incubated with propidium iodide (50µg/mL) for 5 min. Coverslips were then rinsed three times in PBS and fixed in 2% paraformaldehyde in PBS for 45 min. The cells were then washed three more times in PBS for 5 min and then incubated for 2 min. with DAPI (5µg/mL) The coverslips were washed twice more in PBS before being mounted onto microscope slides in 15 µL of Permafluor mounting media. Non-adherent MEG-01 cells were attached to poly-L-lysine coated coverslips as described above and the coverslips were processed in the same way as for adherent MEG-01 cells.
Fluorescence Microscopy
Direct and indirect fluorescence of cells on coverslips were viewed with an Olympus BX50 microscope. Images were captured with a Sony CCD monochrome camera. DAPI fluorescence of nuclei was visualized by excitation at 330-385 nm with a 420 nm barrier filter. Rhodamine and Cy3 fluorescence was visualized by excitation at 510-550 nm with a barrier of 590 nm. For analysis all images were viewed and captured at 200X magnification. Triplicate slides were prepared at each time point, and for each slide, triplicate 425 x 425 micron fields were randomly selected containing 100 to 300 cells. The same field was used to identify total cells and cells expressing PGHS-1 and CD-41. Image analysis was performed using Image-Pro Plus (Media Cybernetics, Silver Spring, Maryland).
(Sections reprinted from [15] "Characterization of prostaglandin endoperoxide H synthase-1 enzyme expression during differentiation of the megakaryocytic cell line MEG-01" by Mroske et al. in Experimental Hematology. 2000; 28: 411-421. Copyright (2000), with permission from Elsevier Science.)
RESULTS AND DISCUSSION
PGHS-1 expression during megakaryocyte
differentiation.
We first attempted to determine if the overall level of PGHS-1 enzyme increase as MEG-01 cells are induced to differentiate into platelet-like structures. We separated PGHS-1 by SDS-PAGE from the three populations of cells forming cultured MEG-01cells. PGHS-1 migrates as a 70 kDa band and we quantified the level of the enzyme by calculating the ratio of
the PGHS-1 band intensity over that ofµ-tubulin for each cell population. In control cells, the levels of PGHS-1 enzyme were 5 times higher in the platelet fraction and 2 times higher in the adherent fraction compared to the floating cells [15]. After 8 days of TPA treatment, the level of PGHS-1 enzyme increased in the three cell populations and the platelet fraction, which represents the latest stage of differentiation, contained the greatest amount of enzyme compared to the less differentiated cells found in the non-adherent fraction. Thus, by separating the three cell populations forming MEG-01 cells in culture we established that the levels of PGHS-1 enzyme correlated with the differentiation state of these cells; i.e., the more differentiated were the cells the greater were the levels of PGHS-1 [15].
fluorescence and rhodamine fluorescence (for PGHS-1) were collected.
A B
C D
Fig. 2: Phase contrast and immunofluorescence images (400X magnification) of adherent MEG-01 cells treated with TPA for 4 days. A: Phase contrast image. Arrows show MEG-01 cells with unusual morphology. B: Dapi fluorescence image of same field. Red arrow, binucleated MEG-01 cell; yellow arrow, multinucleate MEG-01 cell. C: Rhodamine fluorescence for PGHS-1 of same field. Yellow arrows indicate fluorescence intensity above threshold; green arrows indicate fluorescence below threshold. D: Cy3 fluorescence for CD-41. Note the predominately plasma membrane localization. Yellow arrows indicate fluorescence intensity above threshold; green arrows indicate fluorescence below threshold.
Determination of total cells was relatively straightforward. MEG-01 cells are nucleated, thus treatment with DAPI labeled the nuclei in all cells. However as differentiation progressed the adherent cells undergo marked changes in morphology (Fig. 2A) and in the late stages of differentiation develop irregular shaped, lobular or fragmented nuclei (Fig. 2B.). TPA-treated MEG-01 cells also become polyploid [16]. Thus, the DAPI staining of the nuclei was not uniform in intensity. By inverting the image and applying a local equalization filter with a narrow pixel window we were able to enhance pixel contrast and correct for the difference in labeling intensity. Application of a 5x5 kernel size low pass filter at full strength softened the image so that lobular and fragmented nuclei were merged into a single object. To eliminate pixel noise from the camera and spurious fluorescence we only accepted objects that had a size greater than 30µm2.
PGHS-1 fluorescence was uniform and localized throughout the cytoplasm of MEG-01 cells (Fig. 2C). Thus, to estimate the number of cells expressing PGHS-1 we used the outline
obtained from the DAPI fluorescence image and applied it to the rhodamine fluorescence image. No image filtering was applied. The appropriate grayscale threshold value was obtained by taking the average pixel intensity obtained from fields of MEG-01 cells that were not incubated with primary antibody. Only objects having an average pixel value above this threshold were counted. Thus, only the cells that expressed PGHS-1 were counted.
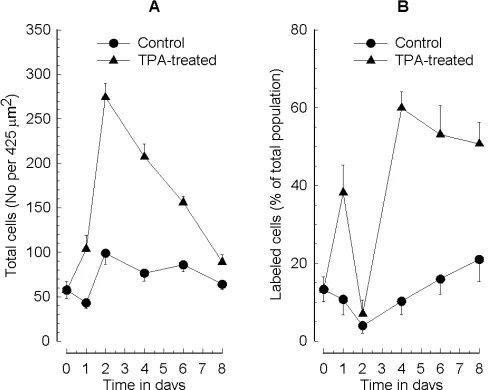
The results obtained for adherent cells are shown in Fig. 1. Some control MEG-01 cells did adhere to the substratum by 2 days (Fig. 1A). By contrast, TPA-treated MEG-01 cells rapidly adhered to the substratum and adherence was maximal at 2 days (Fig. 1A). Subsequently the number of adherent cells declined so that by 8 days the number of adherent cells approached the control value. In control MEG-01 cells, there was a gradual increase in PGHS-1 expression after 2 days but it never reached more than 20% of the total cell number (Fig. 1B). However, in TPA-treated MEG-01 the percentage of cells expressing PGHS-1 decreased at 2 days and then increased to 60% at 4 days and remained at this level up to 8 days (Fig. 1B). On first examination, the decrease in the percentage of cells expressing PGHS-1 in TPA-treated MEG-01 cells at day 2 appeared surprising. However, from the data in Fig. 1A, day 1 to 2 is the period of maximum adherence, hence the total number of MEG-01 cells is rapidly increasing without any change in PGHS-1 expression. Therefore, the increase in PGHS-1 expression does not in fact begin until after adherence is complete. Thus a decrease in the percentage of cells staining positive for PGHS-1 at day 2 would be expected.
The above results strongly indicated that PGHS-1 expression was associated with adherence to the substratum. Nevertheless, we wanted to determine whether there was an increased PGHS-1 expression in the non-adherent cells. We used the same image analysis algorithm for this analysis even though the analysis of these cells was simpler, since because they were suspension cultures their DAPI fluorescence was more uniform. As would be expected none of the non-adherent cells showed significant PGHS-1 staining (data not shown).
CD-41 protein expression during megakaryocyte
differentiation
we were able to normalize the fluorescence intensity and identify all the Cy3 labeled cells. Application of a 5x5 kernel size low pass filter at full strength softened the image and eliminated noise. This outline was then applied to the original Cy3 fluorescence image. The appropriate grayscale threshold value was obtained by taking the average pixel intensity obtained from fields of cells that were not incubated with primary antibody. Only objects having an average pixel value above this threshold were counted. To eliminate noise and spurious fluorescence only objects having a size greater than 60µm2were accepted. Thus, only the cells that expressed CD-41 were counted.
The results obtained for adherent cells are shown in Fig. 3. CD-41 expression occurred much later in MEG-01 cell differentiation than PGHS-1. There was no significant increase in CD-41 expression until after day 6 in both control and TPA-treated MEG-01 cells. In contrast to PGHS-1 enzyme, there was little effect of TPA treatment on CD-41 expression. In fact, in TPA-treated cells CD-41 expression actually started later than in the controls, though the same number of positively stained cells (35%) was reached in both control and TPA-treated by day 8.
We conclude that PGHS-1 enzyme is a much better indicator of TPA-induced megakaryocyte differentiation than the platelet-specific cell surface marker CD-41 [9]. CD-41 is thought to be expressed on the plasma membrane of very mature megakaryocyte cells prior to platelet release [17,18]. CD-41
staining may be a poor marker of differentiation in MEG-01 cells since the cells may never reach this level of maturity. In non-adherent MEG-01 cells there was insignificant staining of CD-41 in either control or TPA-treated cells (data not shown).
MEG-01 cell viability
Given the fact that the number of both adherent and non-adherent TPA-treated MEG-01 cells decreased over the 8 day time course we wanted to determine whether the cells remained viable during this time. To do this MEG-01 cells were incubated with propidium iodide prior to fixation. Since propidium iodide is not permeable to viable cells, only cells having compromised membrane integrity would be labeled. The cells were then fixed and incubated with DAPI to label the entire cell population. DAPI and propidium iodide fluorescent images were collected and analyzed in the same way as for PGHS-1. To eliminate noise only propidium iodide labeled cells with an average pixel value greater than 50 were counted.
There was no loss of viability in either control or TPA-treated adherent MEG-01 cells (data not shown). Nevertheless, the data in Fig. 1A indicate that in TPA-treated MEG-01 cells, the number of adherent cells decreases after 2 days even though the percentage of cells expressing PGHS-1 remains constant. We assume that cells that adhere but do not achieve any significant PGHS-1 expression must detach from the substratum and are lost when the coverslips are washed prior to Fig. 3: Time course of CD-41 expression in control and
TPA-treated adherent MEG-01 cells. Values at each time point were obtained by determining the mean ± SE of three separate fields from three individual slides. Reprinted from [15] "Characterization of prostaglandin endoperoxide H synthase-1 enzyme expression during differentiation of the megakaryocytic cell line MEG-01" by Mroske et al. in Experimental Hematology. 2000; 28: 411-421. Copyright (2000), with permission from Elsevier Science.
fixation. We did not follow this population, but it is probable that these cells are non viable since substantial apoptosis-like morphology is seen in MEG-01 cells in the later stages of differentiation. As shown in Fig. 4, 80% of the TPA-treated non-adherent MEG-01 cells lost viability after 2 days, whereas there was a very slight (10%) loss of viability in the control.
Conclusions
We have established an immunocytochemical and image analysis method by which the number of cells expressing the enzyme PGHS-1 can be monitored throughout the differentiation of megakaryoblastic cells into platelet-like structures. This method also allowed us to simultaneously monitor the expression of CD-41 a known marker of megakaryocyte differentiation. Cell number and viability could also be determined. The method presents a viable alternative to flow cytometry since the cost is minimal and requires only a fluorescence microscope and video camera. Once the images are collected, the analysis can be automated and can be performed in a minimum amount of time.
The two main observations we have made with this technique are. 1; PGHS-1 enzyme expression is higher in the more differentiated population of 01 cells and 2; when MEG-01 cells are induced to differentiate upon addition of TPA, the expression of PGHS-1 enzyme increases only in the adherent cell populations that are destined to differentiate into platelet-like structures. Relative to CD-41, a widely used marker of megakaryocyte differentiation, PGHS-1 enzyme expression increases consistently over the entire course of differentiation. It has been suggested that non-adherent MEG-01 cells remain at an earlier stage of differentiation than adherent cells based on morphological and biochemical criteria including the expression of the glycoprotein Ib [13]. Our results on PGHS-1 expression strongly support this premise. MEG-01 cells in culture represent a useful model to study maturation mechanisms and differentiation in vitro. The process appears to be complete in that formation of platelet-like structures occurs but with a lower efficiency compared to the in vivo situation [19, 20].
ACKNOWLEGEMENTS
Supported by the Medical Research Council of Canada by a grant in aid of research to Odette Laneuville.
REFERENCES
1. Smith WL, Laneuville O. 1994. Cyclooxygenase and lipoxygenase pathways of arachidonic acid metabolism. In Prostaglandin Inhibitors in Tumor Immunology and Immunotherapy. Harris JE, Braun D, Anderson K, editors CRC Press, London. 1-18.
2. Kujubu DA, Reddy ST, Fletcher BS, Herschman HR. Expression of the protein product of the prostaglandin
synthase-2/TIS10 gene in mitogen-stimulated Swiss 3T3 cells. Journal of Biological Chemistry 1993;268:5425-5430.
3. Kujubu DA, Fletcher BS, Varnum BC, Lim RW, Herschman HR. TIS10, a phorbol ester tumor promoter-inducible mRNA from Swiss 3T3 cells, encodes a novel prostaglandin synthase/cyclooxygenase homologue. Journal of Biological Chemistry 1991;266:12866-12872. 4. DeWitt DL, El-Harith EA, Kraemer SA, Andrews MJ,
Yao EF, Armstrong RL, Smith WL. The aspirin and heme-binding sites of ovine and murine prostaglandin endoperoxide synthases. Journal of Biological Chemistry 1990;265:5192-5198.
5. Lecomte M, Laneuville O, Ji C, DeWitt DL, Smith WL. Acetylation of human prostaglandin endoperoxide synthase-2 (cyclooxygenase-2) by aspirin. Journal of Biological Chemistry 1994;269:13207-13215.
6. Smith WL, Garavito RM, DeWitt DL. Prostaglandin endoperoxide H synthases (cyclooxygenases)-1 and -2. Journal of Biological Chemistry 1996;271:33157-33160. 7. Seibert K, ZhangY, Leahy K, Hauser S, Masferrer J,
Perkins W, Lee L, Isakson P. Pharmacological and biochemical demonstration of the role of cyclooxygenase 2 in inflammation and pain. Proc.Natl.Acad.Sci.USA 1994; 1:12013-12017.
8. Mazur EM. Megakaryocytopoiesis and platelet production: a review. Experimental Hematology. 1987;15:340-350. 9. Breton-Gorius J, Vainchenker W. Expression of platelet
proteins during the in vitro and in vivo differentiation of megakaryocytes and morphological aspects of their maturation. Seminars in Hematology 1986;23:43-67. 10. Tabilio A, Vainchenker W, Van Haecke D, Vinci G,
Guichard J, Henri A, Reyes F, Breton-Gorius J. Immunological characterization of the leukemic megakaryocytic line at light and electron microscopic levels. Leukemia Research 1984;8:769-781.
11. Baatout S. Phorbol esters: useful tools to study megakaryocyte differentiation. Hematology and Cell Therapy 1998;40:33-39.
12. Ogura M, Morishima Y, Ohno R, Kato Y, Hirabayashi N, Nagura H, Saito H. Establishment of a novel human megakaryoblastic leukemia cell line, MEG-01, with positive Philadelphia chromosome. Blood 1985;66:1384-1392.
13. Ogura M, Morishima Y, Okumura M, Hotta T, Takamoto S, Ohno R, Hirabayashi N, Nagura H, Saito H. Functional and morphological differentiation induction of a human megakaryoblastic leukemia cell line (MEG-01s) by phorbol diesters. Blood 1988;72:49-60.
14. McNicol A. 1996. Platelet preparation and estimation of functional responses. In Platelets: Apractical approach. S.Watson and Authi.KS, editors. Oxford University Press, Oxford. 1-26.
http://www.elsevier.com/locate/exphem
and
http://www.sciencedirect.com
.
16. Cavalloni G, Dane A, Piacibello W, Bruno S, Lamas E, Brechot C, Aglietta M. The involvement of human-nuc gene in polyploidization of K562 cell line. Experimental Hematology 2000;28:1432-1440.
17. Debili N, Issaad C, Masse JM, Guichard J, Katz A, Breton-Gorius J, Vainchenker W. Expression of CD34 and platelet glycoproteins during human megakaryocytic differentiation. Blood 1992;80:3022-3035.
18. Debili N, Kieffer N, Nakazawa M, Guichard J, Titeux M, Cramer E, Breton-Gorius J, Vainchenker W. Expression of platelet glycoprotein Ib by cultured human megakaryocytes: ultrastructural localization and biosynthesis. Blood 1990;76:368-376.
19. Takeuchi M, Kuno H, Saito H, Yoshida T, Ogura M, Takeuchi K. Platelet-like particles released by inhibition of DNA synthesis in the human megakaryoblastic cell line, MEG-01 and MEG-01s. Tissue Culture Research Communication 1995;14:165-175.
PROTOCOL
Preparation of cells for immunocytochemistry Adherent cells
1. Grow MEG-01 cells directly on 18 mm2glass coverslips. 2. Rinse cells with 0.5 ml PBS at room temperature.
3. Add 0.5 ml of a 2% paraformaldehyde solution in PBS to the coverslips and incubate for 45 min. 4. Rinse the coverslips with PBS/10% FBS for 5 min. Repeat 3 times.
5. Add the primary antibody at a concentration of (0.01 mg/ml) in 200µl of a solution of PBS, 2% saponin and 10% FBS. Incubate 1 hr. in a humid chamber.
6. Wash the coverslips 3 times with PBS/10% FBS.
7. Add 0.5 ml of the secondary antibody (anti-IgG) diluted 1:30 in PBS/2% saponin/10% FBS. 8. Incubate 45 min. in a humid chamber.
9. Rinse the coverslips 3 times with PBS/10% FBS.
10. Add 0.5 ml of DAPI (5µg/mL) in PBS/2% saponin/10% FBS. 11. Rinse 3 times with PBS/10% FBS.
12. Mount onto microscope slides in 15µl of Permafluor mounting media.
Non adherent cells
13. Collect non-adherent MEG-01 cells by centrifugation at 330 x g for 5 min. 14. Resuspend the cell pellet in 10 ml of PBS and re-centrifuge at 330 x g for 5 min. 15. Resuspend the cell pellet in 5 ml of PBS.
16. Apply 0.5 ml aliquots of the cell suspensions to 18 mm2glass coverslips coated with 1 mg/ml poly-L-lysine. Incubating the suspensions for 1 min. at room temperature cause the floating MEG-01 to become attached to the coverslips.
17. Repeat from step 2.
Image Analysis
Images were analysed using ImagePro Plus (Media Cybernetics). The macro used for the analysis of DAPI/PGHS-1 labeled cells and DAPI/CD-41 labeled MEG-01 cells is reproduced below. Macros were written in ImagePro Plus Auto-Pro script.
Sub Total DAPI_PGHS()
Dim DapiName As String * 255 Dim RhodName As String * 255 Dim X As Integer
Dim DirSearch As Integer Dim TotalObj As Integer Dim PGHSPos As Integer Dim Intens As Integer
ret = IpSCalShow(1)
ret = IpSCalSelect("20X (monochrome)") ret = IpSCalShow(0)
ret = IpOutputClear() ret = IpOutputShow(1)
ret = IpStGetInt("Enter the intensity threshold to be used for PGHS +ve cells", Intens, 100, 5, 254) If ret = 0 Then End
X = 0
DirSearch = IpStSearchDir("D:\Meg01\Dapi", "*.BMP" ,X, DapiName) DirSearch = IpStSearchDir("D:\Meg01\Rhodamine", "*.BMP" ,X, RhodName) Do While DirSearch = 1
ret = IpWsLoad(dapiName, ".BMP") ret = IpDocMove(0, 0)
ret = IpWsLoad(RhodName, ".BMP") ret = IpDocMove(600, 0)
ret = IpLutSetAttr(LUT_CONTRAST, _2) ret = IpHstEqualize(EQ_BESTFIT) ret = IpLutApply()
ret = IpFltGauss(10, 10, 1) ret = IpBlbShow(1)
ret = IpBlbLoadSetting("C:\Program Files\IPWin3\Data\pi.env") ret = IpBlbSetAttr(BLOB_AUTORANGE,0)
ret = IpBlbSetRange(0, 100) ret = IpBlbCount()
ret = IpBlbUpdate(0) ret = IpBlbSplitObjects(1) ret = IpBlbSplitObjects(0)
ret = IpBlbGet (GETNUMOBJ, 0, 1, TotalObj)
ret = IpBlbSaveOutline("C:\Program Files\IPWin3\Data\dapi.out") ret = IpAppSelectDoc(1)
ret = IpBlbLoadSetting("C:\Program Files\IPWin3\Data\rhod.env") ret = IpBlbSetFilterRange(BLBM_DENSITY, Intens, 255)
ret = IpBlbLoadOutline("C:\Program Files\IPWin3\Data\dapi.out") ret = IpBlbGet (GETNUMOBJ, 0, 1, PGHSPos)
Print DapiName, chr$(9), TotalObj, chr$(9), PGHSPos ret = IpBlbShow(0)
ret = IpMacroWait(10) ret = IpAppCloseAll() X = X + 1
DirSearch = IpStSearchDir("D:\Meg01\Dapi", "*.BMP" ,X, DapiName) DirSearch = IpStSearchDir("D:\Meg01\Rhodamine", "*.BMP" ,X, RhodName) Loop
Print "Intensity range ", Intens,"_255" ret = IpDde(DDE_SET, "col", "1") ret = IpDde(DDE_SET, "row", "3") ret = IpOutputSave("", S_DDE) End Sub
Sub TotalDapi_CD41()
Dim DapiName As String * 255 Dim RhodName As String * 255 Dim X As Integer
Dim DirSearch As Integer Dim TotalObj As Integer Dim CD41Pos As Integer Dim Intens As Integer
ret = IpSCalShow(1)
ret = IpSCalSelect("20X (monochrome)") ret = IpSCalShow(0)
ret = IpOutputClear() ret = IpOutputShow(1)
ret = IpStGetInt("Enter the intensity threshold to be used for PGHS +ve cells", Intens, 100, 5, 254) If ret = 0 Then End
X = 0
DirSearch = IpStSearchDir("D:\Meg01\Dapi", "*.BMP" ,X, DapiName) DirSearch = IpStSearchDir("D:\Meg01\Rhodamine", "*.BMP" ,X, RhodName) Do While DirSearch = 1
ret = IpWsLoad(dapiName, ".BMP") ret = IpDocMove(0, 0)
ret = IpWsLoad(RhodName, ".BMP") ret = IpDocMove(600, 0)
ret = IpAppSelectDoc(0)
ret = IpFltLocHistEq(100, 64, 6, 1.0) ret = IpFltLoPass(5, 10, 1)
ret = IpBlbShow(1)
ret = IpBlbLoadSetting("C:\Program Files\IPWin3\Data\dapi.env") ret = IpBlbSetAttr(BLOB_AUTORANGE,0)
ret = IpBlbSetRange(0, 50) ret = IpBlbCount()
ret = IpBlbUpdate(0) ret = IpBlbSplitObjects(1) ret = IpBlbSplitObjects(0)
ret = IpBlbGet (GETNUMOBJ, 0, 1, TotalObj) ret = IpAppSelectDoc(1) ret = IpWsDuplicate()
ret = IpLutSetAttr(LUT_CONTRAST, _2) ret = IpFltLocHistEq(256, 64, 6, 5.0) ret = IpFltLoPass(5, 10, 1)
ret = IpBlbLoadSetting("C:\Program Files\IPWin3\Data\CD41.env") ret = IpBlbSetAttr(BLOB_AUTORANGE,0)
ret = IpBlbSetRange(0, 100) ret = IpBlbCount()
ret = IpBlbUpdate(0) ret = IpBlbSplitObjects(0)
ret = IpBlbSaveOutline("C:\Program Files\IPWin3\Data\CD41.out") ret = IpDocClose()
ret = IpBlbLoadSetting("C:\Program Files\IPWin3\Data\rhod.env") ret = IpBlbSetFilterRange(BLBM_DENSITY, Intens, 255)
ret = IpBlbLoadOutline("C:\Program Files\IPWin3\Data\CD41.out") ret = IpBlbGet (GETNUMOBJ, 0, 1, CD41Pos)
Print DapiName, chr$(9), TotalObj, chr$(9), CD41Pos ret = IpBlbShow(0)
ret = IpMacroWait (20) ret = IpAppCloseAll() X = X + 1
DirSearch = IpStSearchDir("D:\Meg01\Dapi", "*.BMP" ,X, DapiName) DirSearch = IpStSearchDir("D:\Meg01\Rhodamine", "*.BMP" ,X, RhodName) Loop

![Fig. 4: Assessment of viability in control and TPA-treatednon-adherent MEG-01 cells. Values at each time point wereobtained by determining the mean ± SE of three separate fieldsfromthreeindividualslides.Reprintedfrom[15]"Characterization of prostaglandin e](https://thumb-us.123doks.com/thumbv2/123dok_us/8918015.1840129/5.612.98.223.410.619/assessment-treatednon-wereobtained-determining-fieldsfromthreeindividualslides-reprintedfrom-characterization-prostaglandin.webp)
