Abstract— With the rapid decrease in younger population, Japanese universities/colleges have to face the challenging issue of how to reach the annual quota for the incoming students. The admission standards are debased and students with different varieties of scholastic abilities are being accepted by higher education institutions. Rather than the deterioration of students’ total academic achievements, the bipolar distribution of students’ academic proficiencies is believed to be the most crucial factor hindering the implementation of effective teaching. Many universities/colleges intend to solve this problem by providing remedial education to freshmen, aiming at a fairly balanced situation in students’ academic performances. This paper reports an English remedial education program carried out in Nishinippon Institute of Technology, Japan, discussing the validities of the proposed prediction models for its outcome, focusing on the issue of how to improve the scholastic abilities of low-proficiency students. The study shows that students’ contentment is a chief determinant affecting the consequence.
Index Terms— linear regression, prediction model, remedial education, English education.
I. INTRODUCTION
Remedial education is a transformation of the term developmental education. It originally refers to special preparatory courses offered by some American community colleges to potential incoming students whose scholastic abilities are not yet admirable [1]. Students are granted a certain period of time to compensate for their academic deficiencies. Recently, remedial course has also been integrated into the first-year education into the higher education of many countries. Numerous studies report attempts in such special programs to strengthen students’ basic scholastic skills in common subjects [2] [3] [4].
The apparent cause of this demanding situation is the progressive deterioration of students’ academic proficiencies.
Manuscript received August 6, 2008. This research was supported by “Ambient SoC Global COE Program of Waseda University” of the Ministry of Education, Culture, Sports, Science and Technology, Japan.
Rong Zhang is with Computer Design Technology Department, Nishinippon Institute of Technology, Japan. She is also a student in Graduate School of Information, Production and System, Waseda University, Japan (phone: 0081-93-563-2901; fax: 0081-93-563-2901; e-mail: zhang@ nishitech.ac.jp).
Yue zhou is a student in Graduate School of Information, Production and System, Waseda University, Japan (e-mail: [email protected]).
Fukuya Ishino is a professor with Graduate School of Information, Production and System, Waseda University, Japan (e-mail: [email protected])
It is also the most serious problem which most higher education institutions have to face currently in Japan. As the younger population is experiencing rapid decrease, more and more universities/colleges are making every effort to ensure annual quotas. As a result, the admission standards are debased to an unprecedented level and students with different varieties of scholastic abilities are being accepted [5]. In order to improve the effectiveness of teaching, universities/colleges have to offer remedial courses paralleling the normal curricula education, aiming at admirable progress in their freshmen’s academic performances.
In fact, rather than the degeneration of students’ total academic achievements, the bipolar distribution of students’ academic proficiencies is believed to be the most crucial factor hindering the implementation of effective teaching[5]. The core of all remedial education projects lies in the issue of how to help low-proficient students develop their potential abilities in learning and how to diminish the dispersion of students’ scholastic achievements. Since most remedial courses are carried out online and through some web-based learning tools, two factors are considered most crucial for a desirable output from such project: (1) proper selection of candidate students; (2) appropriate contents which best suit their level. Inapplicable instructions in remedial course will not help adjust the unbalanced distribution of students’ academic achievements and only results in a vicious circle dissipating the limited educational resources.
Because remedial education is generally treated as a supplement to the ordinary course study, there has seldom been any research about its instructional methodologies and pedagogic validity. This study makes an extensive application of the multiple regression theory, exploring the solution of the problem of how to select proper candidate students and contents for remedial courses, fitting the postulated prediction model for student’s post-test score changes and figuring out determinants affecting low-proficient students’ academic performances during their remedial study.
II. DATA COLLECTION AND ANALYTICAL ALGORITHM The data used in this study were collected from an English remedial course adopted by Computer Design Faculty of Nishinippon Institute of Technology, Japan. Freshmen students are supposed to accomplish their study within a certain period of time through a web-based learning system
Extensive Application of Multiple Regression:
A Critical Insight into English Remedial
Education
through Web-based Learning
Teach
in
g
Ma
te
ri
a
ls
A
c
h
iev
em
e
n
t
Re
co
rd
s
Teacher
Students
We
b
Ma
n
a
g
e
r
Server
0 10 20 30 40
50
[image:2.595.339.515.489.595.2]-30 -20 -10 0 10 20 30 40
Fig. 2 Histogram of Observed Score changes
called ASP (Active Server Pages) (Fig.1). The content of the e-learning tool aims at an improvement of students’ basic knowledge (both grammatical rules and vocabulary) about English which should have been mastered during their middle school and high school study. Pre-course test and post-course test were conducted in order to make out the changes in their English proficiencies, which is used as an important index to investigate the effectiveness of this online program. Three inquiries (such as questions about their learning strategies, intercultural communication abilities & computer operation skills) were carried out in order to spot those factors which have the most significant effects on students’ learning production. Students’ school records (including their attendance rates, average scores of all subjects) are also employed to strengthen the objectivity of this research.
The very basic concept propping the current investigation is the multiple regression theory which are applied abundantly in studies about educational issues [6] [7] [8]. The most commonly accepted regression model shows a linear relationship between the dependent variable (W) and certain independent variables (Y). It is also the most intuitional way which helps clarify the potentially complex implications in all the variables. The quasi-linear correlation can be expressed through the following equation:
f (wi) = ß0 + ß1y1 + β2y2 + …+ βmym (i = 1, n) (1)
In this study, dependent variable Wi indicates the score
change of the ith sample student after remedial education course study and Yrefers to a combination of all the factors which correlate maximally with this change. We assume that post-course score changes are mainly influenced by students’ willingness to get involved in learning activities, their competences in intercultural communication and computer operation [9] [10]. Parameters related to these factors make up the majority of the independent variables. ß0 is the intercept of the line and βmfunctions as the coefficient of the
mth independent variable.
[image:2.595.81.220.647.763.2]By using the least square method, we can figure out the largest coefficient modulus (R2) and fix the independent variables constituting the above prediction model (1). A larger R2 signifies a higher percentage that the dependent variable (W) can be interpreted by the conjuncture of the independent variables. Therefore, we further fit the postulated model to a binomial formula in order to increase the preciseness of our prediction.
Fig. 1 Framework of ASP System
Fig. 2 shows the unbalanced distribution of students’ Pre-course Test Scores (PRTS). Sample students are classified into small groups according to their scores. The average score of PRTS is 68 point, and most students score from 50~90. We use very basic and simple questions in the pre-course test for a simple reason: If the students lose confidence and become desperate at the beginning, they will not show interests and efforts in English learning afterwards. This is especially the case with those students who obviously lack basic learning abilities in English. There are only 11 students who scored below 50. But, in fact, they are the main target of our remedial course, because their improvement of English proficiencies will definitely help increase teaching efficacy in class.
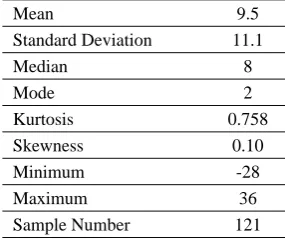
Table 1 implies an average change of 9.49 points in the test scores of 121 effective sample students, with most of these changes occurring within an interval of 0 ~ 20 points. The gap between the minimum Observed Score Change (OSC) and the maximum OSC reaches 64 points. As an inevitable phenomenon of the growing curve theory, pre-course test score turns out to be one fundamental determinant in OSC -- students with higher Pre-course Test Scores (PRTS) tend to show a non-significant change in their post-course test performance (Fig. 3), while those with lower PTS absolutely benefit more from their online learning. PTS spans an extremely wide range of 24~100 points, which demonstrates a radical dispersion in its distribution.
The above features of the two fundamental exponents once more intensify the paradox we hold in mind: What should be the exact level of the remedial course we can best serve students? Or how should we assort proper candidates for the prepared course and delete those who will not favored by their study? What on earth contribute to students’ OSC except for their PRTS?
Table 1 Statistics of Observed Score Change
Mean 9.5 Standard Deviation 11.1
Median 8 Mode 2 Kurtosis 0.758 Skewness 0.10 Minimum -28 Maximum 36
[image:2.595.353.496.651.772.2]Fig. 3 Scatterplot of Observed Score Change and Pre-course Test Score
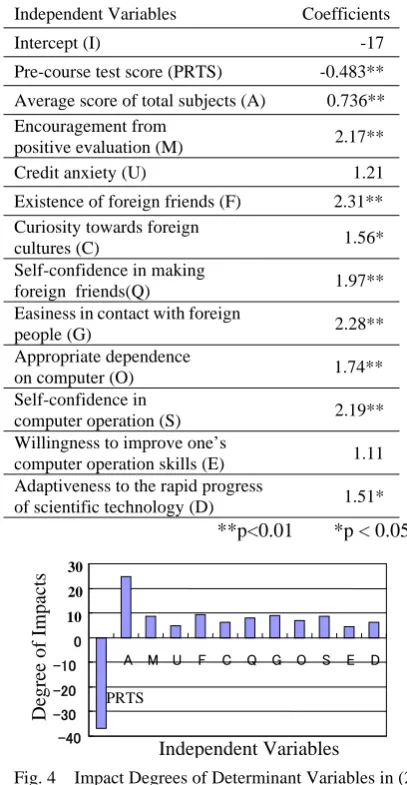
Table 2 Optimized Model (1) for Prediction of Post-course Score Changes (PSC) Independent Variables Coefficients
Intercept (I) -17
Pre-course test score (PRTS) -0.483**
Average score of total subjects (A) 0.736** Encouragement from
positive evaluation (M) 2.17**
Credit anxiety (U) 1.21
Existence of foreign friends (F) 2.31** Curiosity towards foreign
cultures (C) 1.56*
Self-confidence in making
foreign friends(Q) 1.97** Easiness in contact with foreign
people (G) 2.28**
Appropriate dependence
on computer (O) 1.74**
Self-confidence in
computer operation (S) 2.19**
Willingness to improve one’s
computer operation skills (E) 1.11 Adaptiveness to the rapid progress
of scientific technology (D) 1.51*
**p<0.01 *p < 0.05
III. ASSESSMENT A. General multiple regression
We conducted multiple regression analysis according to the general procedure while taking all the parameters into account (Table 2) [10]. The acquired model (equation 2) is proposed to describe the value of the post-course score changes (PSC):
PSCi = -17(I)
+ 0.483 * PRTSi + 0.736 *Ai + 2.172 * Mi + 1.21* Ui + 2.31 * Fi + 1.56 * Ci + 1.97 * Qi + 2.28 * Gi + 1.74 * Oi + 2.19 * Si + 1.11 * Ei + 1.51 * Di
( i = 1, n) (2)
Fig. 4 indicates the impact degrees of respective dependent variables used to describe the independent variable. The impact of PRTS turns out to be such a constructive factor which exerts a considerable negative influence on the consequence of PSC. Students’ average scores in all subjects ranks second among the twelve determinants. Apparently, students who devote more efforts to their total learning activities tend to make more impressive progress in their remedial course learning. There is no remarkable difference discovered among the other determinants. The two factors (U & E) whose p-values are manifested above 0.05 in Table 3, demonstrate less impacts on PSC.
[image:3.595.67.273.202.576.2]B. Correlation
Table 3 Correlations between PCS and other Independent Variables
In order to supplement the prediction model with some new discoveries, we figured out those factors which have direct correlations with the dependent variable (PSC). According to the compendium method proposed by Ueta, correlation between two factors is recognized when the following equation functions [11]:
R2 > 4 / (n+2) (3)
“n” signifies the sample number, which is 121 in this study. Therefore, the modulus R2 is expected to be more than 0.0325 ( 4 / (121+2) ) in order to assure the correlation. 13 factors are proved to have a strong correlation with the independent variable (PSC) except for PRTS (Table 3). Only two factors in the prediction model (2) survive in the list. The factors ranking at the top are all related to students’ psychological pressure and most of them hold a negative correlation with PSC. Students with lower PRTS realized a higher promotion in their post-course test (Fig. 3 & Table 3).
Hence, the rational argument is: low-proficient students have to overcome extreme frustration during the process of self-study. The more they take it seriously, the faster they
Independent Variable Coefficient
s
Pre-course test score (PRTS) -0.577
The remedial course is not difficult (D). 0.275 I find English learning is more enjoyable than
before. (Y) 0.258
I am doing extra learning in English. (L) -0.241
There are still many questions unsolved. (S) 0.235
I always review after the class. (R) 0.233
Remedial course is necessary.(N) 0.229
I can catch up with the teacher in class. (C) 0.225
Credit anxiety (I am learning for credits.) (A) 0.222
I always prepare before class.(P) 0.221
I like computer games.(G) -0.215
I do not want to lose my current English
ability.(U) 0.20
One's English proficiency depends on his/her
efforts.(E) 0.20
Computers are more reliable than human
beings.(R) -0.181
-40 -30 -20 -10 0
10 20 30
PRTS
A M U F C Q G O S E D
Independent Variables
Degree of Impacts
[image:3.595.308.547.248.518.2]make progress in their English learning. Psychological pressure is turned into some sort of motivation enhancing their devotion to the course.
As illustrated in Table 4, the optimized model (equation 4) contains only four independent variables this time. Although it can describe only 40.3% of the total data, which is lower than the case of equation (2), the plain formula helps us understand better about the factors causing the changes in students’ test scores. The impact degrees of determinants in equation (4) are indicated in Fig. 5.
PSCi = 37.9 (I) + (-0.409)*PRTS + 2.01*C
[image:4.595.303.554.99.295.2]+ 1.93*Y + 19.6*D (4)
Table 4 Optimized Model (2) for Prediction of Post-course Score Change (PSC)
**p<0.01
-35 -30 -25 -20 -15 -10 -5 0 5 10 15
PRTS C Y D
Fig. 5 Impact Degrees of Determinants in (4)
[image:4.595.50.288.233.642.2]C. Contingent Multiple regression
Fig. 6 Binomial Approximate Curve for PSC
The optimized model (Equation 4) above explains a process in which PRTS is proved to be the leading element affecting the result of remedial education. But due to its availing impact degree, the capacities of other dependent variables are not adequately exhibited. Furthermore, since the analysis is conducted by using the data of all the students, its vagueness in defining low-proficient students seems to be the reprehensible weakness. The problem caused by students’ over-diffusing academic achievements
is not solved provided more critical insight is given into the specific information of the low-proficient students.
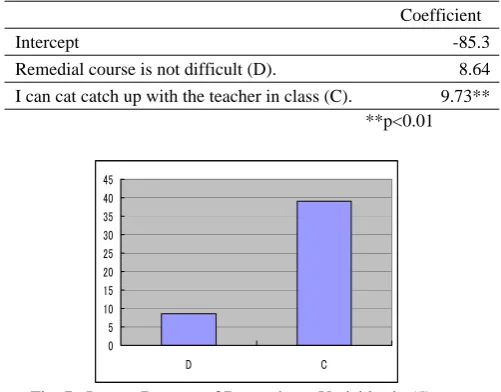
Table 5 Optimized Model for Prediction of ESC
**p<0.01
0 5 10 15 20 25 30 35 40 45
D C
Fig. 7 Impact Degrees of Determinant Variables in (5) The optimized model (Equation 4) above explains a process in which PRTS is proved to be the leading element affecting the result of remedial education. But due to its availing impact degree, the capacities of other dependent variables are not adequately exhibited. Furthermore, since the analysis is conducted by using the data of all the students, its vagueness in defining low-proficient students seems to be the reprehensible weakness. The problem caused by students’ over-diffusing academic achievements is not solved provided more critical insight is given into the specific information of the low-proficient students.
In order to figure out the hidden fact about students’ PSC and PRTS, we classified all sample students into groups according to their PRTS, with 4 scores as an interval between the adjoining groups (Fig. 6). The y-axis suggests the average score change of all the members in each group. Binomial approximate curve is utilized for the standardization of the describing process of students’ score changes. The lowest-level group (with a PRTS under 60 points) profited the most from the course, while there is a slight decrease in the scores of the top-level group. Students who score more than 80 in pre-course test are not favored by the current learning tool and should be assigned other tasks.
The formula defining the binomial approximate curve in Table 5 conceptualizes a new exponent: expected score change (ESC). The ESC line standardized students’ expected score in post-course test. This index is calculated on basis of each student’s PRTS and better characterizes the feature of students at each score stage. Multiple regression analysis is conducted in order to figure out those factors helping fix ESC. The three factors which have manifested their functions as determinants with PSC (Table 4) are used as independent variables. PRTS is excluded deliberately because the changes in the impact degrees of other factors are the focus of our study and the predominant characteristic of PRTS always shades the functions of other factors to some extent. In this way, we obtained the optimized model for the prediction of students’ ESC (Table 5):
ESCi = -85.3 + 8.64 * Di + 9.73 * Ci
(i = 1, n ) (5) Coefficient
Intercept (I) 37.9
Pre-course test score (PRTS) -0.409**
I can catch up with the teacher in class.(C) 2.01 I find English is more enjoyable than before.(Y) 1.93 The remedial course is not difficult. (D) 19.6**
Coefficient Intercept -85.3
Remedial course is not difficult (D). 8.64
[image:4.595.71.261.529.662.2]The impact degrees of these determinant variables are demonstrated in Fig. 7.
As suggested in Fig. 6, the contents of the remedial course are not suitable for top level students who score more than 80 in the pre-course test. They do not exhibit satisfactory progress in post-course test and their score changes are below the average level. Accordingly, it is definite that students who score under 80 in pre-course test are the appropriate potential candidates for this course. In order to better penetrate the issue of instruction efficacy, we define students in this category as low proficient group (or low level group) and claim that it is of special significance to focus our analysis on their data. We label students’ ESC in this category ESC-L and carry out multiple regression analysis to using the four factors which constitute equation (4) except PTRS. As Table 6 suggests, there is only one parameter left. The formula can be summarized as:
f (ESC-L) i = -71.8 + 5.67* Ci (i = 1, n ) (6)
[image:5.595.311.536.66.264.2]The impact degrees of the determinant variables in equation (6) are demonstrated in Fig. 8.
Table 6 Optimized Model for Prediction of ESC-L **p<0.01
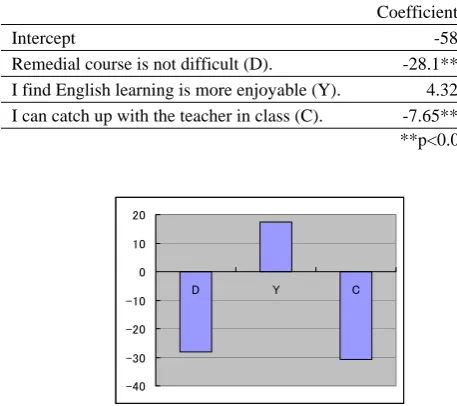
Table 7 Optimized Model for Prediction of WSC
**p<0.01
-40 -30 -20 -10 0 10 20
D Y C
[image:5.595.44.282.374.462.2]Fig. 9 Impact Degrees of Determinant Variables in (8)
Table 8 Optimized Model for Prediction of WSC-L
**p<0.01
-35 -30 -25 -20 -15 -10 -5 0
D C
Fig. 10 Impact Degrees of Determinant Variables in (9)
In Fig. 6, students were divided into 19 groups according to their PRTS. Among them, 8 groups attain a more desirable PSC. That is, students’ average post-course test score in each group exceeds the ESC line and they make better achievements in learning than the prediction. Elucidation of factors related to this remarkable leeway is the key to the improvement of pedagogical validity.
The average post-course score in each group deviating from the ESC line implies the gap between the ESC and the OSC of the member students. We name this new index WSC. The smaller WSC is in figure, the more striking progress students have achieved through self-learning:
f (WSC) = f (ESC-OSC) (7)
Multiple regression analysis is also conducted for this new dependent variable ---- WSC, and its formula can be summarized as (Table 7):
WSCi = (-58) + (-28.1) * Di + 4.32 * Yi + (-7.65)*Ci (i = 1, n ) (8)
The impact degrees of the determinant variables in equation (8) are demonstrated in Fig. 9.
Likewise, regression analysis is carried out for the lower proficient group and the prediction model for the gap between ESC and OSC (WSC-L) is implied in Table 8. Two parameters prove to be responsible for the difference and the equation is summarized as:
(WSC-L)i = (-52.8) + (-25.5) * Di + (-7.24) * Ci (i = 1, n ) (9)
The impact degrees of determinant variables in equation (9) are reflected in Fig. 10.
IV. DISCUSSION
According to the relationships among PRTS, PSC and ESC in Fig. 6, we can draw the conclusion that students whose scores are over 80 in the pre-course test should not be designated as the candidate students for the remedial
Coefficient
Intercept -71.8 I can catch up with the teacher in class.(C) 5.67**
Coefficient
Intercept -58 Remedial course is not difficult (D). -28.1**
I find English learning is more enjoyable (Y). 4.32 I can catch up with the teacher in class (C). -7.65**
Coefficien t
Intercept -52.8 Remedial course is not difficult. (D) -25.5**
I can catch up with the teacher in class(C). -7.24**
0 5 10 15 20 25
C
[image:5.595.41.270.559.762.2] [image:5.595.84.253.624.758.2]education course. It is advisable to exert more adequate supervision for the upper level students in order to make the education outcome more fruitful and productive.
We induct prediction models by using the compendium method, in order to avoid the defect in equations (2) which lacks in brevity and conciseness in appearance. Students’ learning activities through web-based tools constitute a sophisticated process. Therefore, it is of substantially crucial to expound the exact one or two variables. Invariables D and C are the integrants frequently appearing in the proposed equations and their significant commitments to students’ score changes should not be ignored (Table 5, Table 6, Table 7 and Table 8). Three more protruding points are shared by the comparison of the total student and the lower proficient group.
First, it is ostensible that students of the lower proficient group need to obtain more confidence in learning English, because factor C becomes the only determinant variable in Table 6, which stands for a conspicuous increase in its relative impact degree comparing with Table 5. The exclusive function of factor C indicates that they demand a strong sense of attainment during the process of accomplishing the assignment than the upper level students. Their distinguished progress in ESC-L relies heavily on their personal satisfaction that they can catch up with the teacher in class. The more contented they are with the remedial course, the more possibly they upgrade their performances. Factor D “Remedial course is not difficult” disappears in the analysis result of the low-proficient group, most probably due to the reason that students’ average PRTS is lower than that of the upper level and it may be less comfortable for them to deal with the designated task.
Second, we are very concerned about the invariables involved in the differences between WSC and WSC-L (Table 7 and Table 8). The argument about this matter is the same as in the explanation above about the comparisons of students’ ESC and ESC-L. Students, who present higher WSCs, find the remedial course more enjoyable(Y) (Table 7). That means those students, who score lower OSCs than their ESCs, take the remedial course less seriously. They hold a strong negative attitude toward the course, insisting the course is difficult and they can’t catch up with the teacher in class. This is most probably and partially because they lack sense of impending burden in learning English and feel more relaxing with the remedial course. Consequently, we expect the gap between students’ ESCs and OSCs to be minus, which means that their OSCs are higher than their ESCs and that they have obtained critical proficiencies through the course study. Then, the two factors (D and C) hold a positive relation with the dependent variable (WSC) (Table 7). There is no other noticeable difference between the upper level students and the low-proficient group about the index WSC.
Third, factor D proves to be principally decisive in the comparison process with ESC-L and WSC-L (Table 6 & Table 8). Although factor C severs as the exclusive determinant in ESC-L (Table 6), WSC-L indicates that students who make relatively exceptional progress in the lower proficient group tend to stress that remedial course is not difficult. This observation highlights one of the conclusions we drew above: Students need be given exact instruction on what contents they need work on. The effectiveness of teaching and learning activities may
considerably diminish when the level of didactic materials and exercises does not suit the students perfectly and specifically.
V. CONCLUSION
It is the teachers’ duty to guide students with correct methodology of learning. Selecting appropriate contents for students according to their academic achievement is the primary step to implement an effective pedagogical plan. Higher level contents may put students under great pressure, but excessively difficult ones may also frustrate the students and push them out of the paradox of an enjoyable learning. We advocate that well selected materials be offered to students, especially for students who seem to be lacking basic knowledge and learning strategies.
Cognitive contentment can be converted into power and energy which help them improve their learning skills and overcome difficulties in learning process. The more positively they are assessed about the efforts they made, the more admirably their performances are improved. Frequent psychological care is also believed to be a supplementary means to help students gain confidence.
REFERENCES
[1] Developmental Education Program Review in Eastern Kentucky University: available on June 6, 2008.
http://www.developmentaleducation.eku.edu/description/
[2] M.G. Sanchez-Torrubia, R. Martinez-Lopez and E.E. Castineira-Holgado, “Detailed and Global Analysis of a Remedial Course’s Impact on Incoming Students’ Marks”, WSEAS Transactions on Advances in Engineering Education, Issue 1, Vol. 5, pp. 43-51, January 2008.
[3] Reima ado Al-Jarf, “The effects of online grammar instruction on low proficiency EFL college students’ achievement”, Asian EFL Journal. Vol. 7, Issue 4, 10th Article. 2005.
[4] R. Zhang & Y. Nakamura & Y. Zhou & F. Ishino, “A Practical Study on ASP E-Learning Model for Developmental education”, Human Factors in Telecommunication : User Experience of ICTs, Prentice Hall, New York, March 2008, pp. 255-262.
[5] Hiroshi Ono, “Basic Academic Ability Construction of Japanese Universities Students ---- Observation from Placement Tests”, A Development of Placement Test and E-learning System for Japanese University Students, 2005, pp.1-6. National Institute of Multimedia Education, Japan.
[6] B. Clarke, S. Baker, K. Smolkowski & D. J. Chard, “An analysis of Early Numeracy Curriculum-Based Measurement: Examining the Role of Growth in Student Outcomes”, Remedial and Special Education, 2008, Vol. 29, Issue 1, pp.46~.
[7] Getinet Astatike Haile and Anh Ngoc Nguyen, “Determinants of Academic Attainment in the United States: A Quantile Regression Analysis of Test Scores”, Education Economics, Vol, 16, No. 1, March 2008, 29-57.
[8] Kwabena Gyimah-brempong and Anthony. O. Gyapong, “Characteristics of Education Production Functions: An Application of Canonical Regression Analysis”, Economics of Education Review, Vol. 10, No. 1, 1991, pp. 7-17.
[9] Nobuko Kubo, “Orientation-Appraisal Model for Japanese University Students’ Learning of English : Relation Among Learning Motive, Cognitive Appraisal, Learning Behavior, and Performance”, The Japanese Journal of Ecuational Psychology, Vol.47, No.4, Dec.1999. [10] R. Zhang & Y. Zhou & H. Yamagata & F. Ishino,
“Determinants of English Remedial Education through Web-based Learning”, New Aspects of Engineering Education, WSEAS, Greece, July 2008, pp.343-348.
[11] Taichiro Ueta, “Compendium Method of Judging Correlation”,