www.wjpr.net Vol 3, Issue 4, 2014. 1798
DEVELOPMENT AND VALIDATION OF STABILITY INDICATING
HPLC METHOD FOR ESTIMATION OF RUFINAMIDE IN BULK AND
ITS PHARMACEUTICAL DOSAGE FORM
Apexa Patel1*, Dr B.N Suhagia2, Arpit Patwari3
1
Saurastra University, Rajkot, India.
2
DDIT, Nadiad, India.
3
L. M. College of Pharmacy, Ahmedabad, India.
ABSTRACT
A simple, specific, accurate and stability indicating reversed phase
high performance liquid chromatographic method was developed for
the determination of Rufinamide, using C18 column and a mobile
phase composed of acetonitrile: water (60:40 v/v), pH 7.0. The
retention time of Rufinamide was found to be 3.043 min. Linearity was
established for Rufinamide in the range of 10-80 µg/mL. The
percentage recovery of Rufinamide was found to be in the range of
97.15-100.6 %. The drug was subjected to acid, alkali, oxidation, dry
heat and Photolytic degradation. The degradation studies indicated condition was well
resolved from the pure drug with significant differences in their retention time values. This
method can be successfully employed for quantitative analysis of Rufinamide in bulk drug
and formulation.
KEY WORDS: Rufinamide, Stability indicating method, HPLC.
INTRODUCTION
Rufinamide is an antiepileptic drug approved by the USFDA as an adjunctive treatment for
seizures associated with Lennox-gastaut syndrome under the children of 4 years of age.
Principle mechanism involved in the antiepileptic activity of Rufinamide is its ability to
modulate the activity of sodium channels, limiting high-frequency firing of neuronal action
potentials over a broad range of concentrations. Rufinamide is a triazole derivative (Figure 1)
Volume 3, Issue 4, 1798-1810. Research Article ISSN 2277 – 7105
Article Received on 30 April 2014,
Revised on 22 May 2014, Accepted on 16 June 2014
*Author for Correspondence
Apexa Patel
Saurastra University, Rajkot,
www.wjpr.net Vol 3, Issue 4, 2014. 1799 that is structurally distinct from currently marketed antiepileptic drug. Chemically
Rufinamide is (1-[(2, 6-difluorophenyl) methyl]-1hydro-1, 2, 3-triazole-4 carboxamide).
Literature survey reveals that few UPLC, RP-HPLC in bio samples, UV spectrophotometric
methods has been reported for the estimation of Rufinamide. No stability indicating
RP-HPLC method for estimation of Rufinamide. The validation has been carried out as per ICH
guidelines.
N
N N N
H 2 O
F
F
Figure 1: Rufinamide Structure
MATERIALS & METHODS Instruments
The liquid chromatographic system was of Agilent Technology (model 1220 Infinity LC)
which consisted of following components: Column C18 – phenomenex Luna (250 х 4.6 mm,
5 µ (100 A°)), UV detector, a manual injection facility with 20 µL fixed loop.
Reagents
Rufinamide bulk powder was kindly supplied as a gift sample by Torrent Research Center,
Ahmadabad. Acetonitrile and water used were of HPLC grade. Banzel (200 mg) were
purchased from local market.
Optimized Chromatographic Condition
A reverse phase C-18 column equilibrated with mobile phase comprising of mixture
acetonitrile: water (60: 40) was used. Mobile phase flow rate was maintained 1 mL/min and
eluent were monitored at 210 nm. A 20 µL sample was injected using a fixed loop, and the
total run time was 7 min. all the chromatographic separations were carried out at controlled
room temperature (25 °C).
Selection of Mobile Phase
Based on sample solubility, stability and suitability various mobile phase compositions were
www.wjpr.net Vol 3, Issue 4, 2014. 1800 mobile phases tried, mobile phase containing acetonitrile: water (60:40 % v/v) proportion
with detection wavelength 210 nm was selected, since it gave sharp peak with good
symmetry within limits for the drug.
Preparation of Standard Stock solution
An accurately weighed quantity of Rufinamide (25 mg) was transferred to 25 mL volumetric
flask, dissolved and diluted to the mark with acetonitrile to obtained standard stock solution
having concentration of 1000 µg/mL.
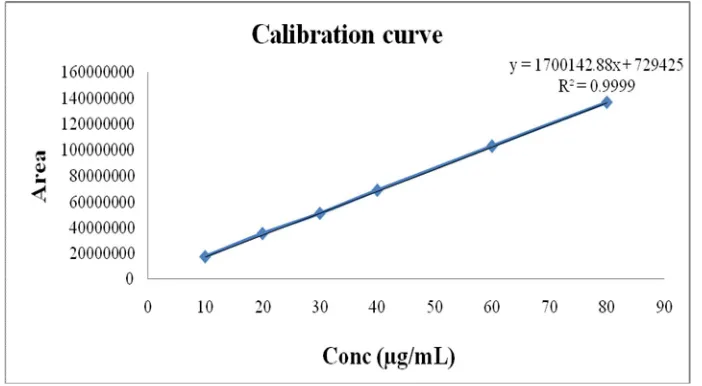
Preparation of Calibration Curve
Aliquots of 0.1, 0.2, 0.3, 0.4, 0.6, 0.8 mL standard stock solution (1000 µg/mL) was
transferred to the 10 mL of volumetric flask and made up to the mark with acetonitrile to get
concentration of 10, 20, 30, 40, 60, 80µg/mL. An aliquot (20 mL) of each solution was
injected under the operating chromatographic condition as described above and response
were recorded. Calibration curve was constructed by plotting the peak areas versus the
concentration and the regression equation was calculated.
Method Validation
The optimized Chromatographic method was completely validated according to the
procedures described in ICH guidelines Q2 (R1) for the validation of analytical method.
Linearity
Appropriate aliquots of Rufinamide stock solutions were taken in different 10 mL volumetric
flasks and diluted up to the mark with water to obtain final concentrations of 10-80 µg/mL of
Rufinamide. The solutions were injected and chromatograms were recorded. Calibration
curves were constructed by plotting average peak area versus concentrations and regression
equations were computed for the drug (Figure 2 & Table 1).
Intermediate Precision
Intraday and interday precision study of Rufinamide was carried out by estimating the
corresponding responses 3 times on the same day and on 3 different days for the
concentration of Rufinamide (10, 40 & 80 µg/mL). The results were reported in terms of
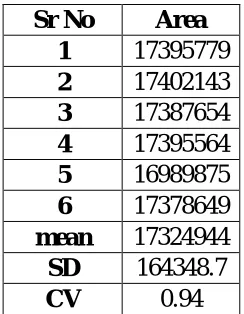
www.wjpr.net Vol 3, Issue 4, 2014. 1801 Method Precision (Repeatability)
The Precision was checked by repeated measurement of the response of solutions (n=6) of
Rufinamide (10 µg/mL) without changing the parameters. (Table 4)
Limit of Detection and Limit of Quantification
The limit of detection (LOD) and limit of quantification (LOQ) of drug were derived by
calculating the signal to noise (i.e. 3.3 for LOD and 10 for LOQ) ratio using the following
equations designated by ICH guideline
LOD= 3.3 x σ/S
LOQ= 10 x σ/S
Where, σ =the standard deviation of the response
and S= slope of the calibration curve.
Accuracy (Recovery Study)
The accuracy of the method was determined by calculating percentage recovery of
Rufinamide. For drug, recovery studies was carried out by applying the method to drug
sample to which known amount of Rufinamide corresponding to 50, 100 and 150 % of label
claim had been added (standard addition method). At each level of the amount six
determinations were performed and the results obtained were compared. (Table 5)
Robustness
For robustness evaluation of HPLC method a few parameters like flow rate and composition
of mobile phase were deliberately changed. One factor was changed at one time to estimate
the effect. Each factor selected was changed at three levels (-1, 0, +1) with respect to
optimized parameters. Robustness of the method was done at the concentration level 20
µg/mL for Rufinamide (Table 6)
Solution Stability
The solution stability of Rufinamide was investigated by leaving sample in tightly capped
volumetric flask at room temperature for 72 hrs and determined every 24 hr up to the study
period.
System Suitability
System suitability test are an integral part of chromatographic method which are used to
www.wjpr.net Vol 3, Issue 4, 2014. 1802 system suitability test parameters were checked by repetitively injecting the drug solution at
the concentration level 20 µg/mL for Rufinamide to check the reproducibility of the system
and the results are shown in table 7.
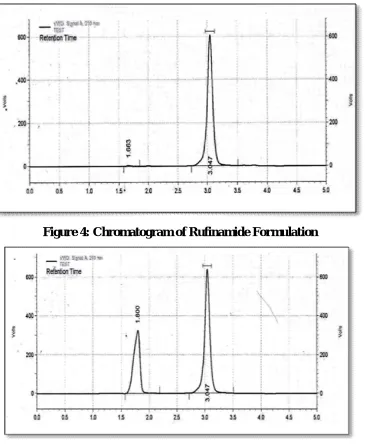
Analysis of Marketed Formulation
Twenty tablets were weighed accurately and finely powdered. Tablet powder equivalent to
200 mg Rufinamide was weighed accurately and transferred to a 100 mL volumetric flask
containing 50 mL acetonitrile, and sonicated for 15 minutes. Solution was filtered through
Millipore 0.22 µm filter and volume was made up to the mark. Aliquot (1mL) was taken and
transferred to 10 mL volumetric flask and volume was made upto the mark with acetonitrile
to give a solution containing 0.2 mg /mL Rufinamide. From this solution 1 mL solution was
transferred to 10 mL volumetric flask and volume was made upto the mark with mobile phase
to give a solution containing 20 µg/mL Rufinamide. 20 µL was injected and the amount of
Rufinamide was calculated from the regression equation. (Table 8)
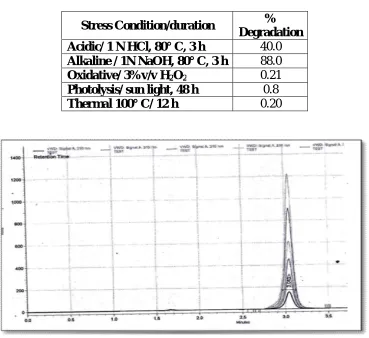
Forced Degradation studies
Rufinamide was subjected to various forced degradation conditions to effect partial
degradation of the drug preferably in 20-80 % range. The study provides information about
the conditions in which the drug is unstable so that measures can be taken during formulation
to avoid potential instabilities.
A forced degradation study of the drug was carried out under conditions of acid and base
hydrolysis, photolytic, dry heat and oxidation.
Acid Degradation
Accurately weighed Rufinamide (100 mg) was transferred into 100 mL volumetric flask, 50
mL methanol and 50 mL 1N HCl was added to it. The drug was subjected to accelerated
degradation at 80° C for a period of 3 hours. The accelerated degradation in acidic media was
performed in the dark in order to exclude the possible effects of light on the drug. From the
resultant solution, 1 mL was transferred into 50 mL flask, neutralized with 1 N NaOH and
diluted upto the mark with methanol. 20 µL of the sample was injected in HPLC system and
analyzed.
Base degradation
Accurately weighed Rufinamide (100 mg) was transferred into 100 mL volumetric flask, 50
www.wjpr.net Vol 3, Issue 4, 2014. 1803 degradation at 80° C for a period of 3 hours. The accelerated degradation in basic media was
performed in the dark in order to exclude the possible effects of light on the drug. From the
resultant solution, 1 mL was transferred into 50 mL flask, neutralized with 1 N HCl and
diluted upto the mark with methanol. 20 µL of the sample was injected in HPLC system and
analyzed.
Hydrogen peroxide induced degradation (Oxidation)
Accurately weighed Rufinamide (100 mg) was transferred into 100 mL volumetric flask, 50
mL methanol and 50 mL 3 % v/v hydrogen peroxide was added to it. The solution was kept
in dark for 24 h at room temperature. The solution was heated after 24 h in boiling water bath
for 1 h till the removal of excess hydrogen peroxide. From the resultant solution, 1 mL was
transferred into 50 mL flask, diluted upto the mark with methanol and 20 µL of the sample
was injected in HPLC system and analyzed
Photochemical degradation
Accurately weighed Rufinamide (100 mg) was taken into 100 mL volumetric flask and
dissolved in and diluted upto the 100 mL with methanol. The photochemical stability of the
drug was studied by exposing this drug solution to direct sunlight for 48 hours. Aliquot (1
mL) was transferred into 50 mL volumetric flask and diluted upto the mark with methanol. 20
µL of the sample was injected in HPLC system and analyzed
Dry heat degradation (Thermal degradation)
Rufinamide (100 mg) was stored at 100 ˚C for 12 hours under dry heat condition. After 12
hours the drug sample was dissolved in and diluted to 100 mL with methanol Aliquot (1 mL)
was transferred into 50 mL volumetric flask and diluted upto the mark with methanol. 20 µL
of the sample was injected in HPLC system and analyzed
RESULTS AND DISCUSSION
The mobile phase consisting of Acetonitrile: Water (60:40 v/v) pH 7.0, at 1 mL/min flow rate
was optimized which gave sharp, well resolved peaks for Rufinamide. Quantification was
achieved with UV detection at 210 nm based on peak area. The retention time was found to
be 3.047 min. The optimized method was validated as per ICH guidelines. The drug has
shown more degradation in acid hydrolysis and base hydrolysis. It was less degraded in
photolytic, oxidative and thermal degradation. The absence of interference peak indicates that
www.wjpr.net Vol 3, Issue 4, 2014. 1804 Table 1: Linearity data
Concentration
(µg/mL) Area 1 Area 2 Area 3
Average
Area SD CV
[image:7.595.124.475.255.448.2]10 17395779 17405468 17391225 17397491 7274.14 0.04 20 35657744 35719821 34879654 35419073 468180.60 1.32 30 51652351 50564421 50987599 51068124 548416.90 1.07 40 69000972 68999782 69158632 69053129 91370.50 0.13 60 102591322 103513176 102512681 102872393 556325.70 0.54 80 137237740 135439712 137124450 136600634 1006982.00 0.73
Figure 2: Calibration curve
Table 2: Intraday Precision data concentration
(µg/mL) Area 1 Area 2 Area 3
Average
area SD CV
10 17395779 17405468 17391225 17397490.67 7274.14 0.04 40 69000972 68999782 69158632 69053128.67 91370.50 0.13 80 137237740 135439712 137124450 136600634 1006982.00 0.73 Table 3: Interday precision data
Concentration
(µg/mL) Area 1 Area 2 Area 3
Average
area SD CV
www.wjpr.net Vol 3, Issue 4, 2014. 1805 Table 4: Repeatability data
Table 5: Accuracy data
Level Amount Added (µg)
Total Amount
(µg)
Amount
Recovered (µg) % Recovery
0 20 19.89 99.45
50 10 30 29.95 100.6
100 20 40 39.32 97.15
150 30 50 49.68 99.3
Table 6: Robustness data
Sr.
No. Parameters
Retention time
Asymmetry factor
% RSD of response 1. Acetonitrile: water (60:40 v/v) 3.047 0.95 0.24 2. Acetonitrile: water (62:38 v/v) 2.990 0.98 0.31 3. Acetonitrile: water (58:42 v/v) 3.208 0.89 0.24
4. Flow rate (1mL/min) 3.047 0.95 0.24
5. Flow rate (0.9mL/min) 3.154 0.95 0.23 6. Flow rate (1.1mL/min) 2.965 0.88 0.24 7. Column temperature (25˚C) 3.047 0.95 0.24 8. Column temperature (27 ˚C) 3.002 0.88 0.19 9. Column temperature (23˚C) 2.974 0.91 0.21 Table 7: System suitability Parameter
Resolution 6.95222
Column efficiency( No of theoretical Plate) 5584 Precision of replicate injection( Injection
repeatability)( % RSD) 0.94
Asymmetry factor 0.95
Capacity Factor 1.05
HETP 4.47 х 10-3
cm Sr No Area
1 17395779 2 17402143 3 17387654 4 17395564 5 16989875 6 17378649 mean 17324944 SD 164348.7
www.wjpr.net Vol 3, Issue 4, 2014. 1806 Table 8: Analysis result of Tablet dosage form
Brand Name Formulation Labeled amount (mg)
Amount found
(mg) Assay % ± SD
Banzel Tablet 200 198.5 99.25 ± 0.29
Table 9: Summary of validation parameter
Linearity range 10-80 µg/mL
Regression 0.999
LOD 0.886976
LOQ 2.6878064
Intraday precision (% RSD) 0.04-0.73 Interday precision (% RSD) 0.08-1.48
Accuracy 97.15-100.6
Specificity Specific
Table 10: Results of stressed degradation study
Stress Condition/duration % Degradation Acidic/ 1 N HCl, 80° C, 3 h 40.0 Alkaline / 1N NaOH, 80° C, 3 h 88.0 Oxidative/ 3%v/v H2O2 0.21 Photolysis/ sun light, 48 h 0.8
Thermal 100° C/ 12 h 0.20
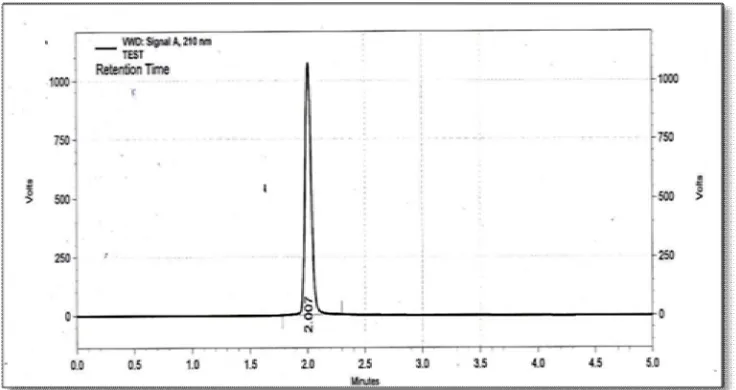
www.wjpr.net Vol 3, Issue 4, 2014. 1807 Figure 4: Chromatogram of Rufinamide Formulation
[image:10.595.115.479.71.296.2]Figure 5: Chromatogram of Acid induced degradation
[image:10.595.122.472.549.746.2]www.wjpr.net Vol 3, Issue 4, 2014. 1808 Figure 7: Chromatogram of thermal degradation
[image:11.595.122.471.85.277.2]Figure 8: Chromatogram of oxidation of Rufinamide
[image:11.595.113.481.539.731.2]www.wjpr.net Vol 3, Issue 4, 2014. 1809 Figure 10: Chromatogram of degradation product of Rufinamide
CONCLUSION
Rufinamide is less stable in acidic and basic condition as compared to oxidation, photolysis
and thermal degradation. All the peaks are resolved well from the standard rufinamide. This
method is accurate, specific, economic and stability indicating method. It follows the
validation parameters mentioned in ICH guideline. So this method can be used for routine
analysis of pharmaceutical dosage form.
REFERENCES
1. Wheless, J.W. and Vazquez, V. Rufinamide: A Novel Broad-Spectrum Antiepileptic
Drug. Epilepsy Currents, 2010; 10: 1-6.
2. Veera Reddy Arava, Sashibhushan Malredddy, Laxminarasimhulu Gorentla,
Sreenivasulu Reddy Thummala. N, N-Dimethylamino acrylate derivatives - Facile
inexpensive synthesis of Rufinamide-an antiepileptic & Allopurinol-a drug for gout.
Scholars Research Library, Der Pharma Chemica, 2011; 3(1): 381-387
3. Hakimian S, Hakimian AC, Anderson GD, Miller JW. Rufinamide: a new anti-epileptic
medication. Expert opinion Pharmacother, 2007; 8(12): 1931-1940.
4. Glauser T, Kluger G, Sachdeo R, Krauss G, Perdomo C, Arroyo S. Rufinamide for
generalized seizures associated with Lennox-Gastaut syndrome. Neurology, 2008; 70(21):
1950–1958.
5. David T. Hsieh and Elizabeth A. Thiele. Efficacy and safety of Rufinamide in padeiatric
www.wjpr.net Vol 3, Issue 4, 2014. 1810 6. Mathrusri M, Sai Sumanth K. Novel spectrophotometric method for the quantitative
analysis of Rufinamide in pharmaceutical dosage forms. Chemical science transaction,
2013; 2(1): 13-18
7. Mathrusri M, Sai Pavan Kumar B, Raj Prakash and Venkatesh B. New derivative
spectrophotometric methods for the determination of Rufinamide in pharmaceutical
dosage forms. Recent Advances in Pharmaceutical Science Research, 2012; 1(1): 106-111
8. JoEtta M, Paul I, Ronald l, Kamisha l. Application of ultra high performance liquid
chromatography by tandem mass spectroscopy for the analysis of lacosamide and
metabolite deslacosamide, Rufinamide and felbamate in serum and plasma. ARUP
Institute for Clinical and Experimental Pathology, Salt Lake City, UT.USA, 2Department
of Pathology, University of Utah School of Medicine, Salt Lake City, UT USA.
9. Giancarlo la Marca et al, “Rapid assay of Rufinamide in dried blood spots by new liquid
chromatography –tandem mass spectroscopy method” J pharmaceut biomed 2011; 54 (1):
192-97
10.Iolanda M, Manuela R, Cinzia F, Valentina F, Giuliana G, Emilio P. Development and
validation of an HPLC–UV detection assay for the determination of rufinamide in human
plasma and saliva. Analytical and Bioanalytical Chemistry. 2011; 401(3): 1013-1021
11.Contin M. Simultaneous HPLC-UV analysis of Rufinamide, zonisamide, lamotrigine,
oxcarbazepine monohydroxy derivative and felbamate in deproteinized plasma of patients
with epilepsy. J. Chromatogr. B Analyt. Technol. Biomed. Life Sci, 2010; 878 (3-4):
461-5.
12.ICH Stability Testing of New Drug Substances and Products Q1A (R2), in: Proceedings
of International Conference on Harmonization, 2003.
13. ICH Validation of Analytical Procedures: Text and Methodology Q2 (R1), in: