Page 1 of 42 Structural and physico-chemical analysis of calcium/ strontium substituted, near-invert phosphate based glasses for biomedical applications
U. Patel,a R.M. Moss,c K.M.Z Hossain,a A.R. Kennedy,a E.R. Barney,a I. Ahmed,a and A.C. Hannon b aFaculty of Engineering, University of Nottingham, Nottingham, NG7 2RD, UK
bISIS Facility, Rutherford Appleton Laboratory, Chilton, Didcot, OX11 0QX, UK
cDepartment of Medical Physics and Biomedical Engineering, University College London, London, UK
Revised for Acta Biomaterialia
Keywords: Biomedical glass; Glass structure; Neutron diffraction; Solid state NMR; Phosphate glass; Strontium; Dissolution rate
Abstract
Neutron diffraction, 23Na and 31P NMR and FTIR spectroscopy have been used to investigate the structural effects of substituting CaO with SrO in a 40P2O5·(16-x)CaO·20Na2O·24MgO·xSrO glass, where x is 0, 4, 8, 12 and 16 mol%. The 31P solid-state NMR results showed similar amounts of Q1 and Q2units for all of the multicomponent glasses investigated, showing that the substitution of Sr for Ca has no effect on the phosphate network. The M-O coordinations (M= Mg, Ca, Sr, Na) were determined for binary alkali and alkaline earth metaphosphates using neutron diffraction and broad asymmetric distributions of bond length were observed, with coordination numbers that were smaller and bond lengths that were shorter than in corresponding crystals. The Mg-O coordination number was determined most reliably as 5.0(2). The neutron diffraction results for the multicomponent glasses are consistent with a structural model in which the coordination of Ca, Sr and Na is the same as in the binary metaphosphate glass, whereas there is a definite shift of Mg-O bonds to longer distance. There is also a small but consistent increase in the Mg-O coordination number and the width of the distribution of Mg-O bond lengths, as Sr substitutes for Ca. Functional properties, including glass transition temperatures, thermal processing windows, dissolution rates and ion release profiles were also investigated. Dissolution studies showed a decrease in dissolution rate with initial addition of 4 mol% SrO, but further addition of SrO showed little change. The ion release profiles followed a similar trend to the dissolution rates observed. The limited changes in structure and dissolution rates observed for substitution of Ca with Sr in these fixed 40 mol% P2O5 glasses were attributed to their similarities in terms of ionic size and charge.
1.
Introduction
Page 2 of 42 Research into bioactive glasses has focused on tailoring glass properties to address specific clinical needs. The ability to introduce new oxides to the basic sodium-calcium phosphate glass network is of great interest as it allows properties such as their dissolution rates to be tailored (see for example works studying the effect of MgO [10], TiO2 [11] and Fe2O3 [12]) and the addition of therapeutic ions for controlled release into the body [13].
One of the most common treatments for osteoporosis was administration of low doses (316–634 mg/kg per day Sr2+) of strontium ranelate or strontium chloride for 9-26 weeks. This was shown to reduce bone resorption and stimulate bone formation via increased replication of preosteoblastic cells. This is beneficial since it is the imbalance of bone deposition and resorption which leads to osteoporosis [14-16] and the dual effect of strontium on bone metabolism has been investigated by researchers for use in orthopaedic applications [17-21]. Recent studies have shown that addition of strontium ions to phosphate glasses has the potential to aid treatment of osteoporosis [17-19,22,23]. Strontium is known to follow a similar physiological pathway in humans as calcium, where a large portion accumulates in bone via ionic exchange of calcium for strontium, thus it has been used in bone therapies [24]. However, controversy does exist in the use of strontium in bone health products due to its ability to displace calcium in the bone at high concentrations and reside there, which in turn leads to increased attenuation of x-rays, leading to overestimation of bone mineral density (BMD) values [25,26]. By incorporating strontium into a fully degradable material, it should be possible to achieve a controlled release of strontium into the body over time.
The dissolution rates of phosphate glasses are dominated by their formulation, though factors such as pH and temperature can also have an effect. Multiple factors contribute to this dependence of dissolution on formulation. The two key factors are network connectivity [27] and the arrangement of modifier cations and modifier-chain bonding in the glass. Previous studies have shown that the addition of alkali and alkaline earth oxides to a phosphate network reduced the glass network connectivity by replacing BO (bridging oxygen) with NBO (non-bridging oxygen) in the phosphate backbone [28] and the modifier oxides occupied interstitial spaces between chains of [PO4] units [29]. The ionic strengths of the modifiers will determine bond strength and this has been shown to influence physical properties such as glass transition temperature and dissolution rates. For example, a highly coordinated modifier cation, with high ionic strength, can increase cross-linking within the glass network, rendering the glass formulation less prone to dissolution [30]. The degradation properties of phosphate glasses are known to be sensitive to the glass structure and understanding the short and medium range order of specific formulations is important to allow glass formulations to be tuned for their potential therapeutic applications.
Page 3 of 42 effect on dissolution rate, for example a decrease in pH has been shown to accelerate glass dissolution [31].
The aim of this study was to investigate phosphate glass formulations which degraded and released strontium ions at a controlled rate. To achieve this it was desirable to substitute strontium into a previously investigated phosphate host glass formulation, ideally retaining the dissolution rate of this previously optimised glass [4]. To enable this, strontium ions were introduced to the glass network (40P2O5·(16-x) CaO·20Na2O·24MgO·xSrO) by substitution for calcium to minimise the changes in the glass structure; cations with the same valence and similar charge to size ratio can be easily substituted within glass structures [34]. The glasses investigated had a fixed P2O5 content at 40 mol% which can be considered to be on the verge of an invert phosphate glass formulation. Invert glasses are defined as containing <40 mol% of P2O5, where they predominantly consist of pyro- and orthophosphates, thus forming a highly depolymerised network with properties governed by the modifier ions [35,36].
Structural studies examining substitution of calcium for strontium in a bioactive silicate glass formulation (49.46SiO2·26.38Na2O·1.07P2O5·(23.08-x)CaO·xSrO; where x= 0, 11.54, 23.08) found a split in the Ca-O, Sr-O, and Na-O nearest neighbour correlations which was attributed to the cations bonding to BO and NBO atoms [23]. This was in agreement with other studies of the sodium environment in silicate glasses [34]. These studies of bioactive silicate glass compositions found that the substitution between two cations within the same periodic group did not disrupt the bonding within the silica glass network.
However, although several studies on the structure of phosphate based glasses have been conducted [37-44], very little is known about the effect of cation substitution on the structure of complex, multicomponent, lower phosphate containing glasses (i.e. for phosphate glasses close to invert glass formulations). This is primarily due to the difficulties associated with the deconvolution of overlapping modifier–oxygen peaks in diffraction data.
In this study, the effect of isostoichiometric substitution of CaO for SrO in a multicomponent phosphate glass fixed with 40 mol% P2O5 has been characterised through examination of the structure and properties of the glasses. Neutron diffraction, 31P MAS (magic angle spinning) NMR and 23Na MAS NMR studies have been conducted to understand the short range order and the coordination environment of the modifiers and results have been related to the thermal properties, dissolution rates and ion release profiles of the glasses.
2.
Experimental
2.1. Sample preparation
Page 4 of 42 furnace and heated to 1150ºC for 1.5h. The melts for the binary samples were quenched between two stainless steel plates and the melts for the multicomponent series were poured into preheated graphite moulds (10ºC above the glass transition temperatureof each sample). The latter were annealed for 1h, followed by slow cooling to room temperature overnight. The amorphous nature of all the multicomponent glasses was confirmed using a Bruker D500 X-ray diffractometer.
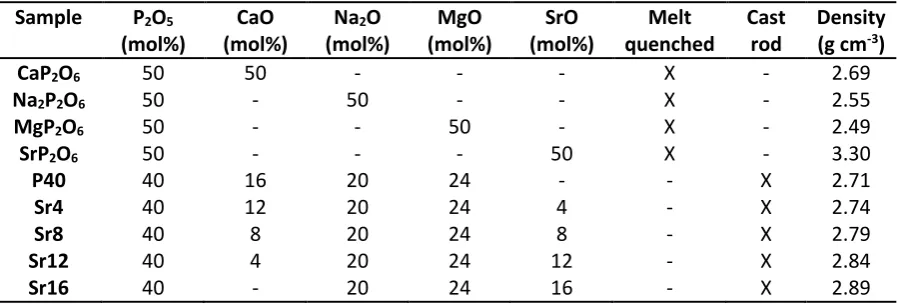
Table 1: Compositions and densities of the samples, with the preparation method indicated by X. Sample P2O5
(mol%) CaO (mol%) Na2O (mol%) MgO (mol%) SrO (mol%) Melt quenched Cast rod Density (g cm-3)
CaP2O6 50 50 - - - X - 2.69
Na2P2O6 50 - 50 - - X - 2.55
MgP2O6 50 - - 50 - X - 2.49
SrP2O6 50 - - - 50 X - 3.30
P40 40 16 20 24 - - X 2.71
Sr4 40 12 20 24 4 - X 2.74
Sr8 40 8 20 24 8 - X 2.79
Sr12 40 4 20 24 12 - X 2.84
Sr16 40 - 20 24 16 - X 2.89
2.2. Density, molar volume and free volume
The density of each sample was measured three times using Micromeritics Accupyc1340 pycnometer, with helium as the displacement gas. For each measurement, a series of repeat readings were taken until a series of five results agreed within an error of ± 0.02gcm-3.
2.3. Thermal analysis
DSC measurements (TA Instruments SDT Q600, UK) were collected on 40mg of sample, with a particle size of 45-63 µm. These were heated from 50 ºC to 1000 ºC at a heating rate of 10 ºC/minute under flowing argon gas to determine the glass transition temperature, Tg, crystallisation temperature, Tc, and melting temperature, Tm of each glass sample.
2.4. Spectroscopy
Energy-dispersive X-ray spectroscopy (EDX) was used to determine glass composition. Glass samples were embedded in epoxy resin and ground using SiC paper followed by diamond polishing. Due to the hygroscopic nature of phosphate glass, industrial methylated spirit (IMS, Sigma Aldrich, UK, ≥99.5%) was used as a lubricating medium to prevent degradation of the sample. Samples were then placed in an ultrasonic bath of IMS for 10 minutes and left to dry, followed by carbon coating with a thickness of ~15nm. EDX measurements of composition were carried out using Oxford Instruments INCA EDX system fitted with a Si-Li crystal detector. The EDX system was attached to a Philips XL30 scanning electron and operated in backscattered electron mode, with an accelerating voltage of 20kV and a working distance of 10mm. Analysis was conducted on three separate areas on each sample, and three separate samples were used for each multicomponent composition.
Page 5 of 42 powder (45-63µm) using a mineral mortar and pestle. The samples were scanned in absorbance mode in the region of 4000 to 550 cm-1 using a standard attenuated total reflectance (ATR) cell (PIKE Technologies). The spectra were analysed using OPUSTM software, including subtraction of air background.
Solid-state 31P and 23Na MAS NMR spectra were obtained via the EPSRC UK National Solid-state NMR Service at Durham using a Varian VNMRS spectrometer and a 4 mm magic-angle spinning probe with a spin rate of 11-12 kHz. They were recorded using direct excitation at a Larmor frequency of 161.87 MHz for 31P and 105.78 MHz for 23Na NMR. The 31P spectra were obtained with a 300 second pulse delay and 4.4 μs pulse duration and were referenced to 85% H3PO4. The 23Na spectra were acquired with a 1 s pulse delay and 1.0 μs pulse duration and were referenced to 0.1 M aqueous NaCl
2.5. Neutron diffraction
Neutron diffraction data were collected on the GEM diffractometer [45] at the ISIS spallation neutron source at Rutherford Appleton Laboratory, UK.
In a neutron diffraction experiment, the differential cross section, 𝑑𝜎𝑑Ω, or total scattering, 𝐼(𝑄) is measured;
𝑑𝜎
𝑑Ω= 𝐼(𝑄) = 𝐼
𝑠(𝑄) + 𝑖(𝑄) (1)
where the total scattering from a sample is equal to the sum of the self-scattering, 𝐼𝑠(𝑄), and the distinct scattering, 𝑖(𝑄). Coarsely ground binary samples were contained in vanadium cylinders with a diameter of 10.3 mm and wall thickness of 40 µm. The Sr-series glasses were cast into rods and fixed to sample holders, eliminating the need for a container. In addition to collecting interference patterns for each sample, data for the empty cans, a vanadium rod and the empty instrument were also obtained in order to carry out the appropriate corrections (for attenuation, multiple scattering and self-scattering) using the programme GUDRUN [46] and ATLAS [47] software.
The total correlation function ( 𝑇(𝑟)) can then be calculated via Fourier transformation of 𝑖(𝑄).
𝑇(𝑟) = 𝑇0(𝑟) + 2
𝜋 ∫ 𝑄𝑖(𝑄)𝑀(𝑄) sin(𝑟𝑄) 𝑑𝑄
∞
0 (2)
Where 𝑇0(𝑟) is the average density contribution to the correlation function (𝑇0(𝑟) =
4𝜋𝑟𝜌0(∑𝑁 𝑐𝑙𝑏̅𝑙
𝑙=1 )2), 𝑟 is the distance between atoms, 𝜌0 is the average atomic number density, 𝑁 is the number of elements in the sample, and 𝑐𝑙 and 𝑏̅𝑙 are respectively the atomic fraction and coherent scattering for element 𝑙. 𝑀(𝑄) is a modification function (e.g. the Lorch [48] function or a step function), which is used to take account of the fact that experimental data are only available up to some finite maximum momentum transfer, 𝑄max , not infinity as in Equation (2).
Structural information was obtained by fitting 𝑇(𝑟), which is the weighted sum of all the possible partial correlation functions, 𝑡𝑙𝑙′(𝑟), given by
Page 6 of 42 At short distances, where a peak in 𝑇(𝑟) arises from only one particular pair of elements (𝑙 and 𝑙′), the peak area, 𝐴𝑙𝑙′, interatomic distance, 𝑟𝑙𝑙′, and the coordination number, 𝑛𝑙𝑙′, can be calculated,
according to:
𝑛𝑙𝑙′ = 𝐴𝑙𝑙′ 𝑟𝑙𝑙′
(2−𝛿𝑙𝑙′)𝑐𝑙𝑏̅𝑙𝑏̅𝑙′ (4)
where 𝛿𝑙𝑙′ is the Kronecker delta.
2.6. Dissolution and ion release studies
The dissolution studies were conducted using glass discs (c.a. 9mm Ø by 5mm width) degraded in 30ml of ultra-pure water (18.2 MΩ) at 37ºC. The medium was replenished at each time point (1, 3, 7, 14, 21 and 28 days), and replaced with 30ml of fresh ultra-pure water. Conducting pH measurements were performed on the water that was removed at each time point. This study was repeated using discs with a dimension of c.a. 9mm Ø by 10mm width in deionised water (DI) and phosphate-buffered saline (PBS). The release of Ca2+, Na+, Mg2+ and Sr2+ from the dissolution media at each time point were quantified using an ICS-1000 ion chromatography system (Thermo Scientific, Dionex, UK). An eluent of 20mM methanosulfonic acid (Sigma-Aldrich) was used. All specimens were analysed using a Dionex IonPac® CS12A 2mm x 250mm analytical column, and analysed under suppressed conductivity (CSRS 300 2mm, Thermo Scientific, Dionex). Results were calculated against a four-point calibration curve using a Combined Six Cation Standard II and Strontium (Sr2+) 1000mg/l in water (Thermo Fisher Scientific). A stock solution containing the cations was prepared. From which serially diluted cation standards were prepared at the following dilution factors; 1:1024, 1:256, 1:64 and 1:16. Data analysis was performed using Chromeleon® software, and the cumulative release per unit area of each sample was calculated.
2.7. Statistical analysis
For the dissolution measurements, the average values and standard deviation were calculated for a sample size n=3. Statistical analysis was performed using GraphPad Prism 7.01 (GraphPad Inc., San Diego, CA). One-way analysis of variance (ANOVA) was calculated followed by Tukey’s multiple comparison test. The mean difference was considered to be significant at 0.05 and 95% confidence interval.
The errors on the data points in the measured neutron spectra were determined by counting statistics (i.e. for N counts the standard deviation is N), and these were propagated through the
Page 7 of 42
3.
Results
The bulk characterisation results presented here are those of the multicomponent glasses in the series P40, Sr4, Sr8, Sr12 and Sr16. The binary glasses were fabricated and analysed in order to aid deconvolution of the neutron diffraction correlation functions measured for the multicomponent glasses.
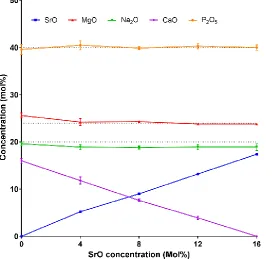
Fig. 1 Composition of multicomponent glass samples as measured by EDX. Dotted lines represent the target value.
3.1. Glass characterisation
Fig. 1 shows the results of the EDX measurements on the multicomponent glasses. All compositions were confirmed to be within the 1-2% of the target composition, and hence the nominal compositions were used for the analysis of the structural studies. A ~1 mol % reduction in CaO was accompanied by a SrO increase of ~1 mol% compared to that of the target values. The density and molar volume for the multicomponent glasses are shown in Fig. 2. The density increases by ~7% from 2.71 to 2.89 g/cm3 as SrO is substituted for CaO, whilst the molar volume increases by ~2% (from 32.41 cm3 mol-1 to 33.02 cm3 mol-1).
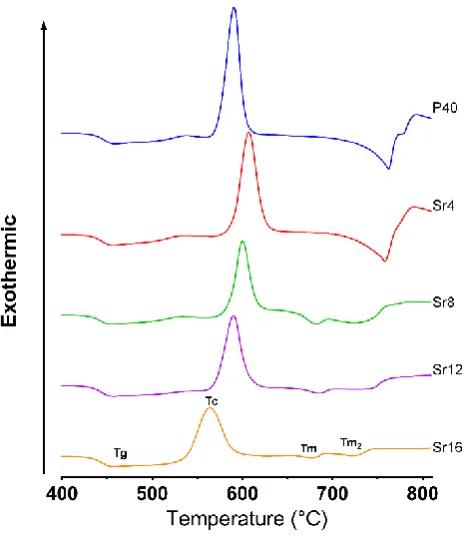
[image:7.595.80.353.183.442.2]Page 8 of 42 small overall decrease of only 7 C in Tg as strontium substitutes for calcium, and a much more marked decrease in the melting temperature, Tm.
Fig. 2 Density and molar volume of the multicomponent 40P2O5·(16-x)CaO·20Na2O·24MgO·xSrO glasses.
[image:8.595.83.385.146.404.2] [image:8.595.119.352.469.738.2]Page 9 of 42 Table 2: Glass transition, Tg, crystallisation, Tc, onset of crystallisation, Tonset, and melting temperatures, Tm, for each composition is given, together with the calculated thermal processing window, Tonset-Tg, of each glass.
Fig. 4 FTIR spectra for the multicomponent glasses. The dotted lines indicate prominent bands in the spectra, and their positions are given in cm-1.
3.2. Spectroscopy
Fig. 4 shows the FTIR spectra for the multicomponent glasses. The prominent band positions (in cm-1) are indicated by dotted lines.
Fig. 5 shows the solid-state 31P and 23Na MAS NMR spectra for the multicomponent glasses. The two dominant isotropic peaks in the 31P NMR spectra (Fig. 5a) are at ca. -8.0 ppm and -22 ppm. Fig. 5b shows the 23Na NMR spectra, which exhibit a single, broad, slightly asymmetric peak at approximately 15 ppm [50,51].
Glass code Tg (ºC) Tonset (ºC) Tc (ºC) Tm (ºC) Tm2 (ºC) Tonset-Tg (ºC)
P40 450 573 591 762 123
Sr4 447 588 609 759 141
Sr8 447 582 601 734 854 135
Sr12 447 571 589 685 742 124
Sr16 443 538 565 679 725 95
[image:9.595.67.519.131.215.2] [image:9.595.85.409.259.469.2]Page 10 of 42 Fig. 5 Solid state MAS NMR spectra of the multicomponent glasses: (a) 31P, and (b) 23Na.
3.3. Neutron diffraction
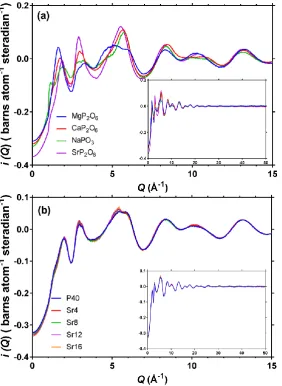
[image:10.595.107.376.80.411.2]Page 11 of 42 Fig. 6 Distinct scattering, i(Q), of (a) binary metaphosphate, and (b) multicomponent glasses 40P2O5·(16-x)CaO·20Na2O·24MgO·xSrOglass, where x is 0, 4, 8, 12 and 16 mol% SrO.
[image:11.595.88.371.87.474.2]Page 13 of 42 3.4. Dissolution and ion release
0 1 0 0 2 0 0 3 0 0 4 0 0 5 0 0 6 0 0
6 .5 7 .0 7 .5 8 .0
T im e ( H r s )
p
H
P 4 0 S r 4 S r 8 S r 1 2 S r 1 6
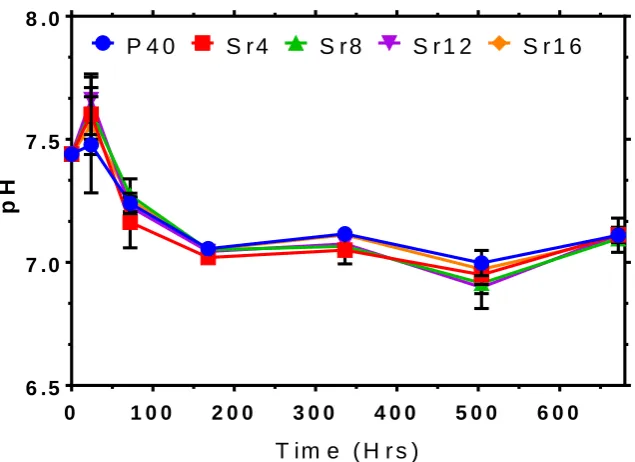
Fig. 8 The pH of the dissolution media (ultra-pure water) at each time point for each of the multicomponent glasses.
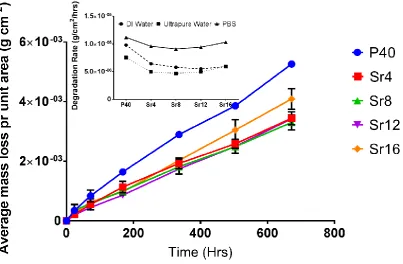
The pH of the water during the dissolution studies is shown in Fig. 8, whilst Fig. 9 shows the average mass loss per unit area for multicomponent glasses in ultra-pure water, as measured by the procedure described in Section 2.6. The inset to Fig. 9 shows the dissolution rates for the multicomponent glasses determined via the slope of best fit for each composition in all three media tested. The initial addition of SrO to the glass (adding 4 mol% SrO) caused a reduction in the dissolution rate.
[image:13.595.86.404.110.341.2]Page 15 of 42 Fig. 10 Cumulative cation release profiles from the multicomponent glasses investigated, which were degraded in ultra-pure water. The inset on each graph shows the ion release rates normalised to the surface area.
4.
Discussion
4.1. Glass characterisation
Similar increases/decreases in compositions and error margins to those shown in Fig. 1 have also been reported previously for phosphate glasses and such discrepancies were attributed to losses occurring during melting, and/or due to the initial compositions of the precursor salts themselves, in particular those containing phosphate, due to its hygroscopic nature [4,53-55]. The atomic mass of Sr is more than double that of Ca, and it is by far the heaviest element in the samples; this leads to the relatively large 7% increase in mass density as SrO is substituted for CaO (see Fig. 2 and Table 3). Also, the ionic radius (and hence the ionic volume) of Sr2+ is larger than that of Ca2+ [56], and this leads to the smaller 2% increase in molar volume as SrO is substituted for CaO. The changes observed with increasing SrO content are consistent with the results of a previous study [19] which reported a 0.04 g/cm3 increase on substituting 5mol% SrO for Na
[image:15.595.85.508.78.423.2]Page 16 of 42 change in density from 2.6 g/cm3 to 3.0 g/cm3 when substituting SrO for CaO in 50P2O5·10Na2O·5TiO2·(35-x)CaO·xSrO glasses (with x = 0, 3.5, 17.5 and 35 mol% SrO).
Table 3: Simple properties of calcium and strontium ions, relating to density and molar volume. Ion Atomic mass (amu) Ionic radius [56] (Å) Ionic volume (Å3)
Ca2+ 40.08 1.00 4.19
Sr2+ 87.62 1.18 6.88
Our DSC results show that, when Sr substitutes for Ca, the general overall trend is for a small decrease in Tg, and a larger decrease in Tm (see Table 2). The reason for this behaviour is that (as is discussed below in relation to the neutron diffraction results) Sr-O bonds are weaker than Ca-O bonds [19], and this effect is more significant than any change in the degree of cross-linking of the network. Lakhkar et al. [57] have observed similar results to those reported here when substituting SrO for CaO in 50P2O5·(30-x)CaO·17Na2O·3TiO2·xSrO glasses (where x = 0, 1, 3, 5 mol% SrO). Furthermore, Abou Neel et al. [19] showed that when Sr2+ substituted for Na+,a monovalent cation, in 50P2O5·(20-x) Na2O·30CaO·xSrO glasses (where x = 0, 1, 3 and 5 mol% SrO), a large increase in Tg, from 383 to 428 ºC was observed. Since Sr is divalent, Sr-O bonds are significantly stronger than Na-O bonds.
Studies of silicate glass systems [18,22] have shown that, in contrast to the behaviour of Tg for phosphate glasses, the substitution of strontium for calcium results in an increase in Tg, and it has been suggested that this is due to the expansion and disruption of the silicate glass network with increased strontium due to the larger ionic radius of Sr compared to Ca. It may be that the different behaviours for silicates and phosphate arise due to the lower connectivity of the phosphate network, which is a consequence of the larger number of NBOs in phosphates.
The DSC traces of our multicomponent glasses show two melting features for ≥ 8mol% SrO, and also the crystallisation peak is broader for higher SrO content (see Fig. 3 and Table 2). A recent study [55] investigating the substitution of CaO for SrO in glasses with a fixed P2O5 content of 50mol% found that increasing the SrO content led to a more prominent melting peak (which was not apparent in this study), and a reduction in the thermal processing window. The presence of two Tm peaks for glasses with fixed P2O5 contents of 45 and 50 mol% has previously been correlated with the following two dominating crystal phases; sodium calcium phosphate (NaCa(PO3)3), and a beta calcium metaphosphate (CaP2O6), as reported by Ahmed et al. [1] when investigating ternary 50P2O5·40CaO·10Na2O and 55P2O5·35CaO·10Na2O glass systems. They reported that the predominant crystal phase in both 45 and 50 mol% P2O5 ternary glasses was sodium-calcium phosphate. A NaCa(PO3)3 crystal phase was also found to be dominant in a previous study by Lakhkar et al. [58] when investigating CaO substitution with SrO in 0.5P2O5·0.15Na2O·0.05TiO2 ·(0.3-x)CaO·xSrO glasses.
Page 17 of 42 the rearrangement of atoms in order to form a critical size defect i.e. the entropy of mixing increases [36,53]. Further substitution of CaO with SrO resulted in a gradual decrease in the thermal processing window which is suggested to be due to the lower field strength of Sr2+ (0.28 valence/Å2) compared to Ca2+ (0.33 valence/Å2) according to Dietzel [60,61]. This, correlated with the observation that the calcium free (Sr16) glass composition had to be cooled much more rapidly than the others to form a glass, agrees well with the work of Lee et al. [61,62] who observed that a higher tendency of crystallisation occurred with increasing SrO content in a 30P2O5·7MgO·3TiO2· (60-x)CaO·xSrO and 30P2O5·7Na2O·3TiO2·(60-x)CaO·xSrO (mol %) glass system where x is 0-60. The narrowing of the thermal processing window with increasing SrO, may potentially make thermal post processing (such as extrusion and fibre drawing) of high strontium content phosphate glasses more difficult than for lower strontium containing formulations.
4.2. Fourier transform infrared spectroscopy
The assignments of the bands in the FTIR spectra (Fig. 4) are as follows: The first two prominent absorption bands at 725 and 890 cm-1 are due to symmetric and asymmetric stretching of P-O-P linkages respectively [63]. The bands near 990 and 1100 cm-1 have been assigned respectively to symmetric and asymmetric stretching of chain end units associated with Q1 units [63,64], whilst the 1250 cm-1 band has been assigned to the asymmetric stretch of a Q2 chain unit [55,64-66] (where the n in Qn refers to the number of BO atoms in the tetrahedral PO
4 unit). A small feature at 1040 cm-1 is assigned to the symmetric stretch of NBOs in Q1 groups [65-67]. Both the peak intensities and positions remained constant for all multicomponent glasses studied, suggesting similarities in the structure of the phosphate part of the network between all compositions. Al Qaysi et al. [55] investigated the FTIR spectra of Sr-containing phosphate glasses in the composition 50P2O5·10Na2O·5TiO2·(35-x)CaO·xSrO (where x=0, 3.5, 17.5 and 35), which showed an unexpected decrease in intensity for peaks at 900cm-1 associated with P-O-P asymmetric stretching of Q2 units and an increase in peak intensity at 1100cm-1 associated with Q1 units with increasing Sr content. The lack in variation between the samples examined in this study using FTIR was attributed to the fact that the O/P ratio (3.25) was constant for each sample, thus not influencing the phosphate network structure.
4.3. Nuclear magnetic resonance spectroscopy
The two dominant isotropic peaks in the 31P NMR spectra at ca. -8.0 ppm and -22 ppm (Fig. 5) are ascribed to Q1 and Q2 units respectively [28,63]. The relative intensity of these features remained constant with Ca/Sr content, supporting the analysis of the FTIR spectra. This behaviour arises due to the oxygen concentration in the glasses which does not change. For an alkali or alkaline earth phosphate glass with a composition of 100y mol% P2O5, with y in the range from 0.5 to 0.333, there are expected to be only Q2 and Q1 units, with an abundance Q1=(1-2y)/y (and Q2=1-Q1). For the multicomponent glasses, y=0.4, and hence equal numbers of Q2 and Q1 units are expected. The fact that equal numbers are observed (Table 4) is evidence that all of the modifiers in the glass are indeed acting as network modifiers, and not as network formers. If the phosphate glass contains only Q2 and Q1 units, then the average number of BO atoms in a PO
4 unit is given by
Page 18 of 42 This is also sometimes referred to as network connectivity [27]. Here, 𝑄𝑛 indicates the fraction of P with n bonds to bridging oxygen (BO), as determined by 31P NMR.
This study showed a constant network connectivity 𝑁BO≈ 1.5 as given in Table 4. This corresponds to the fact that the overall modifier content was constant throughout the glass series. In summary, the 31P MAS NMR and FTIR results show no evidence for changes in the phosphate part of the network as Sr substitutes for Ca, and this outcome is predicted to have negligible effects on the dissolution rate of these glasses. If the phosphate glass contains only Q1 and Q2 units, and there are no rings in the structure, then the average number of PO4 tetrahedra in a chain is 𝑁̅ = 2 𝑄⁄ 1. Thus the average length of chains in our multicomponent glasses is four tetrahedra. This result is based on the assumption that two Q1 units are required to terminate the ends of a chain, with Q2 units between the ends. However, it is also assumed that there are no rings of PO4 units. For compositions close to metaphosphate (O/P = 3) it has been shown that cyclic phosphate ring structures can also exist [68], necessitating the formation of shorter chains or phosphate dimers (i.e. pyrophosphates). The 23Na NMR spectra (Fig. 5b) exhibit a single, broad, slightly asymmetric peak at approximately 15 ppm [50,51]. Detailed information on the chemical environment for sodium is difficult to obtain due to both the broadening that arises from the distribution of bond angles and the inability to eliminate second-order quadrupolar interactions [50,51]. A study of the sodium environment in a binary sodium tellurite glass system found that increasing concentration of Na2O in the glass, caused a change in chemical shift in the 23Na NMR spectra, which was attributed to a decrease in the sodium-oxygen coordination from six to five [69]. The lack of change in chemical shift in this study indicated that substituting CaO for SrO had no effect on the local environment of sodium atoms in the glass.
Table 4: Chemical shifts (ppm referenced using H3PO4) and relative concentrations of Qn units determined by solid-state 31P MAS NMR of each composition investigated and the numbers of bridging oxygens (BOs) and non-bridging oxygens (NBOs) per PO4 unit, calculated using equation 5. Glass
code
Relative intensity at -8 ppm /% (Q1)
Relative intensity at -22 ppm /% ( Q2)
NBO NNBO
P40 49 51 1.51 2.49
Sr4 49 51 1.51 2.49
Sr8 49 51 1.51 2.49
Sr12 50 50 1.50 2.50
Sr16 49 51 1.51 2.49
4.4. Neutron diffraction
[image:18.595.73.455.511.612.2]Page 19 of 42 metaphosphate glasses (CaP2O6, SrP2O6, MgP2O6 and NaPO3) in addition to the multicomponent glasses. Modifier-oxygen peak positions, widths and areas from fitting the correlation functions for the binary metaphosphate glasses were used to aid in the interpretation of the neutron diffraction data from the multicomponent glasses.
4.4.1 Diffraction patterns
For the binary metaphosphate glasses the FSDP shifts slightly to higher Q with increasing alkaline earth radius (Fig. 6a). This shift is surprising, because the position of the FSDP arises from the typical size of the cages formed by the network [70]. It has previously been suggested, on the basis of molar volume studies, that an expansion of the silicate network occurs when strontium is substituted for calcium in silicate glasses [17]. However, the FSDP shift does not provide support for an expansion of the phosphate network as Sr substitutes for Ca. In contrast, the diffraction patterns for the multicomponent glasses show almost no change in the FSDP with composition (see Fig. 6b), suggesting that the size of the network cages does not change significantly as Sr substitutes for Ca. 4.4.2 The P-O coordination
Page 20 of 42 Table 5: The phosphorus coordination in the binary and multicomponent glasses, from fitting 𝑇(𝑟) obtained using a step modification function.
Sample Atom pair 𝒍 − 𝒍′ Bond length (𝒓𝒍𝒍′/Å)
Bond length variation (〈𝒖𝒍𝒍𝟐′〉½/Å)
Coordination number (𝒏𝒍𝒍′)
MgP2O6
P-NBO 1.4822 (4) 0.0347 (5) 1.92 (1)
P-BO 1.5998 (7) 0.0465 (6) 1.92 (1)
P-O sum 3.83 (2)
CaP2O6
P-NBO 1.4848 (4) 0.0375 (4) 2.00 (1)
P-BO 1.5969 (6) 0.0483 (5) 2.00 (1)
P-O sum 4.00 (2)
SrP2O6
P-NBO 1.4869 (4) 0.0356 (4) 1.88 (1)
P-BO 1.5962 (8) 0.0527 (7) 1.88 (1)
P-O sum 3.77 (2)
Na2P2O6
P-NBO 1.4776 (8) 0.0365 (8) 1.93 (2)
P-BO 1.604 (1) 0.046 (1) 1.93 (2)
P-O sum 3.86 (4)
P40 P-NBO 1.49995 (5) 0.04196 (5) 2.458 (2)
P-BO 1.6039 (1) 0.0565 (1) 1.475 (1)
P-O sum 3.932 (3)
Sr4 P-NBO 1.4988 (2) 0.0386 (3) 2.435 (9)
P-BO 1.6031 (6) 0.0494 (6) 1.461 (5)
P-O sum 3.90 (1)
Sr8 P-NBO 1.4990 (1) 0.0383 (1) 2.407 (5)
P-BO 1.6079 (3) 0.0522 (3) 1.444 (3)
P-O sum 3.851 (8)
Sr12 P-NBO 1.4997 (2) 0.0383 (3) 2.41 (1)
P-BO 1.6083 (7) 0.0541 (6) 1.445 (7)
P-O sum 3.85 (2)
Sr16 P-NBO 1.4992 (3) 0.0394 (3) 2.38 (1)
P-BO 1.6070 (8) 0.0530 (7) 1.430 (6)
Page 21 of 42 4.4.3 Modifier coordination in binary metaphosphates
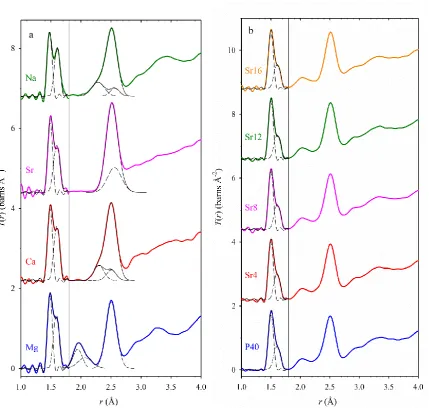
The region of 𝑇(𝑟) from ca. 1.8 Å to ca. 2.7 Å has contributions from modifier M-O bonds, and also from O…O distances in PO4 tetrahedra at ca. 2.5 Å. Whereas the P-O bonds can be resolved into two separate types of bond with distinctively different lengths, differing by ~0.1 Å, there is no evidence for a splitting in the 1.8-2.7 Å region into such narrowly resolvable interatomic distances. Therefore this region of 𝑇(𝑟) was obtained by Fourier transformation with the Lorch modification function, virtually eliminating termination ripples, but at the cost of some increase in real-space resolution. Magnesium is the smallest of the modifier cations in this study, and the Mg-O peak in 𝑇(𝑟) for MgP2O6 is well separated from the O…O peak and the P-O peaks (Fig. 7a). Contrastingly, for all the other samples studied there is significant overlap between the M-O and O…O peaks. Thus 𝑇(𝑟) for MgP2O6 provides both a clear measurement of the Mg-O coordination, and a clear measurement of the O…O peak that can be used to aid the interpretation of the results for the other binary metaphosphate samples.
The Mg-O peak in 𝑇(𝑟) for MgP2O6 shows a clear asymmetry, with an extended tail on the long distance side, and hence it was fitted using two single distance peaks, with the parameters given in Table 6. Note that these two peaks are merely a convenient way of parameterising the distribution of Mg-O distances, and are not evidence of two discrete Mg-O bond lengths. The large error on the total Mg-O coordination number from the fit, 5.0±0.7, arises from the uncertainty of apportioning area between the two peak fit components, and is an over-estimate. Integration of the correlation function from 1.76 to 2.25 Å yields a Mg-O coordination number of 4.76±0.02 and a mean bond length of 2.001 Å, but provides no information on the distribution of distances. Integration gives an underestimate of the value of nMgO, because the high r tail of the Mg-O distribution is not included. The difference between the two values for nMgO can be taken as a realistic upper bound on the error in the coordination number, leading to a final result nMgO=5.0(2). There is a number of previous diffraction studies of MgP2O6 glass in the literature [74-79]; the earlier reports do not have sufficient real-space resolution to reveal the asymmetry of the Mg-O peak, but it has been noted in the later reports [77-79], which have better resolution. The earlier reports with a symmetric distribution of Mg-O distances reported smaller coordination numbers ranging from 4.0 to 4.6, whereas the later reports with an asymmetric distribution reported larger coordination numbers ranging from 5.3 to 6.3. However, none of the previous reports had a value of Qmax as high as in the present study, and this is the first time that MgP2O6 glass has been measured with sufficient resolution that there is insignificant overlap between the Mg-O and O…O peaks in 𝑇(𝑟); Fig.7 shows the best resolved measurement of the Mg-O peak that has yet been made.
Page 22 of 42 expected for a smaller coordination number in the glass, since bond valence consideration shows a strong correlation between coordination number and bond length [83,84]. It is of note that studies of magnesium silicate glasses also find an asymmetric distribution of Mg-O distances [85], and coordination numbers less than 6. In particular, the Mg-O coordination number in magnesium metasilicate glass, MgSiO3, has been measured using neutron diffraction with isotopic substitution to be 4.5(1), with fitted bond lengths of 1.997 Å and 2.21 Å [86]. Comparison of our measurement of
Page 24 of 42 Table 6: The M-O (and O…O) parameters from fitting the correlation functions, 𝑇(𝑟), of the binary metaphosphate glasses, and the multicomponent Sr-series glasses. See the text for details of the fitting. The valence calculated from the parameters for M-O bonds is also given.
Sample Atom pair 𝒍 − 𝒍′ Bond length (𝒓 𝒍𝒍′/Å)
Bond length variation (〈𝒖𝒍𝒍𝟐′〉½/Å)
Coordination number (𝒏𝒍𝒍′)
M-O valence (e)
MgP2O6
Mg-O 1.945 (1) 0.066 (4) 2.6 (5) 1.30
Mg-O 2.07 (3) 0.11 (1) 2.4 (5) 0.87
Mg-O sum 5.0 (7) 2.17
O…O 2.5059 (9) 0.084 (1) 4.29 (4)
CaP2O6
Ca-O 2.299 (2) 0.078 (2) 2.91 (6) 1.19
Ca-O 2.506 (2) 0.069 (2) 2.10 (7) 0.49
Ca-O sum 5.01 (9) 1.68
SrP2O6 Sr-O 2.559 (1) 0.111 (1) 5.10 (6) 1.55
Na2P2O6
Na-O 2.284 (2) 0.100 (3) 2.58 (6) 0.70
Na-O 2.564 (3) 0.070 (5) 1.20 (7) 0.15
Na-O sum 3.77 (9) 0.85
Multicomponent Sr-series glasses
Mg-O 2.01 0.09 2.77 1.18
Mg-O 2.06 0.09 2.19 0.81
Mg-O sum 4.96 1.99
O…O 2.51 0.09 4.25
The peak at ca. 2.5 Å in 𝑇(𝑟) for MgP2O6 glass was fitted by a single peak with the parameters given in Table 6. The average O…O coordination number for the O…O distance in a PO4 unit in an alkali or alkaline earth phosphate glass with 100y mol% P2O5 is given by
𝑛OO= 3𝑛OP = 1+4𝑦24𝑦 (6)
and thus for the metaphosphate composition (y=0.5) a value nOO=4 is expected. The O…O coordination number, nOO=4.29(4), from the fit is larger than this value, and the discrepancy is also apparent from the glass/crystal comparison shown in Fig.8. In the crystal there are only O…O distances in the range ~2.25 Å – 2.7 Å, and the discrepancy is evidence that in the glass there are also a small number of other types of distance in this range. It is most probable that the extra contribution in this distance range is due to cation-cation pairs, perhaps P-P pairs with small P-Ô-P bond angles ~110.
Page 25 of 42 atomic fraction, cO, to the alkaline earth metaphosphates, and hence for this sample the O…O peak was multiplied by 0.9 prior to the subtraction (see Eqn. 3). The parameters for the peaks fitted to the M-O distributions are given in Table 6, together with a bond-valence [83,84] calculation of the valence of the M-O bonds. The valence sums are reasonable but are not as close to the ideal values (the formal valence of the M cation) as is the case for the Mg-O peak fit; this is perhaps to be expected because the fits are derived from a region of 𝑇(𝑟) that is dominated by the O…O contribution.
The Ca-O distribution in CaP2O6 is asymmetric and was fitted by two peaks, similar in form to the Mg-O distribution, but with a greater spread in distances. The total Ca-O coordination number of 5.01 for the glass is relatively small compared to the average value of 7.5 for crystalline -Ca(PO3)2 [87], but the crystal has a much longer average Ca-O bond length of 2.47 Å compared to the average value of 2.38 Å for the fit reported in Table 6, and so the result may be reasonable. In a combined neutron and X-ray diffraction study of calcium metaphosphate glass, Wetherall et al. [44] have found a Ca-O coordination of 5.2 at a distance of 2.35 Å, similar to our result, and also additional coordination of 1.7 at a distance of 2.86 Å, beyond the range that we have addressed.
Our fit to the Sr-O distribution in SrP2O6 consists of a single peak at a distance of 2.559 Å. Martin et al. [23] have found evidence for an asymmetric distribution of Sr-O distances in silicate glass, and it is likely that there is also an additional Sr-O component at longer distance in metaphosphate glass, as for Mg-O and Ca-O, but this is beyond the range that we have been able to probe. The measured Sr-O coordination number of 5.96 for the glass is smaller than the value of 8.0 for crystalline
-Sr(PO3)2 [88], but the crystal has a longer average bond length of 2.65 Å, and so it is expected to have a larger coordination number. In a high energy X-ray diffraction study of strontium metaphosphate glass, Hoppe et al. [89] have determined a Sr-O coordination number and bond length of 6.0 and 2.552 Å, very similar to those reported here.The Na-O distribution in Na2P2O6 is asymmetric and was fitted by two peaks, as for the Mg-O and Ca-O distributions, but with an even greater spread in distances. The measured Na-O coordination number of 3.77 is smaller than the value of 5.0 for crystalline
-NaPO
3 [90], but the crystal has a longer average bond length, 2.43 Å, compared to the average for the glass, 2.36 Å, and so the crystal should be expected to have a larger coordination number. In a neutron diffraction study of sodium metaphosphate glass, Pickup et al. [37] found a Na-O coordination number of 4.0 at a single distance of 2.33 Å, whilst in a combined neutron and X-ray diffraction study Hoppe et al. [91] found an asymmetric distribution of Na-O distances with a total coordination number of 4.20.In summary, we have found that in binary metaphosphate glasses M-O (M=Mg, Ca, Sr, Na) coordination numbers are smaller and M-O bond lengths are shorter than in corresponding crystals. The distributions of M-O bond lengths are broad and asymmetric.
4.4.4 Modifier coordination in multicomponent glasses
Page 26 of 42 and O…O pairs). Fig. 11b shows a comparison of 𝑇(𝑟) for the five Sr-series multicomponent glasses, showing a great deal of similarity. Nevertheless, as Sr substitutes for Ca, there are small differences either side of the major peak at ~2.5Å, consistent with the loss of the Ca-O contribution at shorter distances and the growth of the Sr-O contribution at longer distances. Fig. 11c shows a comparison of 𝑇(𝑟) for MgP2O6 and P40, and there is a marked difference in the clearly resolved Mg-O peak at ca. 2.0 Å. As shown by Eqn. 3, the Mg-O contribution is weighted by the Mg atomic fraction, cMg, and this is why the Mg-O peak for P40 (24 mol% MgO) has roughly half the size of the peak for MgP2O6 (50 mol% MgO). However, the inset to Fig. 11c shows the region around the Mg-O peak after division by the factor 2𝑐Mg𝑏̅Mg𝑏̅O, so as to yield the Mg-O partial correlation function, 𝑡MgO(𝑟). This inset shows that for P40 the Mg-O distribution is shifted significantly to longer bond length. In a neutron diffraction study of three magnesium phosphate glasses of different composition, Suzuya et al. [78] have also observed composition-dependent changes in the distribution of Mg-O distances.
Fig. 11b shows that for the Sr-series, 𝑇(𝑟) is almost exactly the same, and the only small identifiable differences are consistent with the substitution of Sr for Ca. That is to say, the substitution of Sr for Ca causes a loss of area in the region of the Ca-O distribution (r~2.15-2.40 Å), and a growth in area in the region of the Sr-O distribution (r~2.45-2.95 Å). Therefore, a fitting approach was adopted for the Sr-series in which it is assumed that the coordination of each modifier ion is the same in all of the samples, i.e. the M-O coordination number and distribution of M-O bond lengths remains the same, independent of SrO content. In this approach, the correlation functions of all five multicomponent Sr-series glasses were fitted simultaneously, with one single set of parameters (𝑟𝑙𝑙′, 〈𝑢𝑙𝑙2′〉½and 𝑛𝑙𝑙′)
to describe each coordination, as given in Table 6. This was achieved by use of a specially developed version of the programme NXFit [92], which also takes into account the correct real-space resolution function (as for PFIT) [71,72], but does not evaluate errors on the fitted parameters. For Ca-O, Sr-O and Na-O, the parameters (𝑛𝑙𝑙′, 𝑟𝑙𝑙′, and 〈𝑢𝑙𝑙2′〉½) were fixed at the values found for the binary
metaphosphates (Table 6), because no evidence has been found for a change. On the other hand, Fig. 11c shows clear evidence for a marked change in the Mg-O parameters, and hence these were allowed to vary in the fit. Also the parameters for the O…O peak were allowed to vary, and the P-O peak was included in the fit so as to take into account the small overlap with the Mg-O peak. The correlation functions obtained using the Lorch modification function were fitted in this fitting procedure over the range of 1.5 to 2.65 Å. The fitted functions are shown in Fig. 12, and the final entry of Table 6 gives the parameters obtained. The fits to the modifier-oxygen contributions as shown in Fig. 12 are satisfactory, although the residual for the Sr16 glass between 2.2 and 2.7 Å is noisier than for the others.
Page 27 of 42 distance than for 50 mol% P2O5, but with little change in coordination number. Also Karakassides et al. [93] have reported molecular dynamics calculation for three magnesium phosphate glass compositions, predicting a Mg-O coordination number of five for all compositions, but with a small shift to longer Mg-O distance as the MgO content increases. Thus our result is consistent with the literature.
Fig. 12 Total correlation functions, T(r), of multicomponent glasses, together with the results obtained by simultaneously fitting all five functions simultaneously using a specially developed version of the programme NXFit [92]. See text for details of the fitting, and see legend for explanation of the various lines.
4.4.5 Mg-O coordination in multicomponent glasses
[image:27.595.83.501.180.463.2]Page 28 of 42 and area. This may be the reason for the noisier residual noted above for the Sr-rich compositions, especially Sr16.
Fig. 13 The correlation functions of the multicomponent glasses P40 and Sr16, after subtraction of the P-O, Na-O, Ca-O and Sr-O peaks; see the text for details. Also shown are examples of atomic environments giving rise to shorter and longer Mg-O bonds. The central (red) atom is a NBO, bonded to one phosphorus (small sphere), one Mg atom (intermediate size sphere), and either one or two other modifier cations (e.g. Sr, large spheres).
The difference functions for the five multicomponent glasses were fitted using two peaks to represent Mg-O and O…O distances respectively (in this case, two Mg-O components were not found to be required or supported by the experimental data), leading to the parameters given in Table 7. The dependence of the parameters on the Ca/Sr substitution is shown in Fig. 14. There is very little change in the fitted parameters for the O…O peak, whilst in contrast there is a small but consistent growth in the O coordination number, mean O bond length, and variation in Mg-O bond length, as Sr substitutes for Ca.
[image:28.595.82.507.124.452.2]Page 29 of 42 the two most likely motifs for NBOs that are bonded to Mg2+ cations are OPMgM and OPMgM
2 (where M=Na, Ca or Sr). This conclusion is confirmed by the crystal structure of SrMgP2O7 [94], in which each Mg-O bond involves an NBO with one of these two motifs. Secondly, we note that Sr2+ is the largest modifier cation in these glasses, and hence Sr-O bonds have less valence and are weaker than any of the other M-O bonds. The effect of substituting Sr for Ca in a OPMgM motif will thus be to increase the valence of the Mg-NBO bond, and hence to shorten this bond. This is why the distribution of Mg-O bond lengths extends to shorter distance when Sr substitutes for Ca. On the other hand, the longer Mg-O bonds occur for oxygens with an OPMgM2 motif, and the Sr/Ca substitution has a different effect on these motifs: The electrostatic bond strength of M-O bonds for M=Ca is ~0.4 (based on a Ca-O coordination number of five – see Table 6), so that the bond strength sum is considerably in excess of two for an oxygen with an OPMgCa2 motif. This means that OPMgCa2 motifs are not very likely to occur. However, if Sr substitutes for Ca, then the bond strength sum for the OPMgM2 motif is decreased closer to two, and hence the motif is more likely to occur. Thus the substitution of Sr for Ca leads to a growth in the number of OPMgM2 motifs, and this is why the substitution leads to a growth in the long distance part of the distribution of Mg-O bond lengths. The two types of NBO motif giving rise to the short Mg-O bonds and the long Mg-O bonds, as in crystalline SrMgP2O7 [94], are illustrated in Fig. 13. The growth in the coordination number nMgO suggests that the growth in OPMgM2 motifs is the dominant effect on Ca/Sr substitution.
Table 7: The Mg-O (and O…O) parameters from fitting the correlation functions, Δ𝑇(𝑟), of the multicomponent Sr-series glasses, after subtraction of the P-O, Na-O, Ca-O and Sr-O peaks; see the text for details. The valence calculated from the parameters for Mg-O bonds is also given.
Sample Atom pair 𝒍 − 𝒍′ Interatomic distance (𝒓𝒍𝒍′/Å)
Variation in interatomic distance (〈𝒖𝒍𝒍𝟐′〉½/Å)
Coordination number (𝒏𝒍𝒍′)
Mg-O valence (e)
P40 Mg-O 2.0325 (5) 0.0083 (6) 4.73 (2) 1.89
O…O 2.5063 (2) 0.0833 (2) 4.13 (1)
Sr4 Mg-O 2.0344 (6) 0.0891 (7) 4.62(3) 1.84
O…O 2.5082 (2) 0.0813 (2) 4.10 (1)
Sr8 Mg-O 2.0353 (6) 0.0926 (7) 4.94 (3) 1.96
O…O 2.5073 (2) 0.0816 (2) 4.03 (1)
Sr12 Mg-O 2.0358 (6) 0.0940 (7) 4.92 (3) 1.95
O…O 2.5080 (2) 0.0815 (2) 4.04 (1)
Sr16 Mg-O 2.0365 (7) 0.1021 (7) 5.20 (3) 2.05
[image:29.595.73.530.441.669.2]Page 31 of 42 eye. a) The RMS variation in distance (
u
2MgO ½ andu
2OO ½, a measure of the peak width), b) the coordination number (nMgO and nO…O), and c) the mean interatomic distance (rMgO and rO…O).4.5. Dissolution and ion release
The pH values shown in Fig. 8 remain around 7 for all compositions. This is expected for glass compositions that are classed as invert, and has been seen previously where a neutral pH was maintained during dissolution as opposed to acidic pH values seen with metaphosphate compositions [95,96]. The stable, neutral pH observed throughout this dissolution study suggests that the dissolution mechanism was again controlled predominantly by the modifier ion–phosphate chain interaction and network connectivity, rather than the surrounding solution.
Page 32 of 42 Fig. 15 The total atom number density, and the partial atom number densities for oxygen, phosphorus and strontium in the multicomponent glasses.
Some authors advocate the consideration of oxygen density as being useful for an understanding of the dissolution properties of glasses [53,98], and therefore we show the total atom number density, 𝑔tot, and the partial atom number density [99], 𝑔𝑙 = 𝑐𝑙𝑔tot, for O, P and Sr in Fig. 15. The number densities of O and P fall steadily by ~2% as Sr substitutes for Ca (the same as the factor by which the molar volume grows). The behaviour of the oxygen number density, gO, does not correlate with the dissolution behaviour shown in Fig. 9. i.e. gO shows a steady slight fall, whereas the mass loss is higher for the samples P40 and Sr16, but lower for the intermediate samples. Therefore we conclude that the oxygen density does not provide any direct explanation for the observed dissolution behaviour.
[image:32.595.85.339.77.496.2]Page 33 of 42 interaction of cations with the phosphate groups [27,35,96,100]. The total Ca-O and Sr-O coordination numbers reported in Table 6 are both close to five. However, there is a major difference between these two results, in that the Ca-O value includes a significant contribution from a long distance tail in the distribution, whereas the long distance tail has not been taken into account for the Sr-O value, because it is at too long a distance to be readily accessible. Thus it is most likely that the total Sr-O coordination number is significantly in excess of five. This suggests in turn that the decrease in dissolution rate for Sr-containing glasses could be attributed to the increase in coordination number leading to a more highly cross-linked structure, with increased resistance to hydrolysis. Alternatively, it is notable that the dissolution rate shown in Fig. 9 is higher for the two samples (P40 and Sr16) that contain four oxide components, whereas the samples with five components have a dissolution rate that is lower and is constant; this observation suggests that the greater structural frustration arising from the larger number of glass components leads to a smaller dissolution rate. It is also of note that the Sr16 sample is more prone to crystallisation than the other multicomponent samples (note the low values of Tonset and Tc in Table 2), suggesting that the greater frustration of the 5-component samples gives them a greater resistance to crystallisation.
Alternatively, the way in which the dissolution rate (Fig. 9) is lower for the mixed Sr/Ca compositions compared to the rate for the single cation glasses (P40 and Sr16) suggests a mixed mobile ion (MMI) effect [101]. The temperatures Tc and Tonset also show a behaviour of this type, with higher values for the mixed Sr/Ca glasses, and lower values for the single cation glasses. Furthermore the Na+ and Mg2+ cation release rates (Fig. 10) show this MMI effect type of behaviour. According to this viewpoint, the dissolution rate for mixed Sr/Ca glasses is lower than for single cation glasses because Sr hinders motion of Ca and vice versa, similar to the way in which mixed alkali glasses have lower conductivities than single alkali glasses [102,103].
Furthermore, the compositions studied here had high concentrations of MgO present where Mg2+ has an even higher field strength (0.53 valence/Å2 when 4-coordinated or 0.46 valence/Å2 when 6-coordinated) than Ca2+ and Sr2+ due to the increasing atomic number of the alkaline earth metals [62]. This in turn would increase packing density and so decrease dissolution and hence ion release rates. According to Dietzel’s rule [60,61], MgO is also known to behave as an intermediate, acting as either a network modifier or enter the phosphate network forming P-O-Mg bonds. From the 31P NMR results in this study, it was clear the MgO behaved as a glass modifier. Furthermore, the minimal change observed in the dissolution rates between the SrO containing glasses may be attributed to the dominating role MgO can play within the network because the MgO concentration (24mol%) remained constant for each composition. The significant decrease in dissolution rate of SrO containing glasses compared to the Sr free glass (P40) could be attributed to the increased packing density and crosslinking caused with the addition of an extra cation.
Page 34 of 42 in the amount of strontium and reduction in calcium ions released. These release profiles of Sr2+ coupled with the dissolution rate profiles provided evidence that it was possible to control the concentration of strontium ions released without affecting the rate of dissolution.
The ability to retain both structural and physico-chemical properties of the glasses in this study suggest the possibility of fine tuning the release of therapeutic ions such as Sr. Treatment of osteoporosis has involved oral administration of strontium ranelate at doses of 2g per day [25]. This study has shown that dissolution rates of Sr-containing glasses could be maintained and that a linear rate of change of Sr release has been achieved with varying concentration. This study shows it is possible to preserve the optimised properties of the glass formulation whilst having a predictable release rate of Sr.
5.
Conclusions
A comprehensive study of the structure and properties of 40P2O5·(16-x)CaO·20Na2O·24MgO·xSrO glass (x = 0, 4, 8, 12 and 16 mol%) has been described. The substitution of Sr for Ca leads to a slight overall fall in glass transition temperature Tg, and a significant fall in melting temperature, Tm, because Sr-O bonds are weaker than Ca-O bonds, and this effect is more significant than any change in cross-linking of the network. The broadening of the crystallisation peak and the appearance of a second melting event as the SrO content increases are evidence for the formation of more than one crystalline phase. Changes in the crystallisation behaviour are the main factor affecting the width of the thermal processing window for these glasses. FTIR and NMR spectra (31P and 23Na) show no evidence for changes in the phosphate part of the network as Sr substitutes for Ca, and this is confirmed by neutron diffraction results. The 31P NMR spectra show that the multicomponent glasses have equal numbers of PO4 tetrahedra occurring as Q2 and Q1 species, as is expected if all the modifier cations (Mg, Ca, Sr, Na) play the role of network modifiers, not network formers.
Neutron diffraction performed on binary metaphosphate glasses showed that in these glasses the M-O coordinations (M=Mg, Ca, Sr, Na) have a broad asymmetric distribution of bond length, with coordination numbers that are smaller and bond lengths that are shorter than in corresponding crystals. The most reliably determined coordination number is nMgO=5.0(2). The Ca-O and Sr-O coordination numbers were determined as 5.01(9) and 5.10(6), but it is most likely that the Sr-O distribution includes an additional contribution at longer distance, beyond the range that we were able to probe. The neutron correlation functions for the multicomponent glasses are consistent with a structural model in which the coordination of Ca, Sr and Na is the same as in the binary metaphosphate glass. On the other hand, the Mg-O bonds in the multicomponent glasses are shifted to longer distance than for the binary metaphosphate glass. Furthermore, there is a small but consistent increase in the Mg-O coordination number and the width of the distribution of Mg-O bond lengths, as Sr substitutes for Ca.
Page 35 of 42
Acknowledgements
The authors would like to acknowledge that the Solid-state NMR spectra were obtained at
the EPSRC UK National Solid-state NMR Service at Durham.
The authors would also like to
acknowledge funding received from the Science and Technology Facilities Council (STFC ref.
no. ST/L502583/1).
References
[1] I. Ahmed, M. Lewis, I. Olsen, J.C. Knowles, Phosphate glasses for tissue engineering: Part 1. Processing and characterisation of a ternary-based P2O5-CaO-Na2O glass system, Biomaterials 25 (2004) 491-499.
[2] I. Ahmed, M. Lewis, I. Olsen, J.C. Knowles, Phosphate glasses for tissue engineering: Part 2. Processing and characterisation of a ternary-based P2O5-CaO-Na2O glass fibre system, Biomaterials 25 (2004) 501-507.
[3] I. Ahmed, M.P. Lewis, S.N. Nazhat, J.C. Knowles, Quantification of anion and cation release from a range of ternary phosphate-based glasses with fixed 45 mol% P2O5, J. Biomater. Appl. 20 (2005) 65-80.
[4] M.S. Hasan, I. Ahmed, A.J. Parsons, G.S. Walker, C.A. Scotchford, Material characterisation and cytocompatibility assessment of quinternary phosphate glasses, J. Mater. Sci. Mater. Med. 23 (2012) 2531-2541.
[5] N. Sharmin, M.S. Hasan, A.J. Parsons, D. Furniss, C.A. Scotchford, I. Ahmed, C.D. Rudd, Effect of Boron Addition on the Thermal, Degradation, and Cytocompatibility Properties of Phosphate-Based Glasses, BioMed Res. Int. (2013) 902427.
[6] X. Liu, M.N. Rahaman, D.E. Day, In vitro degradation and conversion of melt-derived microfibrous borate (13-93B3) bioactive glass doped with metal ions, J. Am. Ceram. Soc. 97 (2014) 3501-3509.
[7] M. Bitar, V. Salih, V. Mudera, J.C. Knowles, M.P. Lewis, Soluble phosphate glasses: in vitro studies using human cells of hard and soft tissue origin, Biomaterials 25 (2004) 2283-2292. [8] V. Mouriño, J.P. Cattalini, A.R. Boccaccini, Metallic ions as therapeutic agents in tissue
engineering scaffolds: an overview of their biological applications and strategies for new developments, J. R. Soc. Interface 9 (2012) 401-419.
[9] A. Hoppe, V. Mourino, A.R. Boccaccini, Therapeutic inorganic ions in bioactive glasses to enhance bone formation and beyond, Biomater. Sci. 1 (2013) 254-256.
[10] I. Ahmed, A. Parsons, A. Jones, G. Walker, C. Scotchford, C. Rudd, Cytocompatibility and effect of increasing MgO content in a range of quaternary invert phosphate-based glasses, J. Biomater. Appl. 24 (2010) 555-575.
Page 36 of 42 [12] E.A. Abou Neel, I. Ahmed, J.J. Blaker, A. Bismarck, A.R. Boccaccini, M.P. Lewis, S.N. Nazhat, J.C. Knowles, Effect of iron on the surface, degradation and ion release properties of phosphate-based glass fibres, Acta Biomater. 1 (2005) 553-563.
[13] J.R. Jones, A.G. Clare, eds. Bio-Glasses: An Introduction. 2012, Wiley: Chichester.
[14] P.J. Marie, P. Ammann, G. Boivin, C. Rey, Mechanisms of action and therapeuticpotential of strontium in bone, Calcif. Tissue Int. 69 (2001) 121-129.
[15] E. Bonnelye, A. Chabadel, F. Saltel, P. Jurdic, Dual effect of strontium ranelate: Stimulation of osteoblast differentiation and inhibition of osteoclast formation and resorption in vitro, Bone 42 (2008) 129-138.
[16] S.G. Dahl, P. Allain, P.J. Marie, Y. Mauras, G. Boivin, P. Ammann, Y. Tsouderos, P.D. Delmas, C. Christiansen, Incorporation and distribution of strontium in bone, Bone 28 (2001) 446-453.
[17] Y.C. Fredholm, N. Karpukhina, D.S. Brauer, J.R. Jones, R.V. Law, R.G. Hill, Influence of strontium for calcium substitution in bioactive glasses on degradation, ion release and apatite formation, J. R. Soc. Interface 9 (2012) 880-889.
[18] M.D. O'Donnell, P.L. Candarlioglu, C.A. Miller, E. Gentleman, M.M. Stevens, Materials characterisation and cytotoxic assessment of strontium-substituted bioactive glasses for bone regeneration, J. Mater. Chem. 20 (2010) 8934-8941.
[19] E.A. Abou Neel, W. Chrzanowski, D.M. Pickup, L.A. O'Dell, N.J. Mordan, R.J. Newport, M.E. Smith, J.C. Knowles, Structure and properties of strontium-doped phosphate-based glasses, J. R. Soc. Interface 6 (2009) 435-446.
[20] A. Gorustovich, T. Steimetz, R.L. Cabrini, J.M. Porto López, Osteoconductivity of strontium-doped bioactive glass particles, Bone 41 (2007) S4.
[21] E. Gentleman, Y.C. Fredholm, G. Jell, N. Lotfibakhshaiesh, M.D. O'Donnell, R.G. Hill, M.M. Stevens, The effects of strontium-substituted bioactive glasses on osteoblasts and osteoclasts in vitro, Biomaterials 31 (2010) 3949-3956.
[22] K. Fujikura, N. Karpukhina, T. Kasuga, D.S. Brauer, R.G. Hill, R.V. Law, Influence of strontium substitution on structure and crystallisation of Bioglass 45S5, J. Mater. Chem. 22 (2012) 7395-7402.
[23] R.A. Martin, H.L. Twyman, G.J. Rees, E.R. Barney, R.M. Moss, J.M. Smith, R.G. Hill, G. Cibin, T. Charpentier, M.E. Smith, J.V. Hanna, R.J. Newport, An examination of the calcium and strontium site distribution in bioactive glasses through isomorphic neutron diffraction, X-ray diffraction, EXAFS and multinuclear solid state NMR, J. Mater. Chem. 22 (2012) 22212-22223.
[24] Public Health Service Agency for Toxic Substances and Disease Registry, Toxicological profile for strontium, https://www.atsdr.cdc.gov/toxprofiles/tp159.pdf, (accessed 7/6/2017). [25] C.T. Price, J.R. Langford, F.A. Liporace, Essential nutrients for bone health and a review of
their availability in the average North American diet, Open Orthop. J. 6 (2012) 143-149. [26] W.E. Cabrera, I. Schrooten, M.E. De Broe, P.C. D'Haese, Strontium and bone, J. Bone Miner.
Res. 14 (1999) 661-668.
[27] J.K. Christie, R.I. Ainsworth, N.H. de Leeuw, Investigating structural features which control the dissolution of bioactive phosphate glasses: Beyond the network connectivity, J. Non-Cryst. Solids 432A (2016) 31-34.
[28] R.K. Brow, Review: The Structure of Simple Phosphate Glasses, J. Non-Cryst. Solids 263-264 (2000) 1-28.
[29] W.H. Zachariasen, The atomic arrangement in glass, J. Am. Chem. Soc. 54 (1932) 3841-3851. [30] I. Elgayar, A.E. Aliev, A.R. Boccaccini, R.G. Hill, Structural analysis of bioactive glasses, J.
Non-Cryst. Solids 351 (2005) 173-183.