University of Warwick institutional repository:
http://go.warwick.ac.uk/wrap
This paper is made available online in accordance with
publisher policies. Please scroll down to view the document
itself. Please refer to the repository record for this item and our
policy information available from the repository home page for
further information.
To see the final version of this paper please visit the publisher’s website.
access to the published version may require a subscription.
Author(s): M.R. Broomea, P. Matthiassona, P. Fusar-Polia, J.B.
Woolleya, L.C. Johnsa, P. Tabrahama, E. Bramona, L. Valmaggiaa,
S.C. Williamsa, M. Brammera, X. Chitnisa and P.K. McGuirea
Article Title: Neural correlates of executive function and working memory
in the ‘at risk mental state’
Year of publication: 2007
Link to published version:
People with prodromal symptoms of psychosis have a 25–40% risk of developing a psychotic disorder in the next 12 months1,2and thus have an ‘at-risk mental state’. Neuropsychological studies indicate people with an at-risk mental state show impairments in executive and memory functions with performance often intermediate between that in patients with schizophrenia and controls,3with working memory performance predicting the onset of psychosis.4 Structural magnetic resonance imaging (MRI) studies suggest that the at-risk mental state is associated with reduced grey-matter volume in regions that are also abnormal in schizophrenia,5 and a recent functional MRI study reported
differential prefrontal activation in individuals with an at-risk mental state relative to controls and patients with schizophrenia during a visual oddball paradigm.6Taken together, these findings suggest that individuals with an at-risk mental state display neurocognitive abnormalities that are qualitatively similar to, but less severe than, those seen in schizophrenia. We tested this hypothesis using functional MRI in conjunction with classical tasks of executive function and working memory.
Methods
Participants
At-risk mental state (at-risk) group (n=17)
Individuals meeting Personal Assessment and Crisis Evaluation7 (PACE) criteria for an at-risk mental state were recruited from Outreach and Support in South London (OASIS).8The diagnosis was based on assessment by two experienced clinicians using the comprehensive assessment for the at-risk mental state,2 and a consensus meeting with the clinical team. None of the participants had ever received antipsychotic medication. Briefly, an individual meets PACE criteria for an at-risk mental state if they display one or more of the following: ‘attenuated’ positive symptoms; frank
psychotic symptoms that last less than 1 week and resolve without treatment; a recent decline in function coupled with either schizo-typal personality disorder or a first-degree relative with psychosis. The individuals recruited were representative of the local population of people presenting with an at-risk mental state in terms of age, gender, ethnicity, and duration and intensity of symptoms.8
First-episode (psychosis) group (n=10)
Participants were patients who had presented with a first episode of psychosis to Lambeth Early Onset Services. All met ICD–109 criteria for a schizophreniform psychosis at the time of scanning and subsequently met Operational Criteria Checklist (OPCRIT)10 criteria for schizophrenia when reassessed 12 months after first presentation. Three patients were medication naı¨ve. Seven had been treated with either oral risperidone or quetiapine for a mean of 10 days (95% CI 4.7–16.3) at mean doses of 1.7 mg and 63.75 mg respectively. Patients were scanned as soon after presentation as was practicable, and all but one of the patients scanned within 2 weeks of presentation.
Control group (n=15)
Healthy volunteers were recruited via advertisements in the local media.
All individuals lived in the same borough of London as the clinical participants (Lambeth), were native speakers of English and were right-handed.
Individuals were excluded if there was a history of neuro-logical disorder or they met DSM–IV11 criteria for a substance misuse disorder. General intellectual function was estimated in all participants using the National Adult Reading Test.12 The severity of symptoms in the clinical groups was assessed with the Positive and Negative Syndrome Scale (PANSS)13on the day
Neural correlates of executive function and
working memory in the ‘at-risk mental state’
Matthew R. Broome, Pall Matthiasson, Paolo Fusar-Poli, James B. Woolley, Louise C. Johns, Paul Tabraham, Elvira Bramon, Lucia Valmaggia, Steven C. R. Williams, Michael J. Brammer, Xavier Chitnis and Philip K. McGuire
Background
People with prodromal symptoms have a very high risk of developing psychosis.
Aims
To use functional magnetic resonance imaging to examine the neurocognitive basis of this vulnerability.
Method
Cross-sectional comparison of regional activation in individuals with an ’at-risk mental state’ (at-risk group:n=17), patients with first-episode schizophreniform psychosis (psychosis group: n=10) and healthy volunteers (controls: n=15) during an overt verbal fluency task and an N-Back working memory task.
Results
A similar pattern of between-group differences in activation
was evident across both tasks. Activation in the at-risk group was intermediate relative to that in controls and the psychosis group in the inferior frontal and anterior cingulate cortex during verbal fluency, and in the inferior frontal, dorsolateral prefrontal and parietal cortex during the N-Back task.
Conclusions
The at-risk mental state is associated with abnormalities of regional brain function that are qualitatively similar, but less severe, to those in patients who have recently presented with psychosis.
Declaration of interest
None. Funding detailed in Acknowledgements.
Author: Is this correct definition? (Column 2) (AQ2)
Author: Is this correct defi-nition? (Column 1) (AQ1)
Author: Added reference for this and renumbered references from this point onwards. Please check (Column 2) (AQ3)
of scanning. Additionally, individuals were excluded from the analysis after data collection if they were unable to perform the cognitive tasks during image acquisition as detailed below. For the at-risk group, 19 participants underwent functional MRI, with 2 being excluded due to not performing the task resulting inn=17; for the psychosis group, 1 participant was excluded and similarly for the control group leaving data being reported forn=10 and
n=15 respectively.
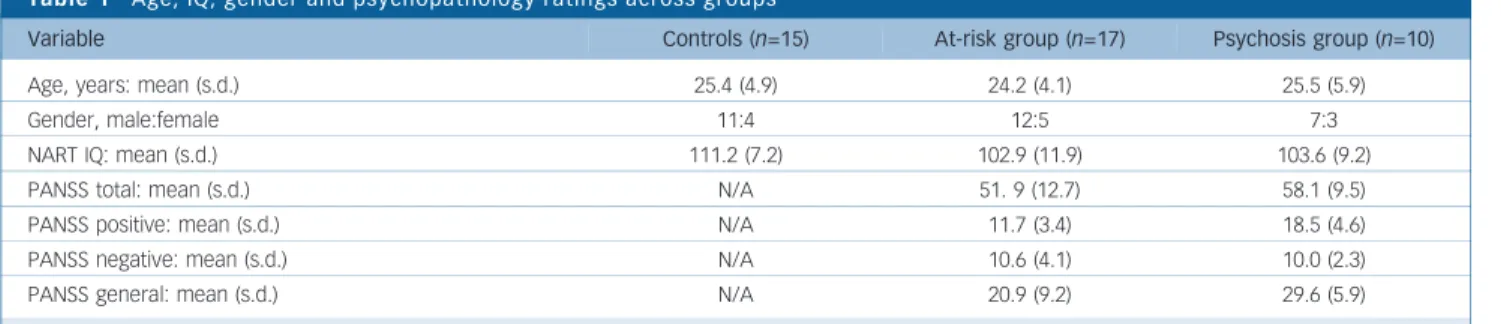
There were no significant group differences in socio-demographic variables or IQ. Both positive and general PANSS scores were higher in the psychosis group than in the at-risk group, but these differences were not significant (Table 1).
Image acquisition
Images were acquired on a 1.5 Tesla Signa (GE) system at the Maudsley Hospital, London. T2*-weighted images were acquired
with a repetition time (TR) of 2 s, 38 x 3 mm slices, with a 0.3 mm gap in 14 axial planes. During verbal fluency a gradient-echo sequence (TR=4000 ms, gradient-echo time (TE)=40 ms) was used with the acquisition of each volume compressed into the first 1250 ms of the repetition time, creating a 2750 ms window in which participants could articulate a response in the absence of scanner noise.14The other tasks (which did not involve speech) were studied using TR=2000 ms and TE=40 ms. To facilitate anatomical localisation of activation, a high resolution inversion recovery image data-set was also acquired, with 3 mm contiguous slices and an in plane resolution of 3 mm (TR=1600 ms, inversion time (TI)=180 ms, TE=80 ms).
Cognitive tasks
N-Back
In all conditions participants were presented with a series of letters which they viewed using a prismatic mirror. The interstimulus interval was 2 s. During the baseline (0-Back) condition, individ-uals were required to move a joystick to the left when the letter ‘X’ appeared. During the 1-Back and 2-Back conditions, participants were required to press a button on the joystick with their right index finger if the currently presented letter was the same as that presented one or two trials beforehand respectively. The three conditions were presented in 10 alternating 30-s blocks matched for the number of target letters per block (i.e. two or three), in pseudorandom order. Reaction time and the accuracy of the responses were recorded online.
Overt verbal fluency
Participants were required to overtly articulate a word beginning with a visually presented letter. The stimuli, each subtending an angle of 5, were presented visually on a black screen, viewed through a mirror. Cognitive load was modulated with two levels
of task difficulty, ‘easy’ and ‘hard’ conditions, which involved letters that differed with respect to the ease with which volunteers can usually generate words beginning with them. The ‘easy’ condition involved the letters L, T, C, P, S; the ‘hard’ condition: O, N, E, F, G.14Incorrect responses were defined as words that were proper names, repetitions or grammatical variations of the previous word, and ‘pass’ responses. Letters were presented in 28-s blocks of seven stimuli at 4-s intervals. The control condition of word repetition comprised 28 s blocks of 7 presentations of the word ‘rest’ at 4 s intervals, which participants were required to read aloud. Five blocks of each condition (hard/easy/repetition) were presented in random order.
Verbal responses were recorded via an MRI compatible micro-phone on Cool Edit 2000. To ensure that participants heard their responses clearly, their speech was transmitted by an MRI com-patible microphone, amplified by a computer sound card and relayed back through an acoustic MRI sound system (Ward Ray, Hampton Court, UK), and noise insulated, stereo headphones at a volume of 91 plus or minus 2 dB.
Image processing and analysis
The data were realigned15then smoothed using a Gaussian filter (full width half maximum 7.2 mm). Responses to the experimental paradigms were detected by convolving each component of the design with each of two gamma variate functions (peak responses at 4 and 8 s respectively). The best fit between the weighted sum of these convolutions and the time series at each voxel was computed using the constrained blood oxygen level dependent (BOLD) effect model.16A goodness of fit statistic comprising the ratio of the sum of squares of deviations from the mean image intensity (over the whole time series) divided by the sum of squares of deviations due to the residuals (SSQratio) was then computed at each voxel.
The data were then permuted by a wavelet-based method17to calculate the null distribution of SSQratios under the assumption of no experimentally determined response. This was used to calculate the critical value of SSQratio needed to threshold the maps at a type I error rate of51. The detection of activated voxels was then extended from voxel to cluster level.18 To minimise
the potential confounding effects of between-group and
between-condition variation in task performance, in the analysis of data from the verbal fluency and N-Back tasks the BOLD response in each person was modelled using only trials associated with correct responses.
In addition to the SSQratio, the size of the BOLD response to each experimental condition was computed for each individual at each voxel as a percentage of the mean resting image intensity level. In order to calculate the BOLD effect size, the difference between the maximum and minimum values of the fitted model for each condition was expressed as a percentage of the mean image intensity level over the whole time series.
Broome et al
AUTHOR’S PROOF
Table 1 Age, IQ, gender and psychopathology ratings across groups
Variable Controls (n=15) At-risk group (n=17) Psychosis group (n=10)
Age, years: mean (s.d.) 25.4 (4.9) 24.2 (4.1) 25.5 (5.9)
Gender, male:female 11:4 12:5 7:3
NART IQ: mean (s.d.) 111.2 (7.2) 102.9 (11.9) 103.6 (9.2)
PANSS total: mean (s.d.) N/A 51. 9 (12.7) 58.1 (9.5)
PANSS positive: mean (s.d.) N/A 11.7 (3.4) 18.5 (4.6)
PANSS negative: mean (s.d.) N/A 10.6 (4.1) 10.0 (2.3)
PANSS general: mean (s.d.) N/A 20.9 (9.2) 29.6 (5.9)
NART, National Adult Reading Test; PANSS, Positive and Negative Syndrome Scale.
The SSQratio maps for each individual were transformed into the standard space of Talairach and Tournoux19using a two-stage warping procedure.20Group activation maps were computed by
determining the median SSQratio at each voxel (across all individ-uals) in the observed and permuted data maps. The distribution of median SSQratios from the permuted data was used to derive the null distribution of SSQratios and the critical SSQ ration to threshold group activation maps at a cluster level threshold of 51 expected type I error cluster per brain.
Comparisons of responses between groups or experimental conditions was performed by fitting the data at each intraceberal voxel at which all participants had non-zero data using a linear model of the type:
Y¼aþbXþe
WhereYis the vector of BOLD effect sizes for each individual,
Xis the contrast matrix for the particular intercondition/group contrasts required,a is the mean effect across all individuals in the various conditions/groups,bis the computed group/condition difference andeis a vector of residual errors. The model was fitted by minimising the sum of absolute deviations rather than the sums of squares to reduce outlier effects. The null distribution of b was computed by permuting data between conditions/groups (assuming the null hypothesis of no effect of experimental condi-tion or group membership) and refitting the above model.
In order to examine the data for a linear trend in activation across groups (controls, at-risk and psychosis) we carried out an orthogonal polynomial trend analysis in which the linear trend was coded as71, 0, 1 (controls, at-risk and psychosis) and the orthogonal polynomial trend as 71, 2 and71. Our hypothesis was that the linear trend would be significant but the quadratic trend would not be (i.e. there would be a linear trend but no sig-nificant departure from linearity). This would indicate that the
or-der of responses would be controls4at-risk4psychosis
or psychosis4at-risk4controls. This analysis was carried out using the effect size (beta) maps (which represented percentage changes in BOLD response) for each individual in each group after these had been transformed into in standard space.
Voxel and cluster level maps of voxels and clusters showing significant linear and quadratic effects were computed using permutation testing as described above. The threshold for cluster level analysis was chosen to give51 false activated cluster per brain.
The method of analysis we employed (XBAM) uses median statistics to control outlier effects and permutation rather than normal theory-based inference. The main test statistic is computed by standardising for individual differences in residual noise before embarking on second level, multiperson testing using robust permutation-based methods. Approaches using a mixed effects analysis, and permutation-based and cluster level inference appear to be more valid than analyses involving simple random effects and voxel level inference.21
Results
Task performance
There were no significant group differences in mean reaction time (P=0.44), and no differences in the number of errors during the 1-and 2-Back conditions (P=0.49).
There were no significant group differences in mean reaction time (P=0.81). There was a group difference in the proportion of movements made to the right (F=4.05, d.f. w2=2, P=0.028):
controls made more such movements than the at-risk group, with the psychosis group intermediate between them.
There were no group differences in the number of errors produced during either the ‘easy’ (P=0.45) or ‘hard’ versions of the task (0.82).
Regional activation
Within-group activation (voxelP50.05, clusterP50.01)
1-Back. In the control group, there was activation in the left inferior frontal gyrus and the posterior parietal cortex bilaterally. In the at-risk group, activation was evident in the inferior and middle frontal gyri bilaterally, the left inferior parietal and right inferior temporal cortex, and the left fusiform gyrus. The psychosis group displayed activation in the middle and superior frontal gyri bilaterally, the right inferior frontal gyrus, the left insula, the medial parietal cortex bilaterally, the right middle temporal gyrus and thalamus.
2-Back. In the control group there was activation in the left precentral and medial frontal gyrus, the right inferior frontal gryus, and the left posterior and right medial parietal cortex. In the at-risk group, activation was evident in the right inferior frontal and the left middle frontal gyrus, and in the right posterior cortex and left precuneus. The psychosis group displayed activation in the inferior and middle frontal gyri bilaterally, the middle temporal gyrus bilaterally, and in the left thalamus and caudate
Between-group differences in activation (voxelP50.05, clusterP50.01)
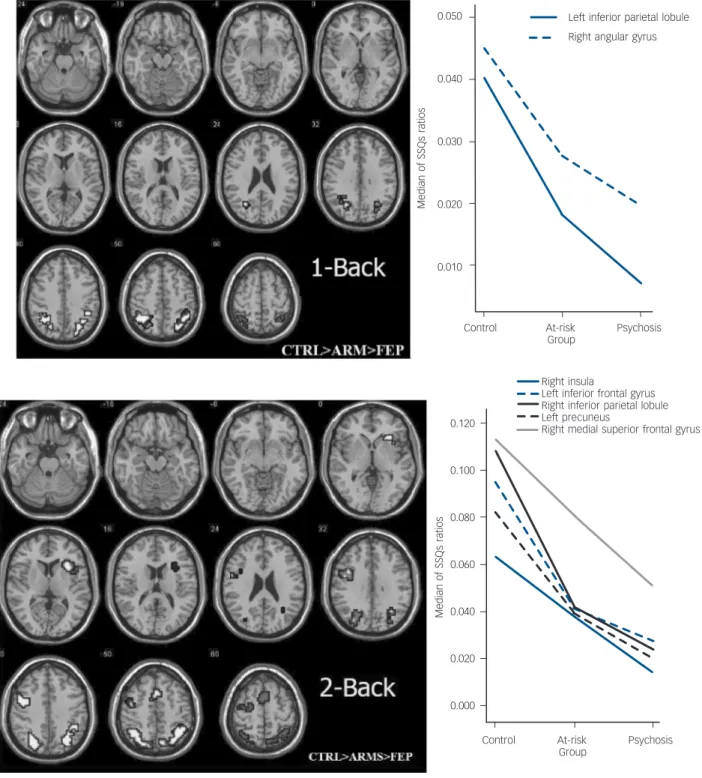
1-Back. There was differential activation across the three groups in the left inferior parietal lobule and the right angular gyrus. In both these areas the at-risk group showed less activation than con-trols but more activation than the psychosis group (post hoc t -tests,P50.05) (Fig. 1 and Table 2).
2-Back. Differential activation across the three groups was evident in the right insula and left inferior frontal gyrus, the right inferior parietal lobule, the left precuneus and right medial/ superior frontal gyrus. In each of these areas the at-risk group showed less activation than controls but more activation than the psychosis group (post hoc t-tests,P50.05) (Fig. 1 and Table 3).
Verbal fluency
Within-group activation (voxelP50.05, clusterP50.01).
‘Easy’ condition. Controls showed activation in the left inferior and superior frontal gyri, the at-risk group activated the left infer-ior frontal and left fusiform gyri, right insula, and left superinfer-ior frontal gyrus, and the psychosis group activated the left precentral gyrus, right insula, and the left inferior parietal and fusiform cor-tex.
‘Hard’ condition. Controls displayed activation in the left inferior frontal gyrus and inferior parietal lobule, and the right posterior cerebellar cortex. The at-risk group activated the left inferior frontal gyrus, the left superior frontal gyrus, while the psychosis group activated the left precentral gyrus and insula, and the right inferior frontal gyrus, insula and anterior cingulate gyrus.
Broome et al
Between-group differences in activation (voxelP50.05, cluster
P50.01)
‘Easy’ condition. There was differential activation across the three groups in a region which included both the opercular and dorsal parts of the left inferior frontal gyrus (Fig. 2 and Table 4). The at-risk group showed less activation in this region than controls but more activation than the psychosis group (post hoc t-tests,P50.05).
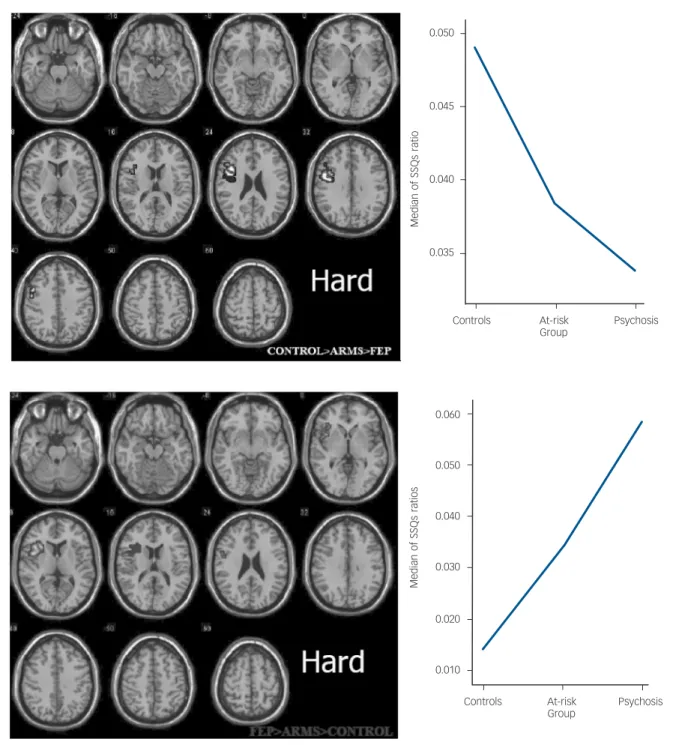
‘Hard’ condition. Differential activation across the three groups was evident in a region which extended superiorly from the dorsal part of inferior frontal gyrus to adjacent middle frontal and precentral gyri (Fig. 3 and Table 5). In this region, the at-risk group showed less activation than the controls but greater activation than the psychosis group (post hoc t-tests,P50.05).
The reverse pattern of differential activation was evident in a more ventral region focused on the left anterior insula. In this region activation was again intermediate in the at-risk group,
AUTHOR’S PROOF
0.050
0.040
0.030
0.020
0.010
Control At-risk Psychosis Group
Left inferior parietal lobule
Right angular gyrus
0.120
0.100
0.080
0.060
0.040
0.020
0.000
Control At-risk Psychosis Group
Right insula
Left inferior frontal gyrus Right inferior parietal lobule Left precuneus
Right medial superior frontal gyrus
Median
of
SSQs
ratios
Median
of
SSQs
ratios
but was greatest in the psychosis group and weakest in the controls (Fig. 3 and Table 6).Post hocpairwise comparisons confirmed that in this region the at-risk group showed greater activation than controls with a trend for less activation than the psychosis group (t-tests,P50.05).
Effects of medication
Within the psychosis group (the only group which included participants who had received antipsychotic medication), there was no significant correlation (voxel P50.05, cluster P50.01) between activation in the regions that were differentially engaged across groups during each task and either the daily or cumulative dose (in chlorpromazine equivalents) of antipsychotic treatment, or the duration of antipsychotic treatment.
Discussion
The present study used functional MRI to study the neural substrate of executive functions and working memory in indiv-iduals with an at-risk mental state. The N-Back task engages verbal working memory and requires the suppression of responses to currently presented stimuli. Verbal fluency entails the intrinsic generation of a verbal response, suppression of inappropriate responses and the holding of information about previous responses online.
In line with our hypothesis, there was a consistent pattern of differential activation across the groups for both tasks: during the N-Back and verbal fluency paradigms, the level of regional activation in the at-risk group was intermediate between that in the psychosis group and controls. This is the first study to demonstrate statistically intermediate patterns of activation in an at-risk group, compared with controls and participants with psychosis. These differences were evident in brain regions that are normally activated during these paradigms in volunteers: the prefrontal and parietal cortex during the N-Back task, and the pre-frontal and anterior cingulate cortex during verbal fluency.22–28 The differential activation was not attributable to impairments in task performance, as there were no significant differences in the speed or accuracy of responses across groups, and the analysis selectively modelled the BOLD response to those trials associated with correct responses. The lack of difference in behavioural performance allows the interpretation of activations to proceed knowing that the psychological task is being carried to an equal level by all participants and hence, any remaining difference in activation is likely to be due to the disorder of interest, rather than a non-specific correlate of poor performance. The lack of behavioural difference is due both to excluding individuals who perform the task very badly from the analysis and by the study being powered to detect physiological changes, rather than neuropsychological differences, between the groups.
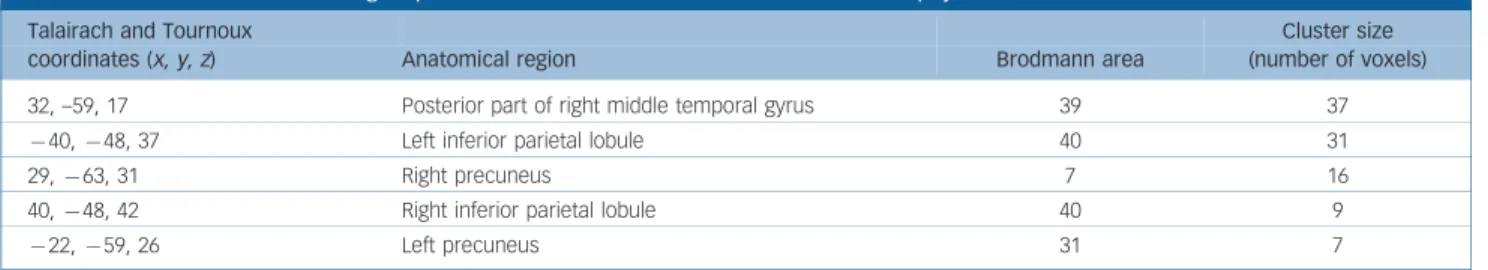
Table 2 1-Back task between-group differences in activation: controls4at-risk4psychosis
Talairach and Tournoux
coordinates (x, y, z) Anatomical region Brodmann area
Cluster size (number of voxels)
32, –59, 17 Posterior part of right middle temporal gyrus 39 37
740,748, 37 Left inferior parietal lobule 40 31
29,763, 31 Right precuneus 7 16
40,748, 42 Right inferior parietal lobule 40 9
722,759, 26 Left precuneus 31 7
0.055
0.050
0.045
0.040
0.035
Controls At-risk Psychosis Group
Median
of
SSQs
ratios
Broome et al
Similarly, the findings are unlikely to be related to effects of antipsychotic medication as both the at-risk group and controls were medication naı¨ve, and in the psychosis group there was no relationship between medication exposure and activation in the regions that were differentially engaged across groups. Further, when quadratic trend analysis was carried out, there were no significant clusters activated differentially across the groups: again, this indicates that there was a predominantly linear relationship in activation across the groups on all tasks.
The brain regions where we observed differential activation in the at-risk group correspond to those that have previously been reported as sites of abnormal activation in functional imaging studies of schizophrenia. Thus, patients with schiziophrenia show reduced activation in the prefrontal and parietal cortex during the N-Back task,24in the parietal cortex during random movement generation,29 and in the left prefrontal cortex during verbal fluency,30There has only been one previous functional imaging
study involving participants with an at-risk mental state. This reported differential prefrontal activation during a visual oddball paradigm in an at-risk group relative to controls and patients with schizophrenia.6
During the 1-Back condition of the N-Back task, the at-risk group showed attenuated activation in the parietal cortex relative to controls. These differences became more extensive during the
more demanding 2-Back condition, and were accompanied by additional reductions in prefrontal activation. Nevertheless, the magnitude of activation in the at-risk group remained inter-mediate to that in the control and psychosis groups when the task demands were increased. Similarly, although during ‘hard’ verbal fluency the pattern of activation differences in the insula was reversed (discussed further below), the magnitude of activation in the at-risk group remained intermediate relative to that in the other groups, as during the ‘easy’ version of the task, and did not more closely resemble that in the psychosis group.
During ‘hard’ verbal fluency, engagement of the left insula was greatest in the psychosis group, intermediate in the at-risk group and weakest in controls. In the dorsal part of the left inferior frontal gyrus the opposite applied, with greatest activation in controls and least in the psychosis group. Relatively greater engagement of the insula in the psychosis group in the context of increased demands on controlled word retrieval31and selection
among competing words32might reflect a compensatory response in the group in whom processing was most compromised and who showed the weakest engagement of the inferior frontal gyrus.
The overall pattern of the findings is consistent with data from neuropsychological studies of the at-risk mental state. These indicate that individuals who are at risk display impairments on tasks of executive functions and memory (including N-Back and
AUTHOR’S PROOF
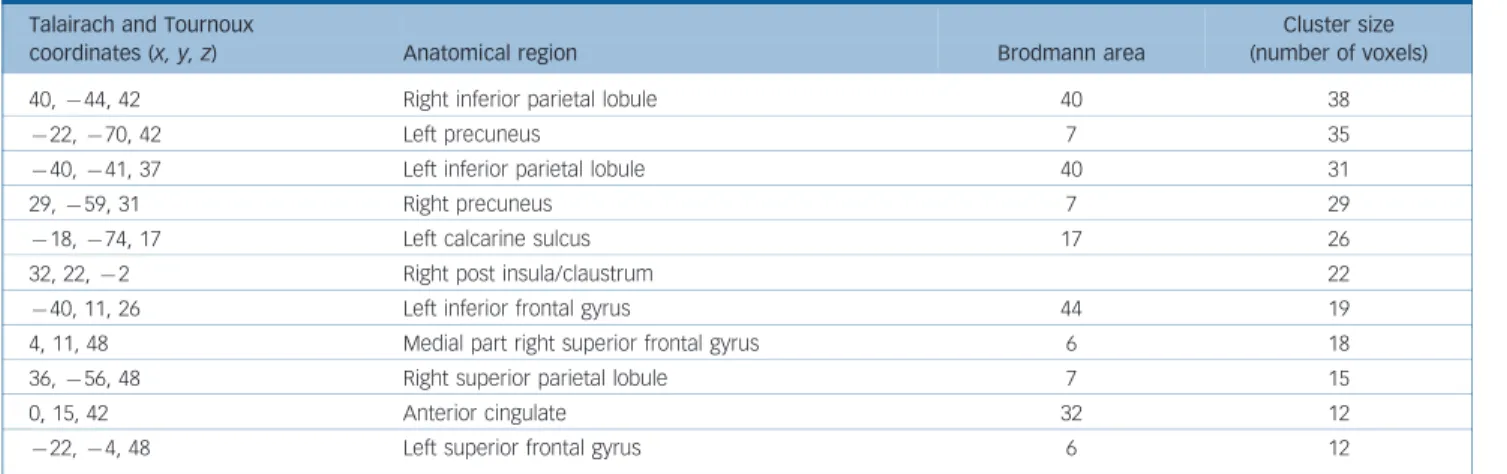
Table 3 2-Back task between-group differences in activation: controls4at-risk4psychosis
Talairach and Tournoux
coordinates (x, y, z) Anatomical region Brodmann area
Cluster size (number of voxels)
40,744, 42 Right inferior parietal lobule 40 38
722,770, 42 Left precuneus 7 35
740,741, 37 Left inferior parietal lobule 40 31
29,759, 31 Right precuneus 7 29
718,774, 17 Left calcarine sulcus 17 26
32, 22,72 Right post insula/claustrum 22
740, 11, 26 Left inferior frontal gyrus 44 19
4, 11, 48 Medial part right superior frontal gyrus 6 18
36,756, 48 Right superior parietal lobule 7 15
0, 15, 42 Anterior cingulate 32 12
722,74, 48 Left superior frontal gyrus 6 12
Table 4 Controls5at-risk5psychosis: ‘easy’ verbal fluency between-group differences in activation
Talairach and Tournoux
coordinates (x, y, z) Anatomical region Brodmann area
Cluster size (number of voxels)
736, 30, 15 Left inferior frontal gyrus.(anterior portion) 45 36
740, 7, 20 Left inferior frontal gyrus (dorsal portion) 44 34
747, 11, 9 Left inferior frontal gyrus (frontal operculum) 44 26
Table 5 Controls4at-risk4psychosis: ‘hard’ verbal fluency between-group differences in activation
Talairach and Tournoux
coordinates (x, y, z) Anatomical region Brodmann area
Cluster size (number of voxels)
743, 11, 15 Left inferior Frontal gyrus (frontal operculum). 44 18
Table 6 Psychosis4at-risk4controls: ‘hard’ verbal fluency between-group differences in activation
Talairach and Tournoux
coordinates (x, y, z) Anatomical region Brodmann area
Cluster size (number of voxels)
verbal fluency) that are qualitatively similar, but less severe, than those evident in patients with schizophrenia.33–37 Similarly, structural MRI studies suggest that the at-risk mental state is associated with reductions in grey-matter volume in similar regions that show volume reductions in schizophrenia, including the inferior frontal, cingulate and temporal cortex.5(Borgwardts
et al, 2007).
As the at-risk group had a high risk of developing a psychotic disorder but did not have psychosis, the functional abnormalities they displayed can be seen as a correlate of their increased vulnerability to psychosis. It is unlikely that the findings reflected the erroneous inclusion of individuals who already had psychosis,
or who were already progressing towards schizophrenia, as inclusion required detailed assessment by at least two clinicians experienced in the management of the at-risk mental state. In addition, participants were closely monitored for signs of frank psychosis subsequent to scanning.
Limitations of the study
This study reports cross-sectional data on individuals at-risk, with psychosis and controls. As noted above, the findings in the at-risk group may be a correlate of their increased vulnerability to psychosis. However, to determine this formally will require a
0.050
0.045
0.040
0.035
Controls At-risk Psychosis Group
Median
of
SSQs
ratio
0.060
0.050
0.040
0.030
0.020
0.010
Controls At-risk Psychosis Group
Median
of
SSQs
ratios
Fig. 3 Group differences in cluster activation during ‘hard’ verbal fluency. When the task demands were high, there was differential engagement of dorsolateral prefrontal cortex activation was greatest in the control group, weakest in the psychosis group, and
intermediate in the at-risk group. However, on the same version of the task, there was differential engagement of the left anterior insula. When task demands were high activation in this region was greatest in the psychosis group, weakest in the controls and intermediate in the at-risk group. The left side of the brain is shown on the left of the figure (voxelP50.05, clusterP50.01). SSQRs, sum of squares of deviations due to the residuals.
Broome et al
longitudinal study: a study informed by the findings presented here and in particular whether the pattern and degree of activation during executive and working memory tasks predict transition to psychosis in a clinical high-risk group.
Conclusions
The at-risk mental state is associated with abnormalities of regional brain function that are qualitatively similar but less severe than those seen in patients who have just developed schizo-phrenia. These may underlie the impairments in executive function and working memory that are evident in this group and can be seen as correlates of their increased vulnerability to psychosis.
Matthew R. Broome, BSc, MBChB, MRCPsych, Section of Neuroimaging, Division of Psychological Medicine, Institute of Psychiatry, King’s College London, and Health Sciences Research Institute, Warwick Medical School, University of Warwick, Coventry, UK;Pall Matthiasson, MD, MRCPsych, PhD, Section of Neuroimaging, Division of Psychological Medicine, Institute of Psychiatry, King’s College London; Paolo Fusar-Poli, MD, Section of Neuroimaging, Division of Psychological Medicine, Institute of Psychiatry, King’s College London, UK, and Department of Applied and Psychobehavioural Health Sciences, University of Pavia, Italy;James B. Woolley, BSc, MBBS, MRCP, MRCPsych,Louise C. Johns, DPhil, DClinPsy,Paul Tabraham, BSc, DClinPsy,Elvira Bramon, MD, PhD, Section of Neuroimaging, Division of Psychological Medicine, Institute of Psychiatry, King’s College London, UK; Lucia Valmaggia, PhD, DClinPsy, Section of Neuroimaging, Division of Psychological Medicine, Institute of Psychiatry, King’s College London, UK, and Department of Psychiatry and Neuropsychology, Maastricht University, Maastricht, The Netherlands; Steven C. R. Williams, PhD, Neuroimaging Research Group, Department of Neurology, Institute of Psychiatry, King’s College London, UK;Michael J. Brammer, PhD,Xavier Chitnis, MSc, Brain Image Analysis Unit, Department of Biostatistics and Computing, Institute of Psychiatry, King’s College London, UK;Philip K. McGuire, MD, PhD, FRCPsych, Section of Neuroimaging, Division of Psychological Medicine, Institute of Psychiatry, King’s College London, UK.
Correspondence: Matthew R. Broome, Warwick Medical School, University of Warwick, Gibbet Hill, Coventry CV4 7AL, UK. Email: [email protected]
First received 5 Nov 2007, final revision 3 Jun 2008, accepted 24 Jun 2008
Acknowledgements
OASIS is supported by the Guy’s and St Thomas’ Charitable Foundation and the South London and Maudsley NHS Trust. E.B. is a Wellcome research fellow. Thanks go to all the clients, staff and referrers of both OASIS and Lambeth Early Onset Services. The authors are grateful to Dr. Paul Allen for advice on interpretation of the verbal fluency data.
References
1 Miller TJ, McGlashan TH, Rosen JL, Somjee L, Markovich PJ, Stein K, Woods SW. Prospective diagnosis of the initial prodrome for schizophrenia based on the Structured Interview for Prodromal Syndromes: preliminary evidence of interrater reliability and predictive validity.Am J Psychiatry2002; 159: 863–5.
2 Yung AR, Phillips LJ, Yuen HP, Francey SM, McFarlane CA, Hallgren M, McGorry PD. Psychosis prediction: 12-month follow up of a high-risk (’prodromal’) group.Schizophr Res2003;60: 21–32.
3 Wagner M, Frommann I, Jessen F, Pukrop R, Bechdolf A, Ruhrmann S, Klosterkoetter J, Brinkmeyer J, Woelwer W, Decker P, Maier W. Cognitive and neurobiological risk indicators in early and late prodromal stages.Schizophr Res2006;86(suppl): s35–6.
4 Pukrop R, Ruhrmann S, Schultze-Lutter F, Bechdolf A, Brockhaus-Dumke A, Klosterkotter J. Neurocognitive indicators for a conversion to psychosis: Comparison of patients in a potentially initial prodromal state who did or did not convert to a psychosis.Schizophr Res2007;92: 116–25.
5 Pantelis C, Velakoulis D, McGorry PD, Wood SJ, Suckling J, Phillips LJ, Yung AR, Bullmore ET, Brewer W, Soulsby B, Desmond P, McGuire PK. Neuroanatomical abnormalities before and after onset of psychosis: a cross-sectional and longitudinal MRI comparison.Lancet2003;361: 281–8.
6 Morey RA, Inan S, Mitchell TV, Perkins DO, Lieberman JA, Belger A. Imaging frontostriatal function in ultra-high-risk, early, and chronic schizophrenia during executive processing.Arch Gen Psychiatry2005;62: 254–62.
7 Yung AR, Phillips LJ, McGorry PD, McFarlane CA, Francey S, Harrigan S, Patton GC, Jackson HJ. Prediction of psychosis. A step towards indicated prevention of schizophrenia.Br J Psychiatry1998;172: s14–20.
8Broome MR, Woolley JB, Johns LC, Valmaggia LR, Tabraham P, Gafoor R, Bramon E, McGuire PK. Outreach and support in South London (OASIS): implementation of a clinical service for prodromal psychosis and the at risk mental state.Eur Psychiatry2005;20: 372–8.
9World Health Organization.ICD–10: The ICD–10 Classification of Mental and Behavioural Disorders: Clinical Descriptions and Diagnostic Guidelines. WHO, 1992.
10McGuffin P, Farmer A, Harvey I. A polydiagnostic application of operational criteria in studies of psychotic illness. Development and reliability of the OPCRIT system.Arch Gen Psychiatry1991;48: 764–70.
11American Psychiatric Association.Diagnostic and Statistical Manual of Mental Disorders(4th edn) (DSM–IV). APA, 1994.
12Nelson HE.National Adult Reading Test (NART) Manual. nferNelson, 1982.
13Kay S, Fiszbein A, Opler L. The positive and negative symptom scale (PANSS) for schizophrenia.Schizophr Bull1987;13: 261–76.
14Fu CH, Morgan K, Suckling J, Williams SC, Andrew C, Vythelingum GN, McGuire PK. A functional magnetic resonance imaging study of overt letter verbal fluency using a clustered acquisition sequence: greater anterior cingulate activation with increased task demand.Neuroimage2002;17: 871–9.
15Bullmore ET, Brammer MJ, Rabe-Hesketh S, Curtis VA, Morris RG, Williams SC, Sharma T, McGuire PK. Methods for diagnosis and treatment of stimulus-correlated motion in generic brain activation studies using fMRI.Hum Brain Mapp1999;7: 38–48.
16Friman O, Borga P, Lundberg P, Knutsson H. Adaptive analysis of fMRI data. Neuroimage2003;19: 837–45.
17Bullmore ET, Long C, Suckling J, Fadili J, Calvert G, Zelaya F, Carpenter A, Brammer M. Coloured noise and computational inference in
neurophysiological (fMRI) time series analysis. Resampling methods in time and wavelet domains.Hum Brain Mapp2001;12: 61–78.
18Bullmore ET, Suckling J, Overmayer S, Rabe-Hesketh S, Taylor E, Brammer MJ. Global, voxel and cluster tests, by theory and permutation, for a difference between two groups of structural MR images of the brain.IEEE Trans Med Imaging1999;18: 32–42.
19Talairach J, Tournoux P.Co-Planar Stereotaxic Atlas of the Human Brain 3-Dimensional Proportional System: An Approach to Cerebral Imaging. Thieme Publishing Group, 1988.
20Brammer MJ, Bullmore ET, Simmons A, Williams SCR, Grasby PM, Howard RJ, Woodruff PWR, Rabe-Hesketh S. Generic brain activation mapping in fMRI: a nonparametric approach..Magn Reson Imaging1997;15: 763–70.
21Thirion B, Pinel P, Meriaux S, Roche A, Dehaene S, Poline J-B. Analysis of a large fMRI cohort: statistical and methodological issues for group analysis. Neuroimage2007;35: 105–20.
22Callicott JH, Egan MF, Mattay VS, Bertolino A, Bone AD, Verchinksi B, Weinberger DR. Abnormal fMRI response of the dorsolateral prefrontal cortex in cognitively intact siblings of patients with schizophrenia.Am J Psychiatry 2003;160: 709–19.
23Callicott JH, Mattay VS, Verchinski BA, Marenco S, Egan MF, Weinberger DR. Complexity of prefrontal cortical dysfunction in schizophrenia: more than up or down.Am J Psychiatry2003;160: 2209–15.
24Honey R, Honey G, O’Loughlin C, Sharar SR, Kumaran D, Bullmore ET, Menon DK, Donovan T, Lupson VC, Bisbrown-Chippendale R, Fletcher PC. Acute ketamine administration alters the brain responses to executive demands in a verbal working memory task: an fMRI study.
Neuropsychopharmacology2004;29: 1203–14.
25Crespo-Facorro B, Paradiso S, Andreasen N, O’Leary DS, Watkins GL, Boles Ponto LL, Hichwa RD. Recalling word lists reveals ’cognitive dysmetria’ in schizophrenia: a positron emission tomography study.Am J Psychiatry1999; 156: 386–92.
26Curtis V, Dixon T, Morris R, Bullmore ET, Brammer MJ, Williams SC, Sharma T, Murray RM, McGuire PK. Differential frontal activation in schizophrenia and bipolar illness during verbal fluency.J Affect Disord2001;66: 111–21.
27Fu CH, Suckling J, Williams SC, Andrew CM, Vythelingum GN, McGuire PK. Effects of psychotic state and task demand on prefrontal function in schizophrenia: an fMRI study of overt verbal fluency.Am J Psychiatry2005; 162: 485–94.
28Yurgelun-Todd D, Waternaux C, Cohen B, Gruber S, English C, Renshaw P. Functional magnetic resonance imaging of schizophrenic patients during word production.Am J Psychiatry1996;153: 200–5.
29Spence SA, Brooks DJ, Hirsch SR, Liddle PF, Meehan J, Grasby PM. A PET study of voluntary movement in schizophrenic patients experiencing passivity phenomena (delusions of alien control).Brain1997;120(Pt 11): 1997–2011.
30Curtis V, Bullmore ET, Brammer MJ, Wright IC, Williams SC, Morris RG, Sharma TS, Murray RM, McGuire PK. Attenuated frontal activation during a
verbal fluency task in patients with schizophrenia.Am J Psychiatry1998; 155: 1056–63.
31Wagner AD, Pare-Blagoev EJ, Clark J, Poldrack RA. Recovering meaning: left prefrontal cortex guides controlled semantic retrieval.Neuron2001;31: 329–38.
32Moss HE, Abdallah S, Fletcher P, Bright P, Pilgrim L, Acres K, Tyler LK. Selecting among competing alternatives: selection and retrieval in the left inferior frontal gyrus.Cereb Cortex2005;15: 1723–35.
33Brewer WJ, Francey SM, Wood SJ, Jackson HJ, Pantelis C, Phillips LJ, Yung AR, Anderson VA, McGorry PD. Memory impairments identified in people at ultra-high risk for psychosis who later develop first-episode psychosis.Am J Psychiatry2005;162: 71–8.
34Hawkins KA, Addington J, Keefe RS, Christensen B, Perkins DO, Zipurksy R, Woods SW, Miller TJ, Marquez E, Breier A, McGlashan TH. Neuropsychological status of subjects at high risk for a first episode of psychosis.Schizophr Res2004;67: 115–22.
35Gschwandtner U, Aston J, Borgwardt S, Drewe M, Feinendegen C, Lacher D, Lanzarone A, Stieglitz RD, Riecher-Ro¨ssler A. Neuropsychological and neurophysiological findings in individuals suspected to be at risk for schizophrenia: preliminary results from the Basel early detection of psychosis study – Fruherkennung von Psychosen (FEPSY).Acta Psychiatr Scand2003; 108: 152–5.
36Pflueger MO, Gschwandtner U, Aston J, Berger G, Borgwardt S, Drewe M, D’souza M, Rechsteiner E, Stieglitz RD, Riecher-Roessler A. Cognitive capability of individuals at risk with and without transition to psychosis.Eur Psychiatry2007;22: s30.
37Broome MR, Johns LC, Valli I, Woolley JB, Tabraham P, Brett C, Valmaggia L, Peters E, Garety PA, McGuire PK. Delusion formation and reasoning biases in those at clinical high risk for psychosis.Br J Psychiatry2007;51: s38–42.