Improving Interaction Quality Recognition Using Error Correction
Stefan Ultes
Ulm University Albert-Einstein-Allee 43
89081 Ulm, Germany
Wolfgang Minker
Ulm University Albert-Einstein-Allee 43
89081 Ulm, Germany
Abstract
Determining the quality of an ongoing in-teraction in the field of Spoken Dialogue Systems is a hard task. While existing methods employing automatic estimation already achieve reasonable results, still there is a lot of room for improvement. Hence, we aim at tackling the task by es-timating the error of the applied statistical classification algorithms in a two-stage ap-proach. Correcting the hypotheses using the estimated model error increases per-formance by up to 4.1 % relative improve-ment in Unweighted Average Recall.
1 Introduction
Evaluating the quality of Spoken Dialogue Sys-tems (SDSs) has long since been a challenging task. While objective metrics liketask completion
and dialogue duration are not human-centered, subjective measures compensate for this by mod-eling the user’s subjective experience. This infor-mation may be used to increase the dialogue sys-tem’s performance (cf. (Ultes et al., 2012b)).
In human-machine dialogues, however, there is no easy way of deriving the user’s satisfaction level. Moreover, asking real users for answering questions about the system performance requires them to spend more time talking to the machine than necessary. It can be assumed that a regular user does not want to do this as human-machine dialogues usually have no conversational charac-ter but are task oriented. Hence, automatic ap-proaches are the preferred choice.
Famous work on determining the satisfaction level automatically is the PARADISE framework by Walker et al. (1997). Assuming a linear depen-dency between objective measures and User Satis-faction (US), a linear regression model is applied to determine US on thedialogue level. This is not
only very costly, as dialogues must be performed with real users, but also inadequate if quality on a finer level is of interest, e.g., on theexchange level. To overcome this issue, work by Schmitt et al. (2011) introduced a new metric for measuring the performance of an SDS on theexchange level
called Interaction Quality (IQ). They used statisti-cal classification methods to automatistatisti-cally derive the quality based on interaction parameters. Qual-ity labels were applied by expert ratersafterthe di-alogue on the exchange level, i.e., for each system-user-exchange. Automatically derived parameters were then used as features for creating a statistical classification model using static feature vectors. Based on the same data, Ultes et al. (2012a) put an emphasis on the sequential character of the IQ measure by applying temporal statistical classifi-cation using Hidden Markov Models (HMMs) and Continuous Hidden Markov Models (CHMMs).
However, statistical classifiers usually do not achieve perfect performance, i.e., there will al-ways be misclassification. While most work fo-cuses on applying different statistical models and improving them (Section 2), learning the error to correct the result afterwards represents a different approach. Therefore, we present our approach on estimating the error of IQ recognition models to correct their hypothesis in order to eventually yield better recognition rates (Section 4). The definition of IQ and data used for the evaluation of our ap-proach (Section 5) is presented in Section 3. Our approach is also compared to a simple hierarchical approach also discussed in Section 5.
2 Related Work on Dialogue Quality Besides Schmitt et al., other research groups have performed numerous work on predicting subjec-tive quality measures on an exchange level, all not incorporating any form of error correction.
Engelbrecht et al. (2009) presented an approach using Hidden Markov Models (HMMs) to model
en
… en-2 en-1
e1 en+1 … exchange level parameters
[image:2.595.72.290.62.110.2]window level parameters dialogue level parameters
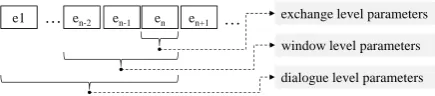
Figure 1: The three different modeling levels rep-resenting the interaction at exchangeen.
the SDS as a process evolving over time. Perfor-mance ratings on a 5 point scale (“bad”, “poor”, “fair”, “good”, “excellent”) have been applied by the users during the dialogue.
Higashinaka et al. (2010) proposed a model for predicting turn-wise ratings for human-human dia-logues analyzed on a transcribed conversation and human-machine dialogues with text from a chat system. Ratings ranging from 1 to 7 were ap-plied by two expert raters labeling for smoothness, closeness, and willingness.
Hara et al. (2010) derived turn level ratings from overall ratings of the dialogue which were applied by the usersafterwardson a five point scale. Us-ing n-grams to model the dialogue, results for dis-tinguishing between six classes at any point in the dialogue showed to be hardly above chance.
3 The LEGO Corpus
For estimating the Interaction Quality (IQ), the LEGO corpus published by Schmitt et al. (2012) is used. IQ is defined similarly to user satisfac-tion: While the latter represents the true disposi-tion of the user, IQ is the disposidisposi-tion of the user as-sumed by an expert rater. The LEGO corpus con-tains 200 calls (4,885 system-user-exchanges) to a bus information system (cf. (Raux et al., 2006)). Labels for IQ on a scale from 1 (extremely un-satisfied) to 5 (un-satisfied) have been assigned by three expert raters with an inter-rater agreement of κ = 0.54. In order to ensure consistent labeling,
the expert raters had to follow labeling guidelines (cf. (Schmitt et al., 2012)).
Parameters used as input variables for the IQ model have been derived from the dialogue sys-tem modules automatically for each exchange on three levels: theexchange level, thedialogue level, and thewindow level(see Figure 1). As parame-ters like the confidence of the speech recognizer can directly be acquired from the dialogue mod-ules, they constitute theexchange level. Based on this, counts, sums, means, and frequencies of ex-change level parameters from multiple exex-changes
are computed to constitute thedialogue level (all exchanges up to the current one) and thewindow level(the three previous exchanges). A complete list of parameters is listed in (Schmitt et al., 2012). Schmitt et al. (2011) performed IQ recognition on this data using linear SVMs. They achieved an Unweighted Average Recall (UAR) of 0.58 based on 10-fold cross-validation. Ultes et al. (2012a) applied HMMs and CHMMs using 6-fold cross validation and a reduced feature set achieving an UAR of 0.44 for HMMs and 0.39 for CHMMs.
4 Error Estimation Model
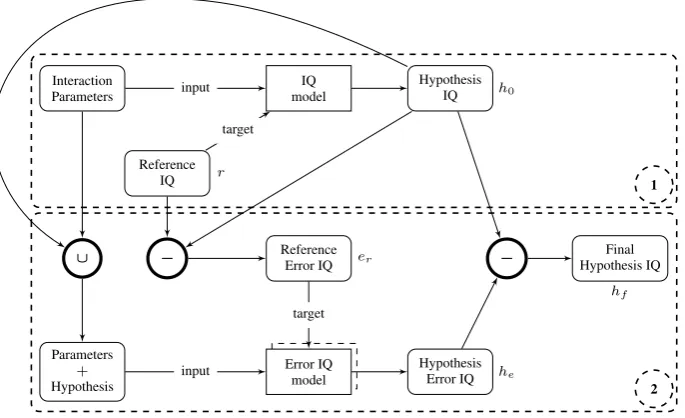
Error correction may be incorporated into the sta-tistical classification process by a two-stage ap-proach, which is depicted in Figure 2.
At the first stage, a statistical classification model is created using interaction parameters as input and IQ as target variable. For this work, a Support Vector Machine (SVM) and a Rule Learner are applied. At the second stage, the er-rorerof the hypothesish0is calculated by
er =h0−r , (1)
where the referencer denotes the true IQ value. In order to limit the number of error classes, the signum function is applied. It is defined as
sgn(x) :=
−1 ifx <0,
0 ifx= 0,
1 ifx >0.
(2)
Therefore, the error is redefined as
er = sgn(h0−r). (3)
Next, a statistical model is created similarly to stage one but targeting the errorer. The difference is that the input parameter set is extended by the IQ hypothesish0of stage one. Here, two approaches
are applied: Creating one model which estimates all error classes (−1,0,1) and creating two
mod-els where each estimates positive (0,1) or negative error (−1,0). For the latter variant, the error of
the class which is not estimated by the respective model is mapped to 0. By this, the final error hy-pothesishemay be calculated by simple addition of both estimated error values:
he=he−1 +he+1 . (4)
1
2 IQ
model Interaction
Parameters HypothesisIQ h0
Reference
IQ r
− ReferenceError IQ er
∪
Parameters + Hypothesis
Error IQ model Error IQ
model HypothesisError IQ he
− Hypothesis IQFinal
hf
input
target
input
[image:3.595.130.473.64.273.2]target
Figure 2: The complete IQ estimation process including error correction. After estimating IQ in Stage 1 (upper frame), the error is estimated and the initial hypothesis is corrected in Stage 2 (lower frame).
at stage one produces the final hypothesis hf de-noting the Interaction Quality estimation corrected by the estimated error of the statistical model:
hf =h0−he. (5)
As the error estimation will not work perfectly, it might recognize an error where there is none or – even worse – it might recognize an error contrary to the real error, e.g.,−1instead of+1. Therefore,
the corrected hypothesis might be out of range. To keep hf within the defined bounds of IQ, a lim-iting functions is added to the computation of the final hypothesis resulting in
hf = max(min(h0−he), bu), bl), (6)
wherebudenotes the upper bound of the IQ labels andblthe lower bound.
5 Experiments and Results
All experiments are conducted using the LEGO corpus presented in Section 3. By applying 5-fold cross validation, hypotheses for each system-user-exchange which is contained in the LEGO corpus are estimated. Please note that some textual inter-action parameters are discarded due to their task-dependent nature leaving 45 parameters1.
For evaluation, we rely on two measures: The unweighted average recall (UAR) and the root
1Removed parameters: Activity, LoopName, Prompt,
RoleName, SemanticParse, SystemDialogueAct, UserDia-logueAct, Utterance
mean squared error (RMSE). UAR represents the accuracy corrected by the effects of unbalanced data and is also used by cited literature. RMSE is used since the error correction method is limited to correcting the results only by one. For bigger errors, the true value cannot be reached.
The performances of two different statistical classification methods are compared, both applied for stage one and stage two: Support Vector Ma-chine (SVM) (Vapnik, 1995) using a linear ker-nel, which is also used by Schmitt et al. (2011), and Rule Induction (RI) based on Cohen (1995). Furthermore, a normalization component is added performing a range normalization of the input pa-rameters in both stages. This is necessary for using the implementation of the statistical classification algorithms at hand.
For error estimation, two variants are explored: using one combined model for all three error classes (−1,0,+1) and using two separate models,
one for distinguishing between−1and0and one
for distinguishing between +1 and 0 with
com-bining their results afterwards. While using RI for error estimation yields reasonable performance re-sults for the combined model, it is not suitable for error estimation using two separate models as all input vectors are mapped to 0. Hence, for the two model approach, only the SVM is applied .
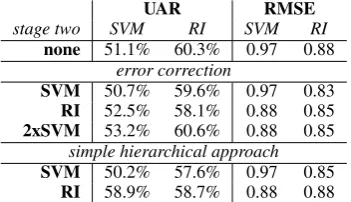
Table 1: Results for IQ recognition: UAR and RMSE for IQ recognition without stage two, with error correction at stage two, and with a simple hi-erarchical approach.
UAR RMSE
stage two SVM RI SVM RI
none 51.1% 60.3% 0.97 0.88 error correction
SVM 50.7% 59.6% 0.97 0.83 RI 52.5% 58.1% 0.88 0.85 2xSVM 53.2% 60.6% 0.88 0.85
simple hierarchical approach
SVM 50.2% 57.6% 0.97 0.85 RI 58.9% 58.7% 0.88 0.88
at stage one, performance is only increased by up to 0.5 % which has shown to be not significant us-ing the Wilcoxon test. The relative improvements in UAR are depicted in Figure 3.
Furthermore, these results are compared to a simple hierarchical approach (SH) where the hy-pothesis h0 of the stage one classifier is used as
an additional feature for the stage two classifier targeting IQ directly. Here, the performance of the stage two classifier is of most interest since this approach can be viewed as one stage classi-fication with an additional feature. The results in Table 1 show that RI does not benefit from addi-tional information (comparison of last row with one stage RI recognition). SVM recognition at stage two, though, shows better results. While its performance is reduced using the SVM hypothe-sis as additional feature, adding the RI hypothehypothe-sis improved UAR up to 12.6 % relatively. However, there is no reasonable scenario where one would not use the better performing RI in favor of using its results as additional input for SVM recognition. The question remains why SVM benefits from Error Correction as well as from adding additional input parameters while RI does not. It remains un-clear if this is an effect of the task characteristics combined with the characteristics of the classifi-cation method. It may as well be caused by low classification performance. A classifier with low performance might be more likely to improve its performance by additional information or EC.
6 Conclusion
In this work, we presented an approach for im-proving the recognition of Interaction Quality by estimating the error of the classifier in order to cor-rect the hypothesis. For the resulting two-staged
‐0.8%
‐1.3% 2.7%
‐3.7% 4.1%
0.5%
‐4%
‐3%
‐2%
‐1% 0% 1% 2% 3% 4%
SVM RI
error correction (SVM)
error correction (RI)
[image:4.595.94.270.129.230.2]error correction (2 x SVM)
Figure 3: The relative improvement of EC in UAR grouped by stage one classifiers SVM and RI.
approach, two different statistical classification al-gorithm were applied for both stages, i.e., SVM and Rule Learner. Performance could be improved for both stage one classifiers using separate er-ror models relatively improving IQ recognition by up to 4.1 %. The proposed error correction ap-proach has been compared to a simple hierarchi-cal approach where the hypohtesis of stage one is used as additional feature of stage two classi-fication. This apprach relatively improved SVM recognition by up to 12.6 % using a Rule Learner hypothesis as additional feature. However, as one-stage Rule Learner classification already provides better results than this hierarchical approach, is does not seem reasonable to employ this config-uration. Nonethelesse, why only the SVM could benefit from additional information (error correc-tion or simple hierarchical appraach) remains un-clear and should be investigated in future work.
Moreover, some aspects of the error correc-tion approach have to be discussed controversially, e.g., applying the signum function for calculating the error. While the obvious advantage is to limit the number of error classes a statistical classifica-tion algorithm has to estimate, it also prohibits of being able to correct all errors. If the absolute er-ror is bigger than one it can never be corrected.
Acknowledgments
References
William W. Cohen. 1995. Fast effective rule induc-tion. InProceedings of the 12th International Con-ference on Machine Learning, pages 115–123. Mor-gan Kaufmann, July.
Klaus-Peter Engelbrecht, Florian G¨odde, Felix Har-tard, Hamed Ketabdar, and Sebastian M¨oller. 2009. Modeling user satisfaction with hidden markov model. InSIGDIAL ’09: Proceedings of the SIG-DIAL 2009 Conference, pages 170–177, Morris-town, NJ, USA. Association for Computational Lin-guistics.
Sunao Hara, Norihide Kitaoka, and Kazuya Takeda. 2010. Estimation method of user satisfaction us-ing n-gram-based dialog history model for spoken dialog system. In Nicoletta Calzolari (Conference Chair), Khalid Choukri, Bente Maegaard, Joseph Mariani, Jan Odijk, Stelios Piperidis, Mike Ros-ner, and Daniel Tapias, editors, Proceedings of the Seventh conference on International Language Re-sources and Evaluation (LREC’10), Valletta, Malta, May. European Language Resources Association (ELRA).
Ryuichiro Higashinaka, Yasuhiro Minami, Kohji Dohsaka, and Toyomi Meguro. 2010. Issues in pre-dicting user satisfaction transitions in dialogues: In-dividual differences, evaluation criteria, and predic-tion models. In Gary Lee, Joseph Mariani, Wolf-gang Minker, and Satoshi Nakamura, editors, Spo-ken Dialogue Systems for Ambient Environments, volume 6392 of Lecture Notes in Computer Sci-ence, pages 48–60. Springer Berlin / Heidelberg. 10.1007/978-3-642-16202-2 5.
Antoine Raux, Dan Bohus, Brian Langner, Alan W. Black, and Maxine Eskenazi. 2006. Doing research on a deployed spoken dialogue system: One year of lets go! experience. In Proc. of the Interna-tional Conference on Speech and Language Process-ing (ICSLP), September.
Alexander Schmitt, Benjamin Schatz, and Wolfgang Minker. 2011. Modeling and predicting quality in spoken human-computer interaction. In Proceed-ings of the SIGDIAL 2011 Conference, Portland, Oregon, USA, June. Association for Computational Linguistics.
Alexander Schmitt, Stefan Ultes, and Wolfgang Minker. 2012. A parameterized and annotated cor-pus of the cmu let’s go bus information system. In
International Conference on Language Resources and Evaluation (LREC).
Stefan Ultes, Robert ElChabb, and Wolfgang Minker. 2012a. Application and evaluation of a conditioned hidden markov model for estimating interaction quality of spoken dialogue systems. In Joseph Mari-ani, Laurence Devillers, Martine Garnier-Rizet, and Sophie Rosset, editors, Proceedings of the 4th In-ternational Workshop on Spoken Language Dialog
System (IWSDS), pages 141–150. Springer, Novem-ber.
Stefan Ultes, Alexander Schmitt, and Wolfgang Minker. 2012b. Towards quality-adaptive spoken dialogue management. In NAACL-HLT Workshop on Future directions and needs in the Spoken Di-alog Community: Tools and Data (SDCTD 2012), pages 49–52, Montr´eal, Canada, June. Association for Computational Linguistics.
Vladimir N. Vapnik. 1995. The nature of statistical learning theory. Springer-Verlag New York, Inc., New York, NY, USA.