39
Solution to Economic Load Dispatch with Valve Point
Loading Effect using Hybrid Whale Optimization
Algorithm
Shivani Mehta
Department of Electrical
Engineering
DAVIET
Harmandeep Singh
Department of Electrical
Engineering
DAVIET
ABSTRACT
This paper presents Hybrid Whale Optimization for the purpose of solving Generalized Economic Load Dispatch Problem (ELDP). Hybrid Metaheuristics are one of the most modern and interesting methods in optimization algorithms. In this algorithm, after each iteration of whale optimization algorithm, in order to reach to the best solution, particle swarm optimization algorithm is utilized. The comparison shows superiority of recently developed algorithm to the already applied algorithms for the problems pertaining to economic load dispatch.
Keywords
Economic load dispatch (ELD), Valve-point loading, Meta-heuristics optimization algorithms, transmission loss.
1. INTRODUCTION
Economic load dispatch (ELD) is a standout amongst the most vital and principal advancement task in control framework for distributing electrical power among the conferred units. The problem of economic dispatch has non-convex, non-linear and discontinuous characteristics, due to which it has been solved via many traditional optimization methods. The mathematical programming that depends on inclinations, for example, the Newton based arrangement of incorporating optimal conditions, cross breed adaptation of direct and quadratic programming, lagrange relaxation, lambda iterative strategy, inside point strategies, quadratic programming, dynamic programming and so forth has been connected to understand ELD. But these programming methods were not able to provide optimal global solution, due to which various evolutionary and heuristic techniques were introduced. The benefits of these techniques incorporate optimality which is scientifically demonstrated in a few calculations [1], application to extensive scale issues [2], free from particular issue parameters for indication [3] and are analytically quick.
In this manner, in earlier years, different evolutionary, heuristic and meta-heuristics algorithms have been framed from different regular marvels, for example, Differential Evolution (DE) [4], Genetic Algorithm (GA) [1][5], Tabu search [6], Particle swarm optimization (PSO) [3][7][8], Bacterial forging hybrid with particle swarm optimization [9], Biography Based Optimization algorithm(BBOA)[10], Krill herd algorithm (KHA)[11][12], Artificial Bee Colony optimization(ABC)[13], Firefly Algorithm(FA) [14][15][16], Cuckoo Search (CS)[17][18][19], Whale Optimization Algorithm(WOA)[20][21], for the purpose of solving ELD problems.
These days crossover strategies [23][24][25]are being used which joins at least two nearby and worldwide advancement procedures keeping in mind the end goal to get best highlights of
every algorithm. Victoire T.A.A and Jeykumar A.E [26] exhibited a strategy for taking care of the ELD dispatch issue by coordinating PSO with the successive quadratic programming (SQP) method. Coelho L.S and Mariani V.C[27] proposed the strategy which joins differential evolution algorithm with chaos groupings and SQP method to improve the execution of ELD issues. Wang et al. [28] presented self-tuned hybrid DE which uses the idea of the twenty percent achievement of advancement systems in the first HDE to quicken the scan for the global optimum. Panigrahi B.K and Pandi V.R[29] exhibited hybrid BFO procedure.
This paper presents the research into five sections. In section 2, is presented the formulation of economic load dispatch problem. In section 3, the previous algorithms, i.e. WOA and PSO are briefly explained; and then the hybrid approach of WOA-PSO is implemented to solve ELD problem. Results and discussion are shown in Section 4 and the conclusion of the paper is demonstrated in Section 5.
2.
ECONOMIC LOAD DISPATCH
PROBLEM FORMULATION
2.1
Smooth Cost functions
To decrease the operational cost of power generation framework, while fulfilling diverse imperatives, when the required load of energy framework is being provided, is the outright point of the economic load dispatch problem. Following condition demonstrates the objective function[30]:
𝐹 𝑃𝑛 = 𝑘𝑛=1 𝑎𝑛𝑃𝑛2+ 𝑏𝑛𝑃𝑛+ 𝑐𝑛 ....(1)
Here 𝑐𝑛, 𝑏𝑛, 𝑎𝑛 represent the coefficients of fuel cost of nth
generator with units Rs/hr, Rs/MW hr and Rs/MW2hr respectively.
2.2
Problem Constraints[5]
Following limitation have been utilized for lessening the general fuel cost:
1) Power balance constraint
The aggregate generation by every one of the generators must be equivalent to the aggregate power demand and framework's genuine power loss, i.e.
𝑘
𝑛=1 𝑃𝑛− 𝑃𝑑− 𝑃𝑡𝑙 .... (2)
2) Generator limit constraint
According to this each generating unit should not operate above its rating or below some least possible generation.
𝑃𝑛𝑚𝑖𝑛 ≤𝑃𝑛≤𝑃𝑛𝑚𝑎𝑥 n=1,2,...,k …..(3)
𝑄𝑛𝑚𝑖𝑛 ≤𝑄𝑛≤𝑄𝑛𝑚𝑎𝑥 n=1,2,...,k ...(4)
k : number of electric generating units 𝐹𝑃𝑛: Overall fuel cost, Rs/h
𝑃𝑛𝑚𝑖𝑛: nth generator least possible limit of reactive power
40 𝑃𝑛𝑚𝑎𝑥: nth generator top possible limit of real power generation
in MW
𝑄𝑛𝑚𝑖𝑛: nth generator least possible limit of reactive power
generation in MW
𝑄𝑛𝑚𝑎𝑥: nth generator top possible limit of reactive power
generation in MW 𝑃𝑑 : Power demand, MW
𝑃𝑡𝑙 : Transmission losses, MW
For conveying Transmission loss, 𝑃𝑡𝑙, George's Formula is being
utilized as a component of generator powers utilizing B-coefficients, and the following equation communicates it mathematically:
𝑃𝑡𝑙= 𝑘𝑛 =1 𝑘𝑚 =1 𝑃𝑛𝐵𝑚𝑛𝑃𝑚𝑀𝑊 …(5)
where real power generations at the nth and mth buses are 𝑃𝑛 and
𝑃𝑚.
𝐵𝑚𝑛 is a constant and a loss coefficients
A Penalty factor is introduced which converts the constrained ELD problem to unconstrained ELD and it can be mathematically expressed as [31]:
𝑀𝑖𝑛 𝐹𝐶 (𝑃
𝑛)] =
𝑘𝐹
𝑛𝑛=1
𝑃
𝑛+ (
𝑘𝑛=1𝑃
𝑛− 𝑃
𝑑−
𝑘𝑛=1 𝑘𝑚 =1
𝑃
𝑛𝐵
𝑚𝑛𝑃
𝑚…(6)
Eq. (5) depicts the unconstrained ELD problem with penalty factor, 𝑘𝑛 =1 𝑘𝑚 =1 𝑃𝑛𝐵𝑚𝑛𝑃𝑚.
The whole unconstrained ELD problem having k variables can be characterized as
𝑀𝑖𝑛 𝐹𝐶 (𝑃
𝑛)] =
𝑘𝑛=1𝑎
𝑛𝑃
𝑛2+ 𝑏
𝑛𝑃
𝑛+ 𝑐
𝑛+ (
𝑘𝑛=1𝑃
𝑛−
𝑃
𝑑−
𝑘𝑛=1 𝑘𝑚 =1
𝑃
𝑛𝐵
𝑚𝑛𝑃
𝑚)
....(7)
2.3
Non-Smooth Cost capacities with valve
point loading[32][33]
Generators with more than one steam turbines have altogether dissimilar input-output curve if smooth cost work is taken into consideration, as illustrated in the Figure 1[32]. As each steam valve opens, the fluctuations are taken into consideration for the valve-point impacts for which the quadratic cost function includes an additional sinusoidal function as shown in the following equation:
𝐹 𝑃𝑛 = 𝑘𝑛=1 𝑎𝑛𝑃𝑛2+ 𝑏𝑛𝑃𝑛+ 𝑐𝑛 + |𝑒𝑛∗ 𝑠𝑖𝑛(𝑓𝑛(𝑃𝑛 𝑚𝑖𝑛−
𝑃𝑛))| ....(8)
[image:2.595.320.512.153.268.2]Where 𝑒𝑛, 𝑓𝑛 represent the coefficients of generator n.
Fig 1: Valve point loading effect[32]
3.
PROPOSED TECHNIQUE
3.1
Whale Optimization Algorithm[34]
WOA is a streamlining strategy got from chasing technique of humpback whales. This chasing technique, in which they hunt down their prey is quite unique. The humpback whales are portrayed by this special technique known as the bubble-netfeeding strategy. It is considered as an extraordinary and one of a conduct through which the humpback whales creates bubbles in spiral shape, encloses the prey and swims towards the surface. This conduct is depicted in Figure 2[34]. So inside the flow work, two theories can be utilized i.e. the scientific model of enclosing prey and the spiral bubble net feeding move beside scan for prey, depicted by WOA calculation.
Fig2: Bubble-net feeding method of humpback whales[34]
Following equation depicts the behavior:
𝐷
= |𝐶 . 𝑋
∗(𝑡) − 𝑋 (𝑡)|
𝑋 (𝑡 + 1) = 𝑋
∗(𝑡) − 𝐴 . 𝐷
...(9)
The current iteration is illustrated by symbol t, coefficient vectors are depicted by 𝐴 and 𝐶 , the best solution obtained so far is defined by the position vector 𝑋 , | | is the unconditional value whereas for element by element multiplication, dot(.) operator is used. It merits specifying here that for getting a superior arrangement 𝑋 is refreshed in each cycle.The values of 𝐴 and 𝐶 can be estimated using the following equation:
𝐴 = 2𝑎 . 𝑟 − 𝑎
𝐶 = 2𝑟
...(10)
Where 𝑟 being an arbitrary vector in [0,1], 𝑎 is linearly downsized through the span of emphases from 2 to 0.
3.1.1
Bubble net attacking method (exploration
phase
):
With a specific end goal to scientifically show the humpback whales with bubble net behavior, following are the two methodologies:
a)Shrinking encircling mechanism
By diminishing the estimation of 𝑎 in the equation(10), shrinking encircling mechanism is accomplished. Note that 𝑎 diminished the variance scope of 𝐴 . While, throughout iterations 𝑎 is diminished from 2 to 0, 𝐴 is a random value in the interval [-a,a]. The new position of a pursuit operator and the position of the present best operator is obtained by setting arbitrary values for 𝐴 in [-1,1]. The conceivable positions from (𝑋, 𝑌) towards (𝑋*
, 𝑌*
[image:2.595.55.298.537.672.2]41
Fig 3: Shrinking encircling mechanism[34]
b)Spiral updating position
The separation between the whale at (𝑋, 𝑌) and prey at (𝑋* , 𝑌*
) is initially ascertained by this method, illustrated in Figure 4[41]. In order to link the position of a whale and prey for imitating the helix form development of humpback whales a spiral equation is made, as follows:
𝑋 (𝑡 + 1) = 𝐷 . 𝑒𝑏𝑙. 𝑐𝑜𝑠(2𝜋𝑙) + 𝑋 ∗(𝑡) ...(11)
Fig 4: Spiral updating position[34]
The best solution procured till then is the separation of the prey and the whale and is demonstrated by = |𝑋 ∗(𝑡) − 𝑋 (𝑡)|, the
state of the logarithmic spiral is characterized by a constant b, l is a arbitrary number in [-1,1], and element by element multiplication is done by using dot(.) operator.
One thing is to be taken into notice that humpback whales dive in the vicinity of the prey amidst a contracting circle and in the lead of a spiral formed way at the same moment. Below is the arithmetical model of the above said conduct:
𝑓(𝑥) = 𝑋
∗ (𝑡) − 𝐴. 𝐷 𝑖𝑓 𝑝 < 0.5
𝐷. 𝑒𝑏𝑙. 𝑐𝑜𝑠(2𝜋𝑙) + 𝑋∗(𝑡)𝑥, 𝑖𝑓 𝑝 > 0.5 ...(12)
Where p is a random number in [0,1].
Search for prey exploration phase: To scan for prey (exploration), a similar path in the light of variety of the vector 𝐴 can be used. The position of an inspecting operator in the investigation stage is refreshed as per an arbitrarily picked search agent rather than the best pursuit operator discovered up until now, as opposed to the exploitation stage. WOA algorithm is permitted to carry out a global search using this mechanism and 𝐴 > 1 accentuate exploration. Following is the arithmetical for the above said statement:
𝐷 = |𝐶 . 𝑋 𝑟𝑎𝑛𝑑(𝑡) − 𝑋 |
𝑋 (𝑡 + 1) = 𝑋 𝑟𝑎𝑛𝑑 − 𝐴 . 𝐷 ...(13)
where 𝑋 𝑟𝑎𝑛𝑑 rand is browsed the current population as a
arbitrary position vector (a random whale).
Particle Swarm Optimization
Particle Swarm Optimization is a populace based stochastic improvement technique, created by James Kennedy and Russel Eberhart[2], enlivened by the social practices of creatures like fish tutoring and feathered creature rushing. A gathering of particles makes up a swarm or populace. In each progression, a particle modifies its position in view of its speed, and updates the speed as per its own involvement (the individual best (pbest) result accomplished by it and the involvement of alternate particles (the worldwide best (gbest) arrangement accomplished so far, contrasting with other populace based stochastic streamlining techniques, for example, the evolutionary algorithms. Therefore in PSO algorithm the velocity and position of individual i, depicted by the vectors 𝑉𝑖=
(𝑣𝑖𝑙… … … 𝑣𝑖𝑛) and 𝑋𝑖= (𝑥𝑖𝑙… … … 𝑥𝑖𝑛) respectively, are
obtained by searching that individual in coordination with group of individuals, in a physical search space with n as dimension. Let 𝐺𝑏𝑒𝑠𝑡𝑖= (𝑥𝑖𝑙𝐺𝑏𝑒𝑠𝑡 … … … 𝑥𝑖𝑛𝐺𝑏𝑒𝑠𝑡) and 𝑃𝑏𝑒𝑠𝑡𝑖=
(𝑥𝑖𝑙𝑃𝑏𝑒𝑠𝑡 … … … 𝑥
𝑖𝑛𝑃𝑏𝑒𝑠𝑡) be the position of the its neighbors
and individual i respectively i.e. the best position procured so far[2]. Consequently the velocity vector is updated as follows: 𝑉𝑖𝑘+1= (𝑤𝑉
𝑖𝑘 + 𝑐1𝑟𝑎𝑛𝑑1× (𝑃𝑏𝑒𝑠𝑡𝑖𝑘− 𝑋𝑖𝑘) + 𝑐2𝑟𝑎𝑛𝑑2×
(𝐺𝑏𝑒𝑠𝑡 − 𝑋𝑖𝑘) ...(14)
Where
𝑉𝑘𝑖 velocity of individual at iteration
W weight parameter c1, c2 weight factors
rand1, rand2 random numbers between 0 and1 𝑋𝑘𝑖 position of individual i iteration k
𝑃𝑏𝑒𝑠𝑡𝑘𝑖 best position of individual until iteration k
𝐺𝑏𝑒𝑠𝑡𝑘𝑖 best position of individual until iteration k
Each individual moves from the current position to the next one by the modified velocity in (14) using the following equation.
𝑋𝑖𝑘+1= 𝑋𝑖𝑘+ 𝑉𝑖𝑘+1 ...(15)
Fig 5: Search mechanism of PSO[2]
3.2
WOA-PSO Algorithm
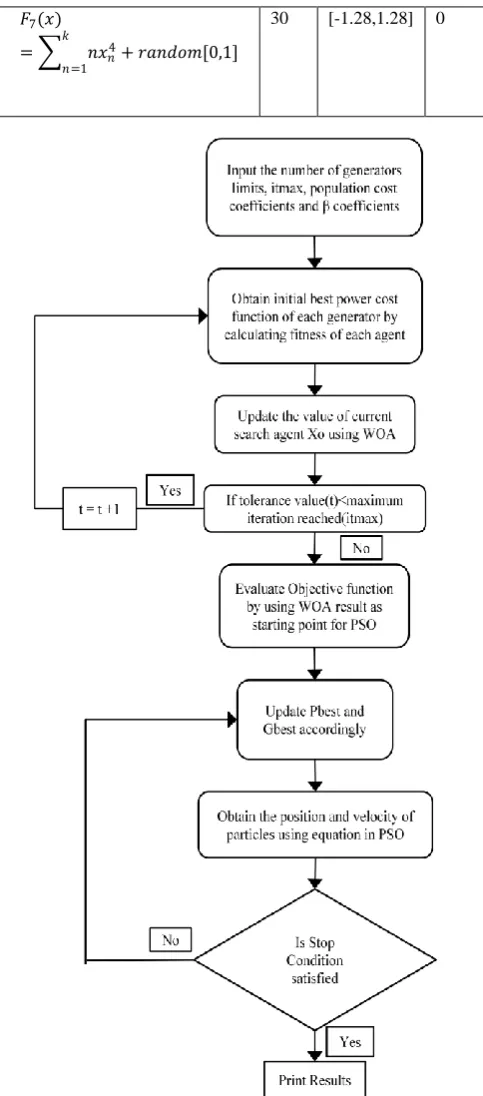
[image:3.595.63.248.316.481.2]42 arrangement that empowers the algorithm to investigate global
search space, which additionally enhances the exploitation capacity of PSO. Final estimations of the acquired parameters by WOA are viewed as the underlying focuses for the calculation of PSO. The sequential diagram of the approach proposed WOA-PSO is elucidated via Figure 6 in order to solve ELD problem. The fundamental thought is to make a mixture between the metaheuristics base of WOA-PSO.
4.
RESULTS AND DISCUSSION
4.1 Test result of Classical Benchmark
functions
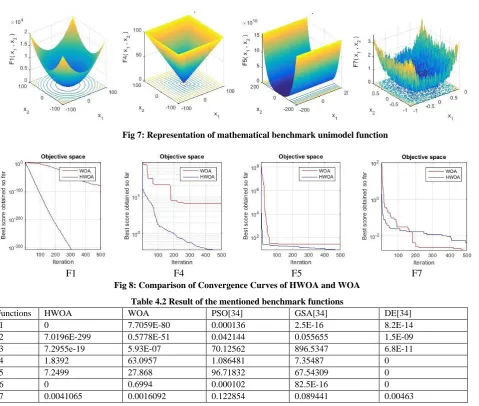
[image:4.595.311.553.74.623.2]The numerical proficiency of HWOA has been tried on established unimodel benchmark capacities[34]. In the results, HWOA is contrasted with WOA, PSO [34] , GSA [34] and DE [34]. For every benchmark work, the HWOA calculation was run 30 times beginning from various populaces arbitrarily created. Here functions F1–F7 are shown in Table 4.1, are unimodal since they have only one global optimum. These functions calculate the exploitation capability of the investigated meta-heuristic algorithms. It can be seen from Table 4.2 that HWOA is very competitive with other meta-heuristic algorithms.
Table 4.1. Description of fixed unimodel benchmark function
Function V-no Range 𝑓𝑚𝑖𝑛
𝐹1(𝑥) = 𝑥𝑖2 𝑘
𝑛=1
30 [-100,100] 0
𝐹2(𝑥)
= |𝑥𝑛| 𝑘
𝑛 =1 + |𝑥𝑛| 𝑘
𝑛 −1
30 [-10,-10] 0
𝐹3(𝑥) = 𝑥𝑚 𝑘
𝑚 =1 2 𝑘
𝑛=1
30 [-100,-100] 0
𝐹4(𝑥) = 𝑚𝑎𝑥𝑛 |𝑥𝑛|,1 ≤ 𝑛 ≤ 𝑘 30 [-100,100] 0
𝐹6(𝑥) = 100 𝑥𝑛+1 𝑘−1
𝑛=1
− 𝑥𝑛2 2
+ 𝑥𝑛
− 1 2
30 [-30,30] 0
𝐹5(𝑥) = 𝑥𝑛+ 0.5 2 𝑘
𝑛=1
30 [-100,100] 0
𝐹7(𝑥)
= 𝑛𝑥𝑛4 𝑘
𝑛=1 + 𝑟𝑎𝑛𝑑𝑜𝑚[0,1]
[image:4.595.47.298.341.656.2]30 [-1.28,1.28] 0
43
Fig 7: Representation of mathematical benchmark unimodel function
F1
F4
F5
F7
[image:5.595.74.531.74.189.2]Fig 8: Comparison of Convergence Curves of HWOA and WOA
Table 4.2 Result of the mentioned benchmark functions
Functions HWOA WOA PSO[34] GSA[34] DE[34]
F1 0 7.7059E-80 0.000136 2.5E-16 8.2E-14
F2 7.0196E-299 0.5778E-51 0.042144 0.055655 1.5E-09
F3 7.2955e-19 5.93E-07 70.12562 896.5347 6.8E-11
F4 1.8392 63.0957 1.086481 7.35487 0
F5 7.2499 27.868 96.71832 67.54309 0
F6 0 0.6994 0.000102 82.5E-16 0
F7 0.0041065 0.0016092 0.122854 0.089441 0.00463
4.2
Test Result of Economic load dispatch
Keeping in mind the end goal to confirm the execution and productivity of the power flow improvement on the premise of the proposed hybrid approach, the hybrid approach i.e. WOA-PSO is tried on IEEE 30 bus framework. It has been utilized to tackle the ELD issue in two different experiments for investigating its advancement potential, where the target work was constrained inside power scopes of the generating units, considering transmission losses likewise. The iterations implemented for test framework 1, i.e. three generating units are 250, for test framework 2, i.e. six generating units are 300 and for test framework 3, i.e. thirteen generating units are 1000. In all the test frameworks the quantity of search agents (population) is 40.𝐵𝑚𝑛
=
[image:5.595.309.544.502.631.2]0.000071
0.000030
0.000025
0.000030
0.000069
0.000032
0.000025
0.000032
0.000080
Table 4.3 Generating unit data for Test Case I
Unit a
nb
nc
n𝑃
𝑛𝑚𝑖𝑛𝑃
𝑛𝑚𝑎𝑥1
0.03543 38.30553 1243.531 35
210
2
0.0211
36.3278
1658.569 130
325
3
0.01799 38.2704
1356.659 125
315
4.2.1
Test Framework I
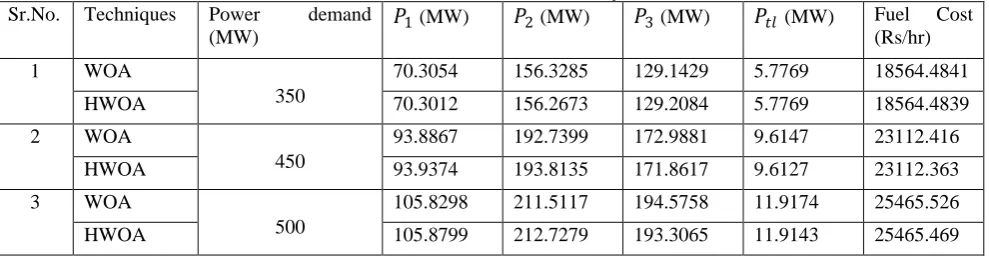
Three generating units Reference [17] gives the loss
coefficient matrix i.e.𝐵𝑚𝑛, and the input information for three
generating units as illustrated in table 4.1. Hybrid approach deciphers the economic load dispatch for three generating units and then the best generation with their respective losses has been compared with WOA. Also the fuel cost of different algorithms which have been applied to the same test
44
Table 4.4 HWOA results for 3-unit system
Sr.No.
Techniques
Power
demand
(MW)
𝑃
1(MW)
𝑃
2(MW)
𝑃
3(MW)
𝑃
𝑡𝑙(MW)
Fuel
Cost
(Rs/hr)
1
WOA
350
70.3054
156.3285
129.1429
5.7769
18564.4841
HWOA
70.3012
156.2673
129.2084
5.7769
18564.4839
2
WOA
450
93.8867
192.7399
172.9881
9.6147
23112.416
HWOA
93.9374
193.8135
171.8617
9.6127
23112.363
3
WOA
500
105.8298
211.5117
194.5758
11.9174
25465.526
[image:6.595.56.530.250.316.2]HWOA
105.8799
212.7279
193.3065
11.9143
25465.469
Table 4.5 Comparison results of fuel cost for 3-unit system
Sr.No.
Power Demand
(MW)
Conventional
Method[9]
Cuckoo
Search
Algorithm[17]
WOA
HWOA
1
350
18570.7
18564.5
18564.4841
1854.4839
2
450
23146.8
23112.4
23112.416
23112.363
3
500
25495.2
25465.5
25465.526
25465.469
4.2.2
Test Framework II
Six generating units
Reference [17] gives the loss coefficient matrix i.e. 𝐵𝑚𝑛, and the input information for sixgenerating units as illustrated in table 4.4. Hybrid approach deciphers the economic load dispatch for six generating units and then the best generation with their respective losses has
[image:6.595.95.473.408.700.2]been compared with WOA. Previously different algorithms have been applied to the same test framework and the fuel cost obtained from the hybrid approach, is contrasted with particle swarm optimization, cuckoo search algorithm and whale optimization algorithm (WOA).
Table 4.6 Generating unit data for Test Case II
Unit
a
nb
nc
n𝑃
𝑛𝑚𝑖𝑛𝑃
𝑛𝑚𝑎𝑥1
0.15240
38.53970
756.79886
10
125
2
0.10587
46.15916
451.32513
10
150
3
0.02803
40.39655
1049.9977
35
225
4
0.03546
38.30553
1243.5311
35
210
5
0.02111
36.32782
1658.5596
130
325
6
0.01799
38.27041
1356.6592
125
315
𝐵𝑚𝑛=
0.000014 0.000017 0.000015 0.000019 0.000026 0.000022 0.000017 0.000060 0.000013 0.000016 0.000015 0.000020 0.000015 0.000013 0.000065 0.000017 0.000024 0.000019 0.000019 0.000016 0.000017 0.000072 0.000030 0.000025 0.000026 0.000015 0.000024 0.000030 0.000069 0.000032 0.000022 0.000020 0.000019 0.000025 0.000032 0.000085
Table 4.7 HWOA results for 6-unit system
Unit
a
nb
nc
n𝑃
𝑛𝑚𝑖𝑛𝑃
𝑛𝑚𝑎𝑥1
0.15240
38.53970
756.79886
10
125
2
0.10587
46.15916
451.32513
10
150
3
0.02803
40.39655
1049.9977
35
225
4
0.03546
38.30553
1243.5311
35
210
5
0.02111
36.32782
1658.5596
130
325
45
Table 4.8 Comparison results of fuel cost for 6-unit system
Sr.No.
Power Demand
(MW)
Conventional
Method [9]
Cuckoo
Search
Algorithm [17]
WOA
HWOA
1
600
32096.58
32094.7
32094.285
32091.135
2
700
36914.01
36912.12
36912.065
36907.007
3
800
41898.45
41896.900
41896.291
41889.571
4.2.3
Test Framework III
Thirteen generating units Reference [17] gives the loss coefficient matrix i.e. 𝐵𝑚𝑛, and the input information for
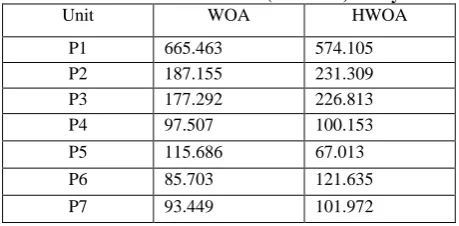
thirteen generating units as illustrated in Table 4.7. The proposed hybrid approach deciphers the economic load dispatch for thirteen generating units delivering power
demand of 1800MW, incorporation with valve point loading effect. Then the best generation has been compared with WOA, PSO and CSO. Also the fuel cost of different algorithms which had been applied to the same test
[image:7.595.56.267.201.391.2]framework is contrasted with obtained results from the hybrid approach.
[image:7.595.323.526.241.402.2]Fig 9: Convergence graphs of test framework II 800MW
Table 4.9 Generating unit data for Test Case III
Fig 10: Convergence graphs of test framework III 1800MW
Unit an bn cn dn en 𝑃𝑛𝑚𝑖𝑛 𝑃𝑛𝑚𝑎𝑥
1
0.0002
8
8.1 550
300
0.03
5
00
680
2
0.0005
6
8.1 309
200
0.04
2
00
360
3
0.0005
6
8.1 307
200
0.04
2
00
360
4
0.0032
4
7.7 240
150
0.06
3
60
180
5
0.0032
4
7.7 240
150
0.06
3
60
180
6
0.0032
4
7.7 240
150
0.06
3
60
180
7
0.0032
4
7.7 240
150
0.06
3
60
180
8
0.0032
4
7.7 240
150
0.06
3
60
180
9
0.0032
4
7.7 240
150
0.06
3
60
180
10
0.0028
4
8.6 126
100
0.08
4
40
120
11
0.0028
4
8.6 126
100
0.08
4
40
120
12
0.0028
4
8.6 126
100
0.08
4
55
120
13
0.0028
4
8.6 126
100
0.08
4
55
120
5.
CONCLUSION
[image:7.595.48.276.428.768.2]In this audit paper distinctive algorithms, including recently created Cuckoo search algorithm (CSO), Invasive Weed Optimization (IWO), Whale optimization algorithm (WOA) have been connected for the arrangement of ELD problem for enhanced execution. In spite of the fact that these algorithms had effectively tackled the ELD problem yet advance enhancements to the calculations were required. Along these a recently created hybrid whale optimization algorithm has been successfully realized as a part of this paper with the end goal of taking care of ELD issue. In the above tables, three, six and thirteen generating units with comparable cost capacities and generator limitations have been contemplated. The efficacy of the suggested technique can be concluded from the outcomes contrasted with other recent strategies stated above. Despite the fact that the proposed algorithm has been effectively utilized in the ELD issue with valve-point impact, its outcome may differ in future when practical ELD problem is considered with prohibited operating zones and multiple fuels.
Table 4.10 HWOA results for 13 (1800MW)unit system
Unit WOA HWOA
P1 665.463 574.105
P2 187.155 231.309
P3 177.292 226.813
P4 97.507 100.153
P5 115.686 67.013
P6 85.703 121.635
[image:7.595.309.539.646.759.2]46
P8 68.759 97.468
P9 74.058 72.737
P10 71.437 40.628
P11 41.172 40.000
P12 55.000 55.000
P13 67.315 71.162
Total Generation Cost(Rs/hr)
[image:8.595.47.279.75.184.2]17976.131 17951.304
Table 4.11 Comparison of fuel cost for different methods
Sr.
No
Method
Best Cost(Rs/hr)
1.
FEP[22]
18018.00
2.
IFEP[22]
17994.07
3.
IWO[35]
17968.00
4.
WOA
17976.13
5.
HWOA
17951.30
6.
REFERENCES
[1] Youssef, H. K., and El-Naggar, K. M., "Genetic based algorithm for security constrained power system economic dispatch", Electric Power Systems Research, Vol.53 No.1(2000): 47-51.
[2] Kennedy J and Eberhart R, “Particle swarm optimization” in Proc. IEEE Int. Conf. Neural Networks (ICNN’95), Vol. 4, Perth, Australia,(1995):1942–1948.
[3] Kumar S, Naresh R.,"Nonconvex economic load dispatch using an efficient real-coded genetic algorithm" Applied Soft Computing, Vol.9 No.1(2009): 321–329.
[4] Nasimul Nomana, Hitoshi Iba, "Differential evolution for economic load dispatch problems", Electric Power Systems Research, Vol.78, No.8 (2008): 1322-1331.
[5] Walters C. David, Sheble B. Gerald," Genetic Algorithm solution of Economic dispatch with valve point loading", IEEE Transactions on Power Systems, Vol 8, No.3 (1993): 1325-1332.
[6] Lin W. M., Cheng F. S. and Tsay M. T, “An improved Tabu search for economic dispatch with multiple minima”, IEEE Trans. on Power Systems, Vol.17 No.1 (2002): 108-112.
[7] Giang Zwe-Lee, "Particle Swarm Optimization to solving the Economic Dispatch Considering the Generator Constraints" IEEE Transactions on Power Systems, Vol.18 No.3 (2003): 1187-1195
[8] M.S. Yohannes, Junaidi “Solving Economic Dispatch Problem using Particle swarm optimization technique” I.J Intelligent system and Applications (2012): 12-18. [9] Saber A. Y., & Venayagamoorthy G. K. "Economic load
dispatch using bacterial foraging technique with particle swarm optimization biased evolution" IEEE In Swarm Intelligence Symposium", Vol.4 No.2 (2008): 1-8. [10] Bhattacharya A, and Chattopadhyay P.K. "Solving
complex economic load dispatch problems using biogeography-based optimization." Expert Systems with Applications Vol.37 No.5 (2010): 3605-3615.
[11] Mahdi Bidar, Edris Fattahi and Hamidreza Rashidy Kanan. “Krill herd: A new bio-inspired optimization algorithm”
Communication In Non Linear Science And Numerical Simulation Vol.17 No. 12(2012): 4831-4845.
[12] Mahdi Bidar, Edris Fattah and Hamidreza Rashidy Kanan. “Modified Krill Herd Optimization Algorithm using Chaotic Parameters” International conference on Computer and Knowledge Engineering (2014) : 420-424.
[13] Shayeghi, H., & Ghasemi, A."A modified artificial bee colony based on chaos theory for solving non-convex emission/economic dispatch" Energy Conversion and Management(ELSEVIER), Vol.79 (2014): 344-354. [14] Yang X.H, Hosseini S.S.S, and A.H Gandomi. "Firefly
algorithm for solving non-convex economic dispatch problems with valve loading effect." Applied Soft Computing(ELSEVIER), Vol.12 No.3(2012): 1180-1186. [15] Abdelaziz A. Y., Mekhamer S. F., Badr M.A.L., Algabalawy M. A., "The Firefly Meta-Heuristic Algorithms: Developments and Applications", International Electrical Engineering Journal (IEEJ), Vol. 6 No. 7(2015): 1945-1952.
[16] Chen G, & Ding X,"Optimal economic dispatch with valve loading effect using self-adaptive firefly algorithm" Applied Intelligence, Vol.42 No.2 (2015): 276-288. [17] Bindu, Hima A., and Reddy M.D. "Economic Load
Dispatch Using Cuckoo Search Algorithm." International Journal Of Engineering Research and Applications, Vol.4 No.3 (2013): 498-502.
[18] Tran C. D, Dao T. T, & Nguyen T. T. "Economic Load Dispatch with Multiple Fuel Options and Valve Point Effect Using Cuckoo Search Algorithm with Different Distributions" International Journal of Hybrid Information Technology, Vol.8 No.1(2015): 305-316.
[19] Afzalan, E., and Joorabian, M. "An improved cuckoo search algorithm for power economic load dispatch" International Transactions on Electrical Energy Systems, Vol.25 No.6 (2015), 958–975.
[20] Touma J Haider,"Study of the Economic Load dispatch on IEEE-30 Bus System using Whale Optimization algorithm" International Journal of Engineering Technology and Sciences(IJETS) Vol.5 No.1(2016): 11-18.
[21] A.V.Phani Pavan, S.Nagarjuna, Dr.A.Srinivasa Reddy, "Economic Dispatch with Valve Point Loading Effect Using Whale Optimization Algorithm" International Journal of Professional Engineering Studies Vol.8 No.3(2017): 283-289.
[22] Sinha N, Chattopadhyay P.K,"Evolutionary Programming Techniques for Economic Load Dispatch" IEEE Transactions on Evolution Computation, Vol.7, No.1(2003): 83-94.
[23] Manteaw D Emmanuel, Odero A Nicodemus,"Combined Economic and Emission Dispatch Solution using ABC-_PSO Hybrid Algorithm with Valve Point Loading Effect", International Journal of Scientific and Research Publications(IJSRP), Vol.2, No. 12(2012): 2250-3153. [24] Gupta T, Pandit Manjaree,"PSO-ANN for Economic Load
47 optimization algorithm and pattern search technique for
optimal power flow problem" IEEE International conference on modelling, identification and control(ICMIC-2016),:1048-1053.
[26] Victoire T.A.A, Jeykumar A.E, "Hybrid PSO-SQP for economic dispatch with valve-point effect" Electrical Power System Research(ELSEVIER) Vol.71 No.1(2004): 51-59.
[27] Coelho L.S, Mariani V.C, "Combining of Chaotic differential evolution and quadratic programming for economic dispatch optimization with valve-point loading effect" IEEE Transactions on Evolution Computation, Vol.21 No.2(2006): 989-996.
[28] Wang S.K, Chiou J.P, Liu C.W, "Non-smooth/non-convex economic dispatch by a novel hybrid differential evolution algorithm" IET Generation Transmission and Distribution, Vol.1 No.5 (2007): 793-803.
[29] Panigrahi B.K, Pandi V.R, "Bacterial foraging Hybrid optimization for economic load dispatch" IET Generation Transmission and Distribution, Vol.2 No.4(2008): 556-565. [30] Wood AJ, Wollenberg BF:"Power Generation, Operation
and Control", 2nd edition Wiley, (1996) New York.
[31] Karthikeyan S.P, Palanisamy l K , Varghese L.J, Kothari D.P "Comparison of Intelligent Techniques to Solve Economic Load Dispatch Problem with Line Flow Constraints" IEEE International Advance Computing Conference (2009): 446-452.
[32] Park Jong-Bae, Lee Ki-Song, Shin Joong-Rin, Lee Y Kwang, "A Particle Swarm Optimization for Economic Dispatch With Non-smooth Cost Functions", IEEE Transactions on Power System, Vol.20 No.1(2005): 35-42. [33] Hosseini, S. S. S., Yang, X. S., Gandomi, A. H., & Nemati, "A. Solutions of non-smooth economic dispatch problems by swarm intelligence" In Adaptation and Hybridization in Computational Intelligence Vol.18 No.4 (2015). 129-146.
[34] Mirjalili S, Lewis A, "The Whale Optimization Algorithm" Advances in Engineering Software(ELSEVIER) Vol.95 (2016) : 51-67.
[35] Rama Prabha D, Jayabarathi T, Mageshvaran R, Vudutala R Bhardwaj, "Invasive weed Optimization for Economic Dispatch with Valve point Effects", Journal of Engineering Science and Technology(JEST) Vol.11 No.2(2016): 237-251.
![Fig 2: Bubble-net feeding method of humpback whales[34]](https://thumb-us.123doks.com/thumbv2/123dok_us/9296343.427206/2.595.55.298.537.672/fig-bubble-net-feeding-method-humpback-whales.webp)
![Fig 3: Shrinking encircling mechanism[34]](https://thumb-us.123doks.com/thumbv2/123dok_us/9296343.427206/3.595.63.248.316.481/fig-shrinking-encircling-mechanism.webp)