ESR study on fullerene C60 radical cation Section A-Research paper
LONG TERM STUDY OF FULLERENE C
60+•RADICAL CATION
BY ELECTRON SPIN RESONANCE (ESR)
Franco Cataldo*
[a,b]and Susana Iglesias-Groth
[c]Keywords: electron spin resonance, radical cation, fullerene C60, oleum, near infrared spectroscopy, kinetics
The dissolution of fullerene C60 in oleum (fuming sulphuric acid 20 % free SO3) was followed simultaneously with ESR (Electron Spin
Resonance) and NIR (Near Infrared Spectroscopy). It is shown that the intensity of the ESR signal associated to the formation of C60
radical cation (C60+•) follows the same kinetics as the NIR absoption band at about 938 nm. Thus, the band at about 938 nm represents the
optical counterpart of the ESR signal of C60+•. After the formation of C60+•, the evolution of the ESR spectrum and its optical counterpart in
the NIR suggest the formation of other fullerene oxidation products as well. These products were recovered from the oleum solution and analyzed with FTIR and found to be fullerol (hydroxylated derivative of fullerene). The work-up of the oleum solution led to the desulfonation of the substrate. The ESR signal of C60+• in oleum was followed for two weeks. Even after so long time, the ESR signal
appeared strong and clear although under slow decay. Thus, the oxidation species of C60+• (polycations, dimers and oligomers of C60,
sultonated and sulfated derivatives) are persistent radicals in oleum.
* Corresponding Author
E-Mail: [email protected]
[a] Actinium Chemical Research srl, Via Casilina 1626A, 00133 Rome, Italy
[b] INAF – Osservatorio Astrofisico di Catania, Via S. Sofia 78, 95123 Catania, Italy
[c] Instituto de Astrofisica de Canarias, Via Lactea snc, Tenerife, Canary Islands, Spain
Introduction
Fullerene C60 is widespread in the Universe1 as
demonstrated by recent discoveries essentially based on the detection of infrared emission bands of this molecule.2-4 The
detection of fullerene in young planetary nebulae and in other astrophysical environments as well as the quantification of its relative abundance in space was made possible thanks to the laboratory studies made on the infrared spectrum of C60, on its derivatives and on the
determination of the molar extinction coefficients and integrated molar absorptivities.6-13
Although C60 has been detected in the infrared in space, its
detection in the ultraviolet and in the visible part of the spectrum has not yet been achieved for a number of reasons, including the fact that, especially in the ultraviolet, there are a number of different “carriers” emitting in that spectral region, covering the possible “spectral signature” of C60. On
the other hand, it is known that C60 in the interstellar
medium should be ionized into its radical cation form: C60+•.1,14 The ionization mechanism involves the extraction
of one electron from the C60 molecule by the action of
cosmic rays and it is favored by the relatively low first ionization potential of C60 (Ei=7.61 eV). The electronic
absorption (and emission) spectrum of C60+• is characterized
by the presence of electronic transitions in the near infrared, a spectral region relatively less crowded by the interference of other molecules than in the ultraviolet. In a previous work, we have determined the molar extinction coefficient of the C60+•.15 The radical cation bands are characterized by a
molar extinction coefficient ε823 = 7500 L cm-1 mol-1 and
ε943 = 4570 L cm-1 mol-1.15
The most typical approach for the synthesis of C60+•
involves the high energy irradiation of neutral C60 trapped in
frozen matrix of helium or neon.16-19 The advantage of this
technique regards the minimization of the so-called “matrix effect” which involves a band shift due to the interaction of the guest molecule with the host matrix. Helium and neon are completely inert matrices and the interaction with the guest radical cation is considered negligible. On the other hand, another approach used to generate radical cations in laboratory involves the use of a superacid medium.20 The
most popular superacid is fuming sulfuric acid (oleum) as solvent and oxidizing medium.21-30 Alternatively triflic acid
and an oxidant22 or other sophisticated superacids were used
successfully.31,32
Although the use of superacids as medium for the generation of the radical cations is more practical, there is the problem that the strong interaction of the radical cation with the superacid medium may cause important band shift of the radical cation band transitions in the near infrared and also a limited lifetime of the in situ generated radical cation specie.15,22,23,31 However, as discussed by us in a earlier
paper15 and as summarized in a review,31 at least for the
C60+• the band shift in the optical spectra by passing from He
or Ne matrix to a superacid medium is really small and could be considered as negligible.
The optimal approach for the study of the radical cation species is always the combination of the optical spectroscopy with the electronic paramagnetic resonance (EPR) or electron spin resonance (ESR) spectroscopy. The confirmation of the formation of the radical cation derives exclusively from the ESR signal to which it is associated the optical counterpart in the visible or in the near infrared. Indeed, the first work on C60+• in oleum was made with ESR
spectroscopy.21 Only later, the C
60+• in oleum was analyzed
by optical spectroscopy.22 However, also in recent works
quite rarely the ESR spectroscopy was applied to C60+•
simultaneously with the near infrared (NIR)
ESR study on fullerene C60 radical cation Section A-Research paper
The present paper is dedicated to the simultaneous investigation of C60+• in oleum both with ESR and NIR. The
investigation is not limited to the early minutes of interaction of C60 with oleum but it was prolonged for
several days after the fullerene dissolution and oxidation with the purpose to verify the stability of C60+• in oleum and
eventually to detect its dimerization reaction25-29 as well as
further reactions with the host matrix which involve sultonation and sulfation reactions.
Experimental
Materials and Equipment
C60 was obtained from Aldrich (USA) and was 99.5%
pure. Oleum (fuming sulphuric acid) 20 % free SO3 and was
obtained from Sigma-Aldrich (Germany).
The near infrared spectra were recorded on Nicolet 6700 FT-NIR spectrometer from Thermo Scientific using a CaF2
beam splitter. The oleum solution of C60 was analyzed in a
conventional quartz cuvette having 5 mm path length and sealed with a Teflon stopper.
The mid-FT-IR spectra were recorded on KBr pellets Nicolet 6700 FT-IR spectrometer from Thermo Scientific using a KBr beamsplitter.
The ESR spectra were obtained on a X-band spectrometer from Active Spectrum model Micro-ESR using 2 mm internal diameter quartz capillaries. Each spectrum recorded was the average of 20 scans.
Preparation of the C60 solution in oleum
Fullerene C60 (8.8 mg) was quickly shaken with oleum (7
g) in a flask with stopcock. After 1 min shaking the heterogeneous solution was pipetted into the ESR capillary tube and the first spectra recorded immediately after the necessary tuning operations of the spectrometer. Simultaneously, the same C60 solution in oleum was also
studied with the FT-IR spectrometer in the near infrared spectral region.
Recovery of C60 oxidation products from oleum
After 15 days of preparation, the above mentioned solution of C60 in oleum was poured into 100 ml of distilled
water, stirred and left to settle. A brown-orange precipitate was deposited at the bottom of the flask. The water was decanted and new distilled water was added, the mixture was stirred and decanted until neutrality was reached as measured with the pH test paper. Water was decanted again and the residual water was evaporated in a water bath at 80 °C until dryness. About 10 mg of brown-orange product was recovered and studied with FT-IR spectroscopy.
Results and Discussion
Near Infrared (NIR) spectra of C60+•
The NIR spectra of C60+• were already shown and
discussed in earlier works.15,22,23 Fig. 1 and 2 show the NIR
spectra of C60+• as recorded with the FT-NIR. The spectra
are substantially analogous to those recorded in a conventional spectrophotometer. The novelty in the present case is the spectral range covered from 800 to 2000 nm while in the previous works the spectral range analyzed was from 190 to 1100 nm.15,22,23 However, no additional features
were detected above 1100 nm attributable to C60+•.
Figure 1. FT-NIR spectrum of C60+• in oleum. The spectra were
recorded in the first hour after mixing and are characterized by a steady growth in intensity as shown by the arrow pointing upward.
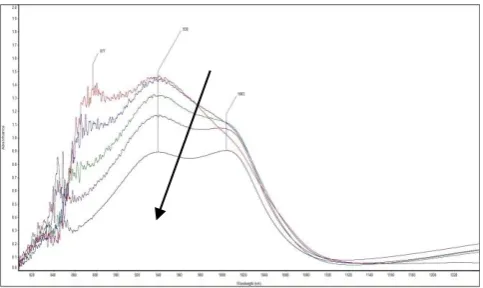
Figure 2. FT-NIR spectrum of C60+• in oleum. The spectral
evolution till 5 h after mixing show now a steady decrease in intensity as indicated by the arrow pointing downward. However, after 5 h the two bands at 938 nm and 1003 nm result stable for very long time.
ESR study on fullerene C60 radical cation Section A-Research paper
The broad band at 970 nm is now decreasing in intensity and can be found at about 938 nm. There is another band at about 1003 nm which is developed at later stages reaching approximately the same intensity of the band at 938 nm. The overall spectral changes are completely in line with earlier results. 15,22,23
Electron Spin Resonance (ESR) spectra of C60+•
As soon as mixed with oleum C60 gradually dissolves into
the guest matrix giving a green solution. The ESR signal of C60+• can be recorded immediately after mixing as shown in
Fig. 3 and the signal grows in intensity for at least the first hour after mixing. Fig. 4 shows the kinetics of growth of the peak-to-peak amplitude of the ESR signal in comparison to the kinetics of optical counterpart recorded in the NIR at about 938 nm and at about 850 nm. In Fig. 4, it is evident that the kinetics of the absorption band at about 938 nm overlaps with the ESR signal, while the other band at about 850 nm is following another destiny. Therefore, the absorption band at about 938 nm must be necessarily assigned to the C60+• while the other band at about 850 nm is
instead due to charge-transfer interactions with the solvent as it was previously supposed.15,22,23
Magnetic field, Gauss
Figure 3. ESR spectra of C60 in oleum. The smaller signal was
taken 1 min after mixing and the largest signal after 130 min
Fig. 4 provides for the first time the unambiguous assignment of the NIR band at about 938 nm to C60+• and the
attribution of the other band at about 850 nm to initial charge-transfer interaction phenomena of C60 with the
superacid at the beginning of the dissolution. With this interpretation it can be affirmed that at room temperature the C60 dissolution in oleum is completed in about 1h.
In Fig. 4 the optical absorption data in the NIR were plotted as ln[(Abs)/(Abs)0] against time, where (Abs) is the
absorption at a given wavelength taken at any time and (Abs)0 is the absorption at the same wavelength taken at the
beginning of the experiment. Similarly, in Fig. 4 the peak-to-peak amplitude of the ESR signal was plotted as ln[(ESR)/(ESR)0] against time, where (ESR) is the
peak-to-peak amplitude of the ESR signal taken at any time and (ESR)0 is the peak-to-peak amplitude of the ESR signal
taken at the beginning of the experiment.
Figure 4. Kinetics of the ESR signal growth in the first two hours after mixing (blue diamonds) and the kinetics of the optical counterpart spectra measured in the NIR. It is evident that the kinetics of the band at about 938 nm (red squares) is practically the same as that of the ESR signal, while the other band at about 850 nm (green triangles) is following another destiny.
The first ESR spectrum of C60+• taken and reported in Fig.
3 shows a g value of 2.08632 while the latest spectrum recorded after 2 h shows a g value of 1.90344. The main line width of the first ESR spectrum of Fig.3 is 7.8 G and it becomes narrower 4.7 G after 2 h. The line width of the other smaller signal in the left of the main signal are respectively 5.1 and 6.0 G in the first ESR spectrum recorded. The zero-field parameters |D| and |D/2| as defined by Tumanskii et al.27 were found at 45.24 and 23.37 G
respectively. After 2h the |D| and |D/2| parameters were still found at 44.9 and 22.2 G. The ESR spectra of C60 in oleum
were interpreted in terms of radical cation formation followed by further oxidation which leads to the trication and pentacation.21 A series of deeper investigations has
instead suggested that the radical cation of C60 tends
dimerize and and oligomerize in oleum leading to the formation of C120O+ and C120O2+.25-29 However, such
dimerization/oligomerization reaction occurs when large amounts of C60 are dissolved in oleum. Solodovnikov
showed that the line width of C60+• when generated in a
mixture of toluene/sulphuric acid is about 7 G, was very close to the 7.8 G line width value found in our earlier spectrum (Fig. 3) recorded immediately after the initial dissolution of C60 in oleum.25,27
Figure 5. ESR spectra of C60 in oleum. The largest signal is the
ESR study on fullerene C60 radical cation Section A-Research paper
Till now, nobody has followed the ESR of C60 solution in
oleum sealed in a capillary quartz tube for a long time. After the initial green-grey color, the C60 solution in oleum turns
gradually into orange-brown. Fig. 5 shows the ESR spectra of such solution at 40 and 110 h after preparation. Surprisingly after 40 h and beyond, the ESR spectra appear shifted about -11.3 G from the original position. The g factor is now 2.09184 and the main line width is now 3.76 G, thus the signal is narrower than that of the “fresh” sample. The changes of the ESR parameters may suggest that we are dealing with other reaction products. The optical counterpart of the long term experiment of C60 in oleum is shown in Fig.
6. The NIR spectrum after 5 days from preparation still shows the absorption bands attributed to C60+• at 920 and
1003 nm. However two new absorption bands at 703 and 775 nm can be observed in Fig. 6 and assigned to other species than C60+•.
Figure 6. NIR spectrum of C60 in oleum after 5 days from
preparation.
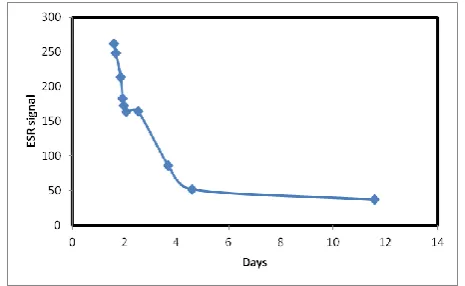
The long term evolution and decay of the ESR signal (peak-to-peak amplitude) can be followed in Fig. 7. Even after two weeks from the beginning of the experiment the ESR signal is still clearly detected (see also Fig. 5). Fig. 7 suggests that the ESR signal (although weak) could be detected even after 1 month after the preparation.
Figure 7. Long term evolution of the ESR signal of C60 in oleum.
FT-IR spectroscopy of the C60 oxidation product recovered from oleum
When the C60 solution in oleum is poured into an excess
of water a brown-orange insoluble precipitate is obtained.24,28,29,35 It is necessary to wash carefully with water
to neutrality the precipitate to remove the contamination of residual sulfuric acid.28,29 The resulting FT-IR spectrum of
our sample is shown in Fig. 8 and it is partly similar to that
shown by other authors.28 However, the spectrum of Fig. 8
resembles that of fullerol which is characterized by three main bands at 1595, 1385 and 1085 cm-1.35 Indeed, the
spectrum of Fig. 8 shows three main broad infrared bands at
1626, 1381, 1076 cm-1. This implies that
sultonation/sulfation of C60 in oleum was a minor reaction.
Figure 8. FTIR spectrum of C60 oxidation product recoverd from
oleum solution
However, Taylor has proposed that the sulfonation followed by hydrolysis leads to fullerol with an almost complete removal of the SO3H groups.35 The presence of
oxygenated sulfur functionalities in the infrared spectrum can be deduced from the S-O stretching in the asymmetric (1320-1390 cm-1) and in the symmetric mode (1150-1200
cm-1).36 Fig. 8 is lacking completely the asymmetric
stretching mode of S-O group ruling out any important presence of the oxygenated sulfur functionalities. Thus, the precipitate recovered from C60 oleum solution is indeed
fullerol. The eventual dimeric/oligomeric structure of this product, as suggested by other authors,28,29 cannot be
established on the sole basis of the infrared spectra.
Conclusions
The most important result of the present work is the discovery that the peak-to-peak amplitude of the ESR signal associated to C60+• formed in oleum, grows in intensity with
the same kinetic law followed by the optical NIR counterpart band at about 938 nm as shown in Fig. 4. Based on these results it is obvious to associate the 938 nm band with the radical cation of C60 species. The other band at
about 850 nm observed in the NIR spectrum at the beginning of the dissolution of C60 in oleum is correctly
assignable to a charge-transfer interaction of C60 with oleum
in the early stages of its dissolution as already stated previously.15,22,23
The formation of C60+• in the first hours of dissolution of
C60 in oleum is also confirmed by the line width of the ESR
spectrum which corresponds to that already reported in literature for this species.25,27
The long term interaction (days) of C60+• with oleum
causes a shift of the ESR spectrum and changes in the line widths of the spectrum. It is evident that this is due to further reactions of C60+• with oleum which can lead to the
formation of polycations21 or to the formation of oligomers
ESR study on fullerene C60 radical cation Section A-Research paper
second hypothesis is corroborated by a quite extensive body of works but does not exclude also the first hypothesis. C60+•
or its further oxidation product may undergo in the long term sultonation and sulfation reactions.33-35 This fact is
completely reasonable and expected. Less obvious is the absence of evidences of the S-O symmetric stretching band in the FT-IR spectrum of the C60 oxidation product
recovered from the oleum solution. According to Taylor,35
the sulfur-bearing functionalities are released by hydrolysis during the work-up leading to the formation of a fullerol as indeed is suggested by the FT-IR spectrum of Fig. 8.
Even after 2 weeks of the preparation of the C60 solution
in oleum it is possible to detect a strong and clear ESR signal from the solution. This means that the species derived from C60+• further oxidation (polications, oligomers and
sultonated/sulfated derivatives) are then quite stable in oleum. The NIR spectrum after 5 days from preparation still displays the absorption band at 920 nm associable to the C60+•. This band is however accompanied by other bands
which may account for the presence of other species (see Fig. 6).1
References
1Kwok, S. “Organic Matter in the Universe”, 2012, Wiley-VCH,
Weinheim, Germany.
2Cami, J., Bernard-Salas, J., Peeters, E., Malek, S. E. Science, 2010, 329, 1180.
3García-Hernández, D. A. Iglesias-Groth, S., Acosta-Pulido, J. A.
Manchado, A., García-Lario, P., Stanghellini, L., Villaver, E., Shaw, R. A. and Cataldo, F., Astrophys. J., 2011, 737, L30.
4García-Hernández, D. A., Villaver, E., García-Lario, P.,
Manchado, A., Stanghellini, L., Shaw, R. A. and Cataldo, F., 2012, Astrophys. J., 2012, 760, 107.
5Sellgren, K., Werner, M. W., Ingalls, J. G., Smith, J. D.
T.,Carleton, T. M., and Joblin, C., Astrophys. J. Lett., 2010,
722, L54.
6Cataldo, F., Iglesias-Groth, S. Monthly Notices Roy. Astronom. Soc., 2009, 400, 291.
7Cataldo, F., Iglesias-Groth, S., “Fulleranes: The Hydrogenated Fullerenes”, 2010, Springer, Dordrecht.
8Cataldo, F., Iglesias-Groth, S., Manchado, A., Fullerenes Nanotubes, Carbon Nanostruct., 2009, 17, 378
9Cataldo, F., Iglesias-Groth, S., Manchado, A., Fullerenes Nanotubes, Carbon Nanostruct., 2009, 17, 401.
10Cataldo, F., Iglesias-Groth, S., Manchado, A., Fullerenes Nanotubes, Carbon Nanostruct., 2009, 17, 414.
11Cataldo, F., Iglesias-Groth, S., Manchado, A., Fullerenes Nanotubes, Carbon Nanostruct., 2009, 17, 428.
12Cataldo, F., Iglesias-Groth, S., Manchado, A., Fullerenes Nanotubes, Carbon Nanostruct., 2012, 20, 672.
13Cataldo, F., Iglesias-Groth, S., Manchado, A., Fullerenes Nanotubes, Carbon Nanostruct.2012, 20, 656.
14Foing, B. H. and Ehrenfreund, P., Nature, 1994, 369, 296. 15 Cataldo, F., Iglesias-Groth, S., Hafez, Y. Eur. Chem. Bull., 2013,
2, 1013.
16Kato, T., Kodama, T., Shida, T., Nakagawa, T., Matsui, Y.,
Suzuki, S., Shiromaru, H., Yamauchi, K., Achiba, Y.,
Chem.Phys. Lett., 1991, 180, 446.
17Gasyna, Z., Andrews, L., Schatz, P. N., J. Phys. Chem., 1992, 95,
1525
18Fulara, J., Jakobi, M., Maier, J. P., Chem. Phys. Lett., 1993, 211,
227.
19Fulara, J., Jakobi, M., Maier, J. P., Chem. Phys. Lett., 1993, 206,
208.
20Olah, G. A., Surya Prakash, G. K., Sommer, J., “Superacids”, 1985, Wiley, New York.
21Kukolich, S. G., Huffman, D. R., Chem. Phys. Lett., 1991, 182,
263.
22Cataldo, F. Spectrochim. Acta Part A: Mol. Biomol. Spectrosc., 1995, 51, 405.
23Cataldo, F., Iglesias-Groth, S., Manchado, A., Fullerenes Nanotubes. Carbon Nanostruct., 2012, 20, 656.
24Scharff, P., Bischof, W., Ebinal, S., Ehrhardt, C., Gerken, R.,
Kaiser, V., Menzel, F., Tanke, C., Carbon, 1994, 32, 709.
25 Solodovnikov, S. P. Russ. Chem. Bull.,1998, 47, 2302.
26Solodovnikov, S. P., Tumanskii, B. L., Bashilov, V. V., Sokolov,
V. I., Lebedkin, S. F., Kratschmer, W., Chem. Phys. Lett.,
1999, 303, 387.
27Tumanskii, B., Kalina, O. “Radical Reactions of Fullerenes and
their Derivatives”, 2001, Kluwer Academic Publishers, Dordrecht pp 164-171.
28Garkusha, O.G., Solodovnikov, S. P., Lokshin, B. V., Russ. Chem. Bull.,2002, 51, 628.
29Garkusha, O. G., Solodovnikov, S. P., Lokshin, B. V., Russ. Chem. Bull.,2003, 52, 1688.
30Cataldo, F., Iglesias-Groth, S., Manchado, A., Spectrochim. Acta Part A: Mol. Biomol. Spectrosc., 2010, 77, 998.
31Reed C. A., Bolskar, R. D., Chem. Rev., 2000, 100, 1075. 32Reed, C. A., Kim, K. C., Bolskar, R. D., Mueller L. J., Science,
2000, 298, 101.
33Miller, G. P., Buretea, M. A., Bernardo, M. M., Hsu, C. S., and
Fang, H. L. J. Chem. Soc., Chem. Commun., 1994, 1549.
34Canteenwala, T., Patil, S., and Chiang, L. Y., Synth. Comm., 2001, 31, 1659.
35Taylor, R., 1999, “Lecture Notes on Fullerene Chemistry. A Handbook for Chemists”, Imperial College Press,
London, .117-121.
36Lin-Vien, D., Colthup, N. B., Fateley, W. G., Grasselli, J. G.,
“Infrared and Raman Characteristic Frequencies of Organic Molecules”, Academic Press, San Diego, 1991, 245