Molecular Profiling Reveals Biologically Discrete
Subsets and Pathways of Progression in Diffuse
Glioma
Graphical Abstract
Highlights
d
Comprehensive molecular profiling of 1,122 adult diffuse
grade II, III, and IV gliomas
d
Telomere length and telomere maintenance defined by
somatic alterations
d
DNA methylation profiling reveals subtypes of IDH mutant
and IDH-wild-type glioma
d
Integrated molecular analysis of progression from low-grade
to high-grade disease
Authors
Michele Ceccarelli, Floris P. Barthel,
Tathiane M. Malta, ..., Houtan Noushmehr,
Antonio Iavarone, Roel G.W. Verhaak
Correspondence
[email protected] (H.N.),
[email protected] (A.I.),
[email protected] (R.G.W.V.)
In Brief
Molecular Profiling Reveals Biologically
Discrete Subsets and Pathways
of Progression in Diffuse Glioma
Michele Ceccarelli,1,2,24Floris P. Barthel,3,4,24Tathiane M. Malta,5,6,24Thais S. Sabedot,5,6,24Sofie R. Salama,7 Bradley A. Murray,8Olena Morozova,7Yulia Newton,7Amie Radenbaugh,7Stefano M. Pagnotta,2,9Samreen Anjum,1 Jiguang Wang,10Ganiraju Manyam,3Pietro Zoppoli,10Shiyun Ling,3Arjun A. Rao,7Mia Grifford,7Andrew D. Cherniack,8 Hailei Zhang,8Laila Poisson,11Carlos Gilberto Carlotti, Jr.,5,6Daniela Pretti da Cunha Tirapelli,5,6Arvind Rao,3
Tom Mikkelsen,11Ching C. Lau,12,13W.K. Alfred Yung,3Raul Rabadan,10Jason Huse,14Daniel J. Brat,15
Norman L. Lehman,16Jill S. Barnholtz-Sloan,17Siyuan Zheng,3Kenneth Hess,3Ganesh Rao,3Matthew Meyerson,8,18 Rameen Beroukhim,8,18,19Lee Cooper,15Rehan Akbani,3Margaret Wrensch,20David Haussler,7Kenneth D. Aldape,21 Peter W. Laird,22David H. Gutmann,23TCGA Research Network, Houtan Noushmehr,5,6,25,*Antonio Iavarone,10,25,* and Roel G.W. Verhaak3,25,*
1Qatar Computing Research Institute, Hamad Bin Khalifa University, Doha P.O. box 5825, Qatar 2Department of Science and Technology, University of Sannio, Benevento 82100, Italy
3Department of Genomic Medicine, Department of Bioinformatics and Computational Biology, Department of Biostatistics, Department of Neuro-Oncology, Department of Neurosurgery, Department of Pathology, University of Texas MD Anderson Cancer Center, Houston, TX 77030, USA
4Oncology Graduate School Amsterdam, Department of Pathology, VU University Medical Center, 1081 HV Amsterdam, the Netherlands 5Department of Genetics (CISBi/NAP), Department of Surgery and Anatomy, Ribeira˜o Preto Medical School, University of Sa˜o Paulo, Monte Alegre, Ribeira˜o Preto-SP CEP: 14049-900, Brazil
6Center for Integrative Systems Biology (CISBi, NAP/USP), Ribeira˜o Preto Medical School, University of Sa˜o Paulo, Ribeira˜o Preto, Sa˜o Paulo 14049-900, Brazil
7UC Santa Cruz Genomics Institute, University of California, Santa Cruz, Santa Cruz, CA 95064, USA
8The Eli and Edythe L. Broad Institute of Massachusetts Institute of Technology and Harvard University, Cambridge, MA 02142, USA 9BIOGEM Istituto di Ricerche Genetiche ‘‘G. Salvatore,’’ Campo Reale, 83031 Ariano Irpino, Italy
10Department of Neurology, Department of Pathology, Institute for Cancer Genetics, Department of Systems Biology and Biomedical Informatics, Columbia University Medical Center, New York, NY 10032, USA
11Henry Ford Hospital, Detroit, MI 48202, USA 12Texas Children’s Hospital, Houston, TX 77030, USA 13Baylor College of Medicine, Houston, TX 77030, USA
14Memorial Sloan Kettering Cancer Center, New York, NY 10065, USA 15Winship Cancer Institute, Emory University, Atlanta, GA 30322, USA
16Department of Pathology, The Ohio State University, Columbus, OH 43210, USA
17Case Comprehensive Cancer Center, Case Western Reserve University, Cleveland, OH 44106, USA 18Department of Medical Oncology, Dana-Farber Cancer Institute, Boston, MA 02215, USA
19Department of Medicine, Harvard Medical School, Boston, MA 02215, USA
20Department of Neurological Surgery, University of California, San Francisco, San Francisco, CA 94158, USA 21Princess Margaret Cancer Centre, Toronto, ON M5G 2M9, Canada
22Van Andel Research Institute, Grand Rapids, MI 49503, USA
23School of Medicine, Washington University, St. Louis, MO 63110, USA 24Co-first author
25Co-senior author
*Correspondence:[email protected](H.N.),[email protected](A.I.),[email protected](R.G.W.V.)
the progression from low- to high-grade disease.
Whole-genome sequencing data analysis
deter-mined that
ATRX
but not
TERT
promoter mutations
are associated with increased telomere length.
Recent advances in glioma classification based on
IDH
mutation and 1p/19q co-deletion status were
recapitulated through analysis of DNA methylation
profiles, which identified clinically relevant molecular
subsets. A subtype of IDH mutant glioma was
asso-ciated with DNA demethylation and poor outcome;
http://dx.doi.org/10.1016/j.cell.2015.12.028SUMMARY
a group of IDH-wild-type diffuse glioma showed
mo-lecular similarity to pilocytic astrocytoma and
rela-tively favorable survival. Understanding of cohesive
disease groups may aid improved clinical outcomes.
INTRODUCTION
Diffuse gliomas represent 80% of malignant brain tumors (Schwartzbaum et al., 2006). Adult diffuse gliomas are classi-fied and graded according to histological criteria (oligoden-droglioma, oligoastrocytoma, astrocytoma, and glioblastoma; grade II to IV). Although histopathologic classification is well established and is the basis of the World Health Organization (WHO) classification of CNS tumors (Louis et al., 2007), it suf-fers from high intra- and inter-observer variability, particularly among grade II-III tumors (van den Bent, 2010). Recent molec-ular characterization studies have benefited from the availabil-ity of the datasets generated by The Cancer Genome Atlas (TCGA) (Brennan et al., 2013; Eckel-Passow et al., 2015; Frat-tini et al., 2013; Kim et al., 2015; Suzuki et al., 2015; Cancer Genome Atlas Research Network et al., 2015) and have related genetic, gene expression, and DNA methylation signatures with prognosis (Noushmehr et al., 2010; Sturm et al., 2012; Verhaak et al., 2010). For example, mutations in the isocitrate dehydrogenase genes 1 and 2 (IDH1/IDH2) define a distinct subset of glioblastoma (GBM) with a hypermethylation pheno-type (G-CIMP) with favorable outcome (Noushmehr et al., 2010; Yan et al., 2009). Conversely, the absence ofIDH muta-tions in LGG marks a distinct IDH-wild-type subgroup charac-terized by poor, GBM-like prognosis (Eckel-Passow et al., 2015; Cancer Genome Atlas Research Network et al., 2015). Recent work by us and others has proposed classification of glioma into IDH wild-type cases, IDH mutant group addi-tionally carrying codeletion of chromosome arm 1p and 19q (IDH mutant-codel) and samples with euploid 1p/19q (IDH mutant-non-codel), regardless of grade and histology ( Eckel-Passow et al., 2015; Cancer Genome Atlas Research Network et al., 2015). Mutation of theTERTpromoter, which has been reported with high frequency across glioma, may be an addi-tional defining feature. Current analyses have not yet clarified the relationships between LGGs and GBMs that share com-mon genetic hallmarks like IDH mutation or TERT promoter mutation status. An improved understanding of these relation-ships will be necessary as we evolve toward an objective genome-based clinical classification.
To address the above issues, we assembled a dataset comprising all TCGA newly diagnosed diffuse glioma consisting of 1,122 patients and comprehensively analyzed using seq-uencing and array-based molecular profiling approaches. We have addressed crucial technical challenges in analyzing this comprehensive dataset, including the integration of multiple platforms and data sources (e.g., multiple methylation and gene expression platforms). We identified new diffuse glioma subgroups with distinct molecular and clinical features and shed light on the mechanisms driving progression of lower grade glioma (LGG) (WHO grades II and III) into full-blown GBM (WHO grade IV).
RESULTS
Patient Cohort Characteristics
The TCGA LGG and GBM cohorts consist of 516 and 606 pa-tients, respectively. Independent analysis of the GBM dataset was previously described, as was analysis of 290 LGG samples (Brennan et al., 2013; Cancer Genome Atlas Research Network et al., 2015). 226 LGG samples were added to our current cohort (Table 1). Clinical data, including age, tumor grade, tumor histol-ogy, and survival, were available for 93% (1,046/1,122) of cases (Table S1). The majority of samples were grade IV tumors (n = 590, 56%), whereas 216 (21%) and 241 (23%) were grade II and III tumors, respectively. Similarly, 590 (56%) samples were classified as GBM, 174 (17%) as oligodendroglioma, 169 (16%) as astrocytoma, and 114 (11%) as oligoastrocytoma.
Among the data sources considered in our analysis were gene expression (n = 1,045), DNA copy number (n = 1,084), DNA methylation (n = 932), exome sequencing (n = 820), and protein expression (n = 473). Multiple and overlapping characterization assays were employed (Table S1). All data files that were used in our analysis can be found at https://tcga-data.nci.nih.gov/ docs/publications/lgggbm_2015/.
Identification of Novel Glioma-Associated Genomic Alterations
To establish the set of genomic alterations that drive gliomagen-esis, we called point mutations and indels on the exomes of 513 LGG and 307 GBM using the Mutect, Indelocator, Varscan2, and RADIA algorithms and considered all mutations identified by at least two callers. Significantly mutated genes (SMGs) were determined using MutSigCV. This led to the identification of 75 SMGs, 10 of which had been previously reported in GBM (Brennan et al., 2013), 12 of which had been reported in LGG (Cancer Genome Atlas Research Network et al., 2015), and 8 of which had been identified in both GBM and LGG studies. 45 SMGs have not been previously associated with glioma and ranged in mutation frequency from 0.5% to 2.6% (Table S2A). We used GISTIC2 to analyze the DNA copy number profiles of 1,084 samples, including 513 LGG and 571 GBM, and identified 162 significantly altered DNA copy number seg-ments (Table S2B). We employed PRADA and deFuse to detect 1,144 gene fusion events in the RNA-seq profiles available for 154 GBM and 513 LGG samples, of which 37 in-frame fusions involved receptor tyrosine kinases (Table S2C). Collectively, these analyses recovered all known glioma driving events, including in IDH1 (n = 457),TP53 (n = 328),ATRX(n = 220),
EGFR (n = 314), PTEN (n = 168), CIC (n = 80), and FUBP1
(n = 45). Notable newly predicted glioma drivers relative to the earlier TCGA analyses were genes associated with chromatin organization such asSETD2(n = 24),ARID2(n = 20),DNMT3A (n = 11), and theKRAS/NRASoncogenes (n = 25 and n = 5, respectively).
iyama, 2012). The cohesin complex is responsible for the adhe-sion of sister chromatids following DNA replication and is essen-tial to prevent premature chromatid separation and faithful chromosome segregation during mitosis (Peters and Nishiyama, 2012). Alterations in the cohesin pathway have been reported in 12% of acute myeloid leukemias (Kon et al., 2013). Mutations of the cohesin complex geneSTAG2had been previously reported in GBM (Brennan et al., 2013). Taken together, 16% of the LGG/ GBM showed mutations and/or CNAs in multiple genes involved in the cohesin complex, thus nominating this process as a prom-inent pathway involved in gliomagenesis.
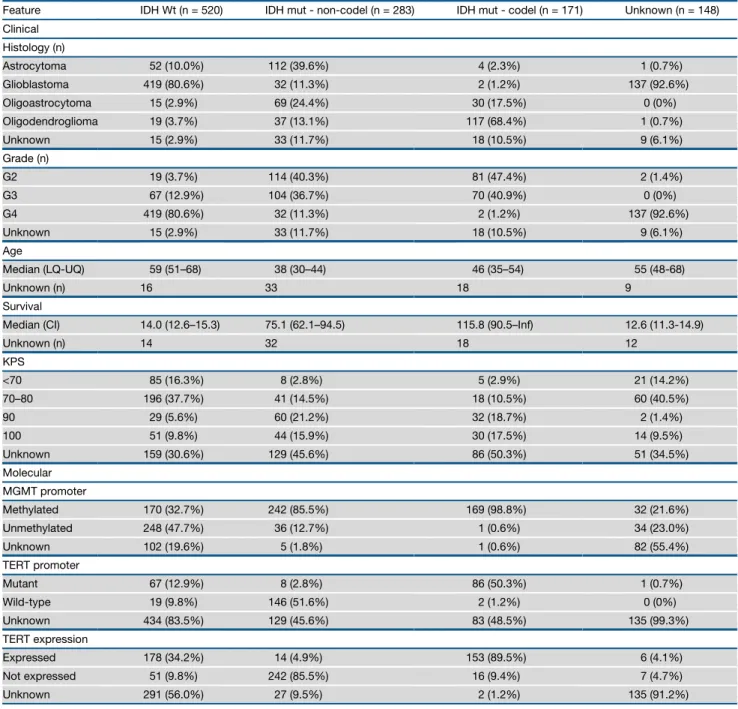
Table 1. Clinical Characteristics of the Sample Set Arranged by IDH and 1p/19q Co-deletion Status
Feature IDH Wt (n = 520) IDH mut - non-codel (n = 283) IDH mut - codel (n = 171) Unknown (n = 148)
Clinical
Histology (n)
Astrocytoma 52 (10.0%) 112 (39.6%) 4 (2.3%) 1 (0.7%)
Glioblastoma 419 (80.6%) 32 (11.3%) 2 (1.2%) 137 (92.6%)
Oligoastrocytoma 15 (2.9%) 69 (24.4%) 30 (17.5%) 0 (0%)
Oligodendroglioma 19 (3.7%) 37 (13.1%) 117 (68.4%) 1 (0.7%)
Unknown 15 (2.9%) 33 (11.7%) 18 (10.5%) 9 (6.1%)
Grade (n)
G2 19 (3.7%) 114 (40.3%) 81 (47.4%) 2 (1.4%)
G3 67 (12.9%) 104 (36.7%) 70 (40.9%) 0 (0%)
G4 419 (80.6%) 32 (11.3%) 2 (1.2%) 137 (92.6%)
Unknown 15 (2.9%) 33 (11.7%) 18 (10.5%) 9 (6.1%)
Age
Median (LQ-UQ) 59 (51–68) 38 (30–44) 46 (35–54) 55 (48-68)
Unknown (n) 16 33 18 9
Survival
Median (CI) 14.0 (12.6–15.3) 75.1 (62.1–94.5) 115.8 (90.5–Inf) 12.6 (11.3-14.9)
Unknown (n) 14 32 18 12
KPS
<70 85 (16.3%) 8 (2.8%) 5 (2.9%) 21 (14.2%)
70–80 196 (37.7%) 41 (14.5%) 18 (10.5%) 60 (40.5%)
90 29 (5.6%) 60 (21.2%) 32 (18.7%) 2 (1.4%)
100 51 (9.8%) 44 (15.9%) 30 (17.5%) 14 (9.5%)
Unknown 159 (30.6%) 129 (45.6%) 86 (50.3%) 51 (34.5%)
Molecular
MGMT promoter
Methylated 170 (32.7%) 242 (85.5%) 169 (98.8%) 32 (21.6%)
Unmethylated 248 (47.7%) 36 (12.7%) 1 (0.6%) 34 (23.0%)
Unknown 102 (19.6%) 5 (1.8%) 1 (0.6%) 82 (55.4%)
TERT promoter
Mutant 67 (12.9%) 8 (2.8%) 86 (50.3%) 1 (0.7%)
Wild-type 19 (9.8%) 146 (51.6%) 2 (1.2%) 0 (0%)
Unknown 434 (83.5%) 129 (45.6%) 83 (48.5%) 135 (99.3%)
TERT expression
Expressed 178 (34.2%) 14 (4.9%) 153 (89.5%) 6 (4.1%)
Not expressed 51 (9.8%) 242 (85.5%) 16 (9.4%) 7 (4.7%)
Unknown 291 (56.0%) 27 (9.5%) 2 (1.2%) 135 (91.2%)
detectedacross578cases(73%),mostlyoccurringin IDH-wild-typesamples(n=327of357,92%).Conversely,wefoundthata setof36genesinvolvedinchromatinmodificationwastargeted bygeneticalterationsin423tumors(54%,n=36genes),mostof whichbelongedtotheIDHmutant-non-codelgroup(n=230, 87%).
Nish-Telomere Length Is Positively Correlated with ATRX, but Not TERT Promoter Mutations
Mutations in theTERTpromoter (TERTp) have been reported in 80% of GBM (Killela et al., 2013). We used TERTpmutation calls from targeted sequencing (n = 287) and complemented them with TERTp mutations inferred from whole-genome sequencing (WGS) data (n = 42).TERTpmutations are nearly mutually exclusive with mutations in ATRX (Eckel-Passow et al., 2015), which was confirmed in our cohort. Overall, 85% of diffuse gliomas harbored mutations of TERTp (n = 157, 48%) orATRX(n = 120, 37%).TERTpmutations activate
TERT mRNA expression through the creation of a de novo E26 transformation-specific (ETS) transcription factor-binding site (Horn et al., 2013), and we observed significant TERT
upregulation inTERTp mutant cases (p value < 0.0001, Fig-ure S1A).TERTexpression measured by RNA-seq was a highly sensitive (91%) and specific (95%) surrogate for the presence ofTERTpmutation (Figure S1B). We correlatedTERTpstatus with glioma driving alterations and observed that nearly all IDH-wild-type cases with chromosome 7 gain and chromo-some 10 loss harbored TERTp mutations or upregulated
TERTexpression (n = 52/53 and n = 134/147, respectively; Fig-ure 1A). Conversely, only 45% of IDH-wild-type samples lack-ing chromosome 7/chromosome 10 events showed TERTp
mutations or elevated TERT expression (n = 15/33 and n = 43/82, respectively). Thus,TERTpmutations may precede the chr 7/chr 10 alterations that have been implicated in glioma initiation (Ozawa et al., 2014).
A
B
C
Figure 1. Telomere Length Associations in Glioma
(A) Heatmap of relative tumor/normal telomere lengths of 119 gliomas, grouped byTERTpand
ATRXmutation status.
(B) Telomere length decreases with increasing age (measured in years at diagnosis) in blood normal control samples (n = 137).
(C) Quantitative telomere length estimates of tu-mors and blood normal, grouped byTERTpmutant (n = 67, 56%),ATRXmutant (n = 40, 33%), and double negative (n = 13, 11%) status. *** = p < 0.0001; ** = p < 0.001.
To correlateTERTpmutations to telo-mere length, we used whole-genome sequencing and low pass whole-genome sequencing data to estimate telomere length in 141 pairs of matched tumor and normal samples. As expected, we observed an inverse correlation of telo-mere length with age at diagnosis in matching blood normal samples ( Fig-ure 1B) and tumor samples (Figure S1C). Glioma samples harboring ATRX muta-tions showed significantly longer telo-meres compared toTERTpmutant sam-ples (t test p value < 0.0001;Figure 1C). Among TERTp mutation gliomas, there was no difference in telomere length between samples with and without additionalIDH1/IDH2mutations, despite a difference in age. ATRX forms a complex with DAXX and H3.3, and the genes encoding these proteins are frequently mutated in pediatric gli-omas (Sturm et al., 2012). Mutations in DAXX and H3F3A were identified in only two samples in our WGS dataset. The ATRX-DAXX-H3.3 complex is associated with the alternative length-ening of telomeres (ALT) and our observations confirm previously hypothesized fundamental differences between the telomere control exerted by telomerase and ALT (Sturm et al., 2014).
As demonstrated by the identification ofTERTpmutations, so-matic variants affecting regulatory regions may play a role in glio-magenesis. Using 67 matched whole-genome and RNA-seq expression pairs, we similarly sought to identify mutations located within 2 kb upstream of transcription start sites and associated with a gene expression change. Using strict filtering methods, we identified 12 promoter regions with mutations in at least 6 samples. Three of 12 regions related to a significant difference in the expression of the associated gene expression, suggesting possible functional consequences. Other thanTERT
LGm5/LGm6 wereIDH-wild-type (429/430, 99%) and enriched for GBM (383/478, 80%). LGm1–3 showed genome-wide hyper-methylation compared to LGm4–6 clusters (Figure S2A), docu-menting the association betweenIDH mutation and increased DNA methylation (Noushmehr et al., 2010; Turcan et al., 2012). Principal component analysis using 19,520 probes yielded similar results, thus emphasizing that our probe selection method did not introduce unwanted bias (Figure S2B). The gene expression clusters LGr1–3 harboredIDH1orIDH2 muta-tions (438 of 533, 82%) and were enriched for LGG (436/563, 77%), while the LGr4 was exclusively IDH-wild-type (376 of 387, 97%) and enriched for GBM (399/476, 84%).
We extended our analysis using Tumor Map (Supplemental Experimental Procedures) to perform integrated co-clustering analysis of the combined gene expression (n = 1,196) and DNA methylation (n = 867) profiles. An interactive Tumor Map version is publicly available athttp://tumormap.ucsc.edu/?p=ynewton. gliomas-paper. Tumor Map assigns samples to a hexagon in a grid so that nearby samples are likely to have similar genomic profiles and allows visualizing complex relationships between heterogeneous genomic data samples and their clinical or phenotypical associations. Thus, clusters in the map indicate groups of samples with high similarity of integrated gene expres-sion and DNA methylation profiles (Figure 2C). The map confirms clustering by IDH status and additionally shows islands of sam-ples that share previously reported GBM cluster memberships (Noushmehr et al., 2010; Verhaak et al., 2010). To assess
Figure 2. Pan-glioma DNA Methylation and Transcriptome Subtypes
(A) Heatmap of DNA methylation data. Columns represent 932 TCGA glioma samples grouped according to unsupervised cluster analysis; rows represent DNA methylation probes sorted by hierarchical clustering. Non-neoplastic samples are represented on the left of the heatmap (n = 77) (Guintivano et al., 2013). (B) Heatmap of RNA sequencing data. Unsupervised clustering analysis for 667 TCGA glioma samples profiled using RNA sequencing are plotted in the heatmap using 2,275 most variant genes. Previously published subtypes were derived fromBrennan et al. (2013)andCancer Genome Atlas Research Network et al., 2015. (C) Tumor Map based on mRNA expression and DNA methylation data. Each data point is a TCGA sample colored coded according to their identified status. A live interactive version of this map is available athttp://tumormap.ucsc.edu/?p=ynewton.gliomas-paper.
UnsupervisedClusteringofGliomasIdentifiesSix MethylationGroupsandFourRNAExpressionGroups AssociatedwithIDHStatus
TosegregatetheDNAmethylationsubtypesacrossthe pan-gli-omadataset,weanalyzed932gliomasamplesprofiledonthe HumanMethylation450platform(516 LGGand 129GBM)and theHumanMethylation27platform(287GBM).Inorderto incor-poratethemaximumnumberofsamples,wemergeddatasets frombothmethylationplatformsyieldingacoreset of25,978 CpGprobes.Toreducecomputationalrequirementstocluster this large dataset, we eliminated sites that were methylated (meanbvalueR0.3)innon-tumorbraintissuesandselected 1,300tumor-specificmethylatedprobes(1,300/25,978,5%)to performunsupervisedk-meansconsensusclustering.This iden-tifiedsixdistinctclusters,labeledLGm1–6(Figure2AandTables S1andS3A).Next,wesoughttodeterminepan-glioma expres-sionsubtypesthroughunsupervisedclusteringanalysisof667 RNA-seqprofiles(513LGG and154GBM), which resultedin four main clusters labeled LGr1–4 (Figure 2Band Tables S1
clustering sensitivity to pre-processing, we tried complementary methods and obtained similar results (Figure S2C).
To identify genes whose copy number changes are associated with concordant changes in gene expression, we combined expression and copy number profiles from 659 samples to define a signature of 57 genes with strong functional copy number (fCN) change (Table S3B). The fCN signature clustered gliomas into three macro-clusters, LGfc1–3, strongly associated with IDH and 1p/19q status (Figure S2D). The fCN analysis revealed the functional activation of a cluster of HOXAgenes in the IDH-wild-type LGfc2 cluster, which were previously associated with glioma stem cell maintenance (Kurscheid et al., 2015).
Finally, we clustered reverse phase protein array profiles, con-sisting of 196 antibodies on 473 samples. Two macro clusters were observed, and in contrast to the transcriptome/methyl-ome/fCNV clustering, the primary discriminator was based on glioma grade (LGG versus GBM) rather than IDH status ( Fig-ure S2E). Compared to the LGG-like cluster, the GBM-like cluster had elevated expression of IGFBP2, fibronectin, PAI1, HSP70, EGFR, phosphoEGFR, phosphoAKT, Cyclin B1, Caveo-lin, Collagen VI, Annexin1, and ASNS, whereas the LGG class showed increased activity of PKC (alpha, beta, and delta), PTEN, BRAF, and phosphoP70S6K.
The above results confirm IDH status as the major determinant of the molecular footprints of diffuse glioma. To further elucidate the subtypes of diffuse glioma, we performed unsupervised clus-tering within each of the two IDH-driven macroclusters. We used 1,308 tumor-specific CpG probes defined among the IDH muta-tion cohort (n = 450) and identified three IDH mutant-specific DNA methylation clusters (Figure S3A). Using 914 tumor-specific CpG probes in the IDH-wild-type cohort (n = 430), we uncovered three IDH-wild-type-specific clusters (Figure S4A). The sets of CpG probes used to cluster each of the two IDH-driven datasets overlapped significantly with the 1,300 probes that defined the pan-glioma DNA methylation clustering (1162/1,300, 89% and 853/1,300, 66%, for IDH mutant and IDH-wild-type, respec-tively). The clusters identified by separating IDH mutant and IDH-wild-type gliomas showed strong overall concordance with pan-glioma DNA methylation subtypes (Table S3A). Simi-larly, unsupervised clustering of 426 IDH mutant RNA-seq pro-files resulted in three subtypes (Figure S3A), and analysis of the 234 IDH-wild-type samples led to four mixed LGG/GBM clusters that showed enrichment for previously identified GBM expression subtypes (Figure S4C) (Verhaak et al., 2010).
An Epigenetic Signature Associated with Activation of Cell Cycle Genes Segregates a Subgroup of IDH Mutant LGG and GBM with Unfavorable Clinical Outcome The three epigenetic subtypes defined by clustering IDH mutant glioma separated samples harboring the 1p/19q co-deletion into a single cluster and non-codel glioma into two clusters ( Fig-ure S3A). Conversely, non-codel glioma grouped nearly exclu-sively into a single expression cluster, and codels were split in two separated expression clusters (Figure S3A). A distinct sub-group of samples within the IDH mutant-non-codel DNA methyl-ation clusters manifested relatively reduced DNA methylmethyl-ation (Figure S3B). The unsupervised clustering of IDH mutant glioma was unable to segregate the lower methylated non-codel sub-group as the 1,308 probes selected for unsupervised clustering included only 19 of the 131 differentially methylated probes char-acteristic for this subgroup (FDR < 10 15, difference in mean
methylation beta value > 0.27). The low-methylation subgroup consisted of both G-CIMP GBM (13/25) and LGGs (12/25) and was confirmed using a non-TCGA dataset (Figure S3C). The tu-mors with higher methylation in the split cluster were very similar to those grouped in the second non-codel cluster, and a super-vised comparison identified only 12 probes as differentially DNA methylated (Figures 3A and 3B). We concluded that IDH mutant glioma is composed of three coherent subgroups: (1) the Codel group, consisting of IDH mutant-codel LGGs; (2) the G-CIMP-low group, including IDH mutant-non-codel glioma (LGG and GBM) manifesting relatively low genome-wide DNA methylation; and (3) the G-CIMP-high group, including IDH mutant-non-codel glioma (LGG and GBM) with higher global levels of DNA methyl-ation. The newly identified G-CIMP-low group of glioma was associated with significantly worse survival as compared to the G-CIMP-high and Codel groups (Figure S3D). The clinical outcome of the tumors classified as G-CIMP-high was as favor-able as that of Codel tumors, the subgroup generally thought to have the best prognosis among glioma patients (Figures 3C and
S3D). We compared the frequencies of glioma driver gene alter-ations between the three types of IDH mutant glioma and found that 15 of 18 G-CIMP-low cases carried abnormalities in cell cycle pathway genes such as CDK4andCDKN2A, relative to 36/241 and 2/172 for G-CIMP-high and Codels, respectively (Figure 3D). Supervised analysis between gene expression of G-CIMP-low and G-CIMP-high resulted in 943 differentially ex-pressed genes. We mapped the 943 deregulated genes to 767 nearest CpG probes (max distance 1 kb) and found the majority
Figure 3. Identification of a Distinct G-CIMP Subtype Defined by Epigenomics
(A) Heatmap of probes differentially methylated between the two IDH mutant-non-codel DNA methylation clusters allowed the identification of a low-methylation subgroup named G-CIMP-low. Non-tumor brain samples (n = 12) are represented on the left of the heatmap.
(B) Heatmap of genes differentially expressed between the two IDH mutant-non-codel DNA methylation clusters. (C) Kaplan-Meier survival curves of IDH mutant methylation subtypes. Ticks represent censored values. (D) Distribution of genomic alterations in genes frequently altered in IDH mutant glioma.
(E) Genomic distribution of 633 CpG probes differentially demethylated between co-clustered G-CIMP-low and G-CIMP-high. CpG probes are grouped by UCSC genome browser-defined CpG Islands, shores flanking CpG island±2 kb and open seas (regions not in CpG islands or shores).
(F) DNA methylation heatmap of TCGA glioma samples ordered perFigure 2A and the epigenetically regulated (EReg) gene signatures defined for G-CIMP-low, G-CIMP-high, and Codel subtypes. The mean RNA sequencing counts for each gene matched to the promoter of the identified cgID across each cluster are plotted to the right.
of the CpG probes (486/767, 63%) to show a significant methyl-ation difference (FDR < 0.05, difference in mean methylmethyl-ation beta value > 0.01) between G-CIMP-low and G-CIMP-high, suggest-ing a mechanistic relation between loss of methylation and increased transcript levels.
Recent analysis of epigenetic profiles derived from colon can-cers showed that transcription factors may bind to regions of demethylated DNA (Berman et al., 2012). Therefore, we asked whether transcription factors may be recruited to the DNA regions differentially methylated between G-CIMP-low samples and G-CIMP-high samples from the same methylation cluster, using 450K methylation profiles (n = 39). Globally, we detected 643 differentially methylated probes between 27 G-CIMP-low and 12 G-CIMP-high samples (absolute diff-mean differenceR0.25, FDR %5%). Most of these probes (69%) were located outside of any known CpG island but positioned within intergenic regions known as open seas (Figure 3E). This represents a 2.5-fold open sea enrichment compared to the expected genome-wide distribution of 450K CpG probes (chi-square p value < 2.2 3 10 16). We also observed a 3.4-fold
depletion within CpG islands (chi-square p value < 2.2310 16).
Using this set of intergenic CpG probes, we asked whether a DNA motif signature associated with distal regulatory elements. Such a pattern would point to candidate transcription factors involved in tumorigenesis of the G-CIMP-low group. A de novo motif scan and known motif scan identified a distinct motif signa-ture TGTT (geometric test p value = 10 11, fold enrichment = 1.8),
known to be associated with the OLIG2 and SOX transcription factor families (Figure 3E) (Lodato et al., 2013). This observation was corroborated by the higher expression levels ofSOX2, as well as 17 out of 20 other known SOX family members in G-CIMP-low compared to G-CIMP-high (fold difference > 2). The primary function of SOX2 in the nervous system is to promote self-renewal of neural stem cells and, within brain tumors, the gli-oma stem cell state (Graham et al., 2003). Interestingly, SOX2 and OLIG2 have been described as neurodevelopmental tran-scription factors being essential for GBM propagation (Suva` et al., 2014). Supervised gene expression pathway analysis of the genes activated in the G-CIMP-low group as opposed to G-CIMP-high group revealed activation of genes involved in cell cycle and cell division consistent with the role of SOX in pro-moting cell proliferation (Figure S3E). The enrichment in cell cy-cle gene expression provides additional support to the notion that development of the G-CIMP-low subtype is associated with activation of cell cycle progression and may be mediated by a loss of CpG methylation and binding of SOX factors to candidate genomic enhancer elements.
To validate the G-CIMP-low, G-CIMP-high, and Codel IDH mutant subtypes, we compiled a validation cohort from pub-lished studies, including 324 adult and pediatric gliomas (Lambert et al., 2013; Mur et al., 2013; Sturm et al., 2012; Turcan et al., 2012). The CpG probe methylation signatures used to clas-sify the validation set are provided on the publication portal accompanying this publication (https://tcga-data.nci.nih.gov/ docs/publications/lgggbm_2015/). Among them, 103 were iden-tified as IDH mutant on the basis of their genome-wide DNA methylation profile. We classified samples in the validation set using the probes that defined the IDH mutant-specific DNA
methylation cluster analysis integrated in a supervised random forest method. The analysis recapitulated the clusters generated from the TCGA collection (Figure S3C). In order to determine epigenetically regulated (EReg) genes that may be characteristic of the biology of the IDH mutant diffuse glioma subtypes, we compared 450k methylation DNA methylation profiles and gene expression levels between 636 IDH mutant and IDH-wild-type gliomas and 110 non-tumor samples from 11 different tissue types. From the list of epigenetically regulated genes, we extracted 263 genes that were grouped into EReg gene sig-natures, which showed differential signals among the three IDH mutant subtypes (Figure 3F). These trends were confirmed in the validation set (Figure 3G).
We investigated the possibility that the G-CIMP-high group is a predecessor to the G-CIMP-low group by comparing the DNA methylation profiles from ten IDH mutant-non-codel LGG and GBM primary-recurrent cases with the TCGA cohort. We evaluated the DNA methylation status of probes identified as differentially methylated (n = 90) between CIMP-low and G-CIMP-high (FDR < 10 13, difference in mean methylation
beta-value > 0.3 and < 0.4). Four out of ten IDHmut-non-codel cases showed a demethylation pattern after disease recurrence, while partial demethylation was demonstrated in the remaining six re-currences, supporting the notion of a progression from G-CIMP-high to G-CIMP-low phenotype (Figure 3H).
An IDH-Wild-Type Subgroup of Histologically Defined Diffuse Glioma Is Associated with Favorable Survival and Shares Epigenomic and Genomic Features with Pilocytic Astrocytoma
IDH-wild-type gliomas segregated into three DNA methylation clusters (Figure S4A). The first is enriched with tumors belonging to the classical gene expression signature and was labeled Classic-like, whereas the second group, enriched with mesen-chymal subtype tumors, was labeled Mesenmesen-chymal-like (Table S1) (Verhaak et al., 2010). The third cluster contained a larger fraction of LGG in comparison to the other IDH-wild-type clus-ters. We observed that the IDH-wild-type LGGs but not the IDH-wild-type GBM in this cluster displayed markedly longer survival (log-rank p value = 3.6310 5;Figure 4A) and occurred
in younger patients (mean 37.6 years versus 50.8 years, t test p value = 0.002). Supervised analysis of differential methylation between LGG and GBM in the third DNA methylation cluster did not reveal any significant probes despite significant differ-ences in stromal content (p value < 0.005;Figure S4D), suggest-ing that this group cannot be further separated ussuggest-ing CpG methylation markers.
Next, we sought to validate the methylation-based classifica-tion of IDH-wild-type glioma in an independent cohort of 221 predicted IDH-wild-type glioma samples, including 61 grade I pi-locytic astrocytomas (PAs). Toward this aim, we used a super-vised random forest model built with the probes that defined the IDH-wild-type clusters. Samples classified as Mesen-chymal-like showed enrichment for the Sturm et al. (2012)
TERTexpression, compared to 5 of 12 LGm6-GBM (43%), 60 of 65 Classic-like (92%), and 82 of 98 Mesenchymal-like (84%, FET p value < 0.0001). The PA-like group was characterized by relatively low frequency of typical GBM alterations in genes such asEGFR,CDKN2A/B, andPTEN and displayed euploid DNA copy number profiles (Figure S4E). To ascertain that the histologies of the PA-like subgroup had been appropriately classified, we conducted an independent re-review. This anal-ysis confirmed the presence of the histologic features of diffuse glioma (grade II or grade III) in 23 of the 26 cases in the cluster. The remaining three cases were re-named as PA (grade I). An independent review of the magnetic resonance diagnostic images from 13 cases showed a similar pattern, with the ma-jority of tumors showing behavior consistent with grade II or grade III glioma. Taken together, the epigenetic analysis of the
Figure 4. A Distinct Subgroup of IDH-Wild-Type Diffuse Glioma with Molecular Features of Pilocytic Astrocytoma
(A) Kaplan-Meier survival curves for the IDH-wild-type glioma subtypes. Ticks represent censorship.
(B) Distribution of previous published DNA methylation subtypes in the validation set, across the TCGA IDH-wild-type-specific DNA methylation clusters. (C) Distribution of genomic alterations in genes frequently altered in IDH-wild-type glioma.
(D) Heatmap of TCGA glioma samples ordered according toFigure 2A and two EReg gene signatures defined for the IDH-wild-type DNA methylation clusters. Mean RNA sequencing counts for each gene matched to the promoter of the identified cgID across each cluster are plotted to the right.
(E) Heatmap of the validation set classified using the random forest method using the 1,300 probes defined inFigure 2A.
LGG-enrichedgroup(FigureS4B).Basedonthemolecular sim-ilaritywithPA,welabeledtheLGGsinthethirdmethylation clus-terofIDH-wild-typetumorsasPA-like.TheGBMsinthisgroup werebestdescribedasLGm6-GBMfortheiroriginalpan-glioma methylationclusterassignmentandtumorgrade.
Pilocytic astrocytomas are characterized by frequent alter-ations in the MAPK pathway, such as FGFR1 mutations,
IDH-wild-type group of adult glioma revealed the existence of a novel subgroup sharing genetic and DNA methylation features with pediatric PA and favorable clinical outcome compared to diffuse IDH-wild-type glioma. This group may include but ex-tends beyondBRAF-mutated grade II oligodendroglioma that were previously recognized as a unique clinical entity (Chi et al., 2013).
Through comparison of the methylation profiles of 636 glioma and 110 non-neoplastic normal samples from different tissue types, we defined EReg signatures consisting of 27 genes that showed differential signals among IDH-wild-type subtypes in the TCGA (Figure 4D) and the validation set (Figure 4E). EReg4 comprised a group of 15 genes hypermethylated and downregu-lated in particularly Classic-like. EReg5 was defined as a group of 12 genes associated with hypomethylation in LGm6/PA-like compared to all other LGm clusters. These ERegs aided in char-acterizing the biological importance of IDH-wild-type subtypes and were subsequently used to evaluate the prognostic impor-tance of the IDH-wild-type clusters.
The Epigenetic Classification of Glioma Provides Prognostic Value Independent of Age and Grade
In order to assess whether the DNA methylation-based subtypes we identified carry prognostically relevant information indepen-dent of known overall survival predictors, we constructed a se-ries of survival regression models. To find the optimal model for survival prediction, we studied covariates individually and in combination with other covariates. Age at diagnosis, histology, IDH/codel subtype,TERTexpression, and epigenetic subtype all contribute to survival in single-predictor analysis (log-rank p value < 0.05,Table S4). As expected, age was a highly significant predictor (p < 0.0001, C-Index 0.78) and was included in all sub-sequent multi-predictor models. We found that histology and grade are highly correlated. Histology provided only marginal improvement to a model that includes grade (likelihood ratio test [LRT] p value = 0.08) and was therefore not included in further analyses. Conversely, grade markedly impacted a
histol-ogy-based predictor model (LRT p value = 0.0005,Table S4) and was retained in the subsequent models. In contrast to previous reports (Eckel-Passow et al., 2015), we failed to observe a statis-tically significant and independent survival association with
TERTexpression (LRT p value = 0.82,Table S4) orTERTp muta-tions after accounting for age and grade (LRT p value = 0.85, data not shown). Thus, the optimal survival prediction model in-cludes age, grade, and epigenetic subtype (LRT p value < 0.0001, C-Index 0.836;Table 2).
To confirm that the epigenetic subtypes provide independent prognostic information, we tested the survival model on the validation dataset. Epigenetic subtypes in these samples were determined as described above. The distinction between LGm6-GBM and PA-like gliomas was made on the basis of tu-mor grade and not by DNA methylation signature. Using a subset of 183 samples in the validation cohort with known survival, age, and grade, we found that epigenetic subtypes are significant in-dependent predictors of survival in the multivariate analysis (LRT p value < 0.0001, C-Index 0.746,Table 2). This generalization of our model supports the epigenetic subtypes as a means to improve the prognostication of glioma.
Activation of Cell Cycle/Proliferation and Invasion/ Microenvironmental Changes Marks Progression of LGG to GBM
We observed that, in spite of morphological differences between LGG and GBM, such as high cell density and microvascular pro-liferation, clustering of gene expression profiles frequently grouped LGG and GBM together within the same subtype. Gene Set Enrichment Analysis of the genes activated in G-CIMP GBM as opposed to the IDH mutant-non-codel within LGr3 (Figure 2B) revealed four major groups, including cell cycle and hyperproliferation, DNA metabolic processes, response to stress, and angiogenesis (Figure S5A andTable S5). These bio-logical functions are consistent with the criteria based on mitotic index used by pathologists to discriminate lower and high-grade glioma and the significance of activated microglia for tumor
Table 2. DNA Methylation Subtypes Are Prognostically Relevant in Multivariable Analysis and in External Validation Data
Discovery (n = 809) Validation (n = 183)
C-Index: 0.835±0.019 C-Index: 0.745±0.032
Predictor Levels n HR (95% CI) Signif. n HR (95% CI) Signif.
Age at diagnosis per year 809 1.05 (1.03–1.06) *** 183 1.02 (1–1.04) *
WHO Grade II 214 1.0 (ref) 41 1.0 (ref)
III 241 1.96 (1.15–3.33) * 51 1.24 (0.55–2.76)
IV 354 2.38 (1.3–4.34) * 91 2.6 (1.08–6.3) *
Subgroup IDHmut-codel 156 1.0 (ref) 57 1.0 (ref)
G-CIMP-low 22 5.6 (2.49–12.62) *** 2 0 (0–Inf)
G-CIMP-high 219 1.92 (1.05–3.51) * 15 1.25 (0.43–3.66)
classic-like 143 5.4 (2.79–10.44) *** 22 4.55 (1.8–11.49) *
mesenchymal-like I 204 8.71 (4.59–16.53) *** 61 5.55 (2.52–12.21) ***
LGm6-GBM 39 5.79 (2.78–12.1) *** 22 6.8 (2.58–17.91) **
PA-like 26 2.02 (0.71–5.71) 4 3.64 (0.79–16.78) .
low and G-CIMP-high) based on the extent of genome-wide DNA methylation has crucial biological and clinical relevance. In particular, the identification of the G-CIMP-low subset, charac-terized by activation of cell cycle genes mediated by SOX bind-ing at hypomethylated functional genomic elements and unfa-vorable clinical outcome, is an important finding that will guide more accurate segregation and therapeutic assessment in a group of patients in which correlations of conventional grading with outcome are modest (Olar et al., 2015; Reuss et al., 2015). The finding that high tumors can emerge as G-CIMP-low glioma at recurrence identifies variations in DNA methylation as crucial determinants for glioma progression and provides a clue to the mechanisms driving evolution of glioma. Our results unify previous observations that linked the cell cycle pathway to malignant progression of low-grade glioma (Mazor et al., 2015). Future updates of the TCGA glioma clinical annotation and independent validation of our findings may be able to consider additionally important clinical confounders such as extent of resection and performance status to further optimize the weights of the currently known prognostic variables and their association to the molecular subtypes we identified.
Analysis of IDH-wild-type glioma revealed the PA-like LGG subset that harbors a silent genomic landscape, confers favor-able prognosis relative to other IDH-wild-type diffuse glioma, and displays a molecular profile with high similarity to PA. Re-re-view by neuropathologists and neuroradiologists confirmed that the majority were correctly diagnosed as diffuse glioma, empha-sizing the need for integration of molecular signatures intro clin-ical classification (Chi et al., 2013) for this subgroup of patients that may be spared potentially unnecessary intensive treatments.
The large number of exomes in our dataset allowed identifica-tion of novel glioma-associated somatic alteraidentifica-tions, including in the KRAS and NRAS genes, which were frequently used in genetically engineered glioma mouse models (Holland et al., 2000). Our analysis further nominates glial tumors to join an increasing number of tumor types characterized by a deacti-vated cohesin pathway (Kon et al., 2013; Solomon et al., 2011). Cohesin mutant tumors may infer increased sensitivity to DNA damage agents and PARP inhibitors (Bailey et al., 2014), suggesting that gliomas with genetic alterations of key cohesin regulatory factors may represent biomarkers and therapeutic opportunities.
Overexpression ofTERTmRNA was found to be associated with increased telomere length in urothelial cancer (Borah et al., 2015). Our results revealed that, in gliomas, increased telo-mere length is associated withATRXmutations, suggesting an alternative lengthening of telomeres (ALT) mechanism. ALT has been associated with sensitivity to inhibition of the protein kinase ATR (Flynn et al., 2015).
In summary, our pan-glioma analysis has expanded our knowledge of the glioma somatic alteration landscape, empha-sized the relevance of DNA methylation profiles as a modality for clinical classification, and quantitatively linked somatic TERT pathway alterations to telomere maintenance. Combined, these findings are an important step forward in our understand-ing of glioma as discrete disease subsets and the mechanisms driving gliomagenesis.
aggressiveness (Roggendorf et al., 1996). Conversely, com-paredwith the G-CIMP GBM, IDH mutant-non-codelLGG in LGr3were characterized by enrichment of genes associated with neuro-glialfunctions such as iontransport and synaptic transmission,possiblysuggestingamoredifferentiatednature. Thecomparisonofco-clusteredGBMandLGGinLGr3bythe PARADIGM algorithm that integrates DNA copy number and gene expression to infer pathway activity confirmed that GBMsexpressgenes associatedwith cellcycle,proliferation, and aggressive phenotypethrough activationof anumberof cell cycle, cell replication, and NOTCH signaling pathways whereas LGGsexhibit an enrichment of neuronal-differentia-tion-specific categories, including synaptic pathways ( Fig-ureS5CandTableS5).
TheanalysisofthegenesactivatedinGBMversustheLGG componentofLGr4,whichgroupedIDH-wild-typetumors, iden-tified an inflammation and immunologic response signature characterizedbytheactivationofseveralchemokines(CCL18,
CXCL13, CXCL2, and CXCL3) and interleukins (IL8 and
CXCR2) enrichingsets involved ininflammatory and immune response,negativeregulationofapoptosis,cellcycleand prolif-eration,andtheIKB/NFKBkinasecascadeMap(FigureS5Band
TableS5).Thesecharacteristicssuggestdifferencesinthe rela-tiveamountofmicroglia.WeusedtheESTIMATEmethodto es-timate the relativepresence of stromal cells, which revealed significantlylower(pvalue10 6) stromalscoresofLGG
IDH-wild-type versus GBM IDH-wild-type (Figure S5F)(Yoshihara et al., 2013). Resembling the functional enrichment for LGG withinLGr3,functionalenrichmentofLGGIDH-wild-typein com-parisontoGBMwithinLGr4showedactivationinLGGofspecial glial-neuronalfunctionsinvolvediniontransport,synaptic trans-mission,andnervoussystemdevelopment.
Finally, weaimed to identify transcriptionfactors thatmay exertcontroloverprominentgeneexpressionprograms,known asmasterregulators.Masterregulatoranalysiscomparingthe IDH-wild-typegrouptotheIDHmutantgrouprevealed transcrip-tionfactorsthatwereupregulatedinIDH-wild-typegliomasand showedan increase in expressionof target genes, including
NKX2-5,FOSL1,ETV4,ETV7,RUNX1,CEBPD,NFE2L3,ELF4,
RUNX3,NR2F2,PAX8,andIRF1(TableS5).Notranscription fac-tors(TFs)werefoundtobeupregulatedinIDHmutantgliomas relativetoIDH-wild-typegliomas(atalogfoldchange>1).
DISCUSSION
EXPERIMENTAL PROCEDURES
Patient and Sample Characteristics
Specimens were obtained from patients with appropriate consent from institu-tional review boards. Details of sample preparation are described in the
Sup-plemental Experimental Procedures.
Data Generation
In total, tumors from 1,132 patients were assayed on at least one molecular profiling platform, which platforms included: (1) whole-genome sequencing, including high coverage and low pass whole-genome sequencing; (2) exome sequencing; (3) RNA sequencing; (4) DNA copy-number and single-nucleotide polymorphism arrays, including Agilent CGH 244K, Affymetrix SNP6.0, and Illumina 550K Infinium HumanHap550 SNP Chip microarrays; (5) gene expres-sion arrays, including Agilent 244K Custom Gene Expresexpres-sion, Affymetrix HT-HGU133A and Affymetrix Human Exon 1.0 ST arrays; (6) DNA methyl-ation arrays, including Illumina GoldenGate Methylmethyl-ation, Illumina Infinium HumanMethylation27, and Illumina Infinium HumanMethylation450 Bead-Chips; (7) reverse phase protein arrays; (8) miRNA sequencing; and (9) miRNA Agilent 8315K Human miRNA-specific microarrays. Details of data genera-tion have been previously reported (Brennan et al., 2013; Cancer Genome Atlas Research Network et al., 2015). To ensure cross-platform comparability, features from all array platforms were compared to a reference genome.
Data Analysis
The data and analysis results can be explored through the Broad Institute FireBrowse portal (http://firebrowse.org/?cohort=GBMLGG), the cBioPortal for Cancer Genomics (http://www.cbioportal.org/study.do?cancer_study_
id=lgggbm_tcga_pub), in a Tumor Map (http://tumormap.ucsc.edu/?
p=ynewton.gliomas-paper), the TCGA transcript fusion portal (http://www.
tumorfusions.org), TCGA Batch Effects (http://bioinformatics.mdanderson.org/ tcgambatch/), Regulome Explorer (http://explorer.cancerregulome.org/), Next-Generation Clustered Heat Maps (http://bioinformatics.mdanderson.org/
TCGA/NGCHMPortal/). See alsoSupplemental Informationand the TCGA
pub-lication page (https://tcga-data.nci.nih.gov/docs/publications/lgggbm_2015/).
SUPPLEMENTAL INFORMATION
Supplemental Information includes Supplemental Experimental Procedures, five figures, and five tables and can be found with this article online athttp:// dx.doi.org/10.1016/j.cell.2015.12.028.
AUTHOR CONTRIBUTIONS
Conceptualization and project administration: R.G.W.V., A.I., and H.N.; supervision: S.R.S., K.D.A., P.W.L., M.G., D.H., D.J.B., D.H.G., R.R., C.C.L., J.S.B.-S., C.G.C., D.P.C.T., W.K.A.Y., J.H., L.C., M.M., and T.M.; formal anal-ysis: R.G.W.V., A.I., H.N., M.C., F.P.B., T.M.M., T.S.S., O.M., Y.N., S.M.P., P.Z., L.P., A. Radenbaugh, G.R., R.A., J.W., G.M., S.L., S.A., A. Rao, B.A.M., A.D.C., and H.Z.; investigation: D.J.B., L.C., and L.P.; data curation: D.J.B., L.P., and F.P.B.; writing - original draft: R.G.W.V., A.I., H.N., M.C., F.P.B., T.M.M., and T.S.S.; manuscript review: D.J.B., K.A.D., S.R.S., M.W., N.L., and D.H.G.
ACKNOWLEDGMENTS
This study was supported by NIH grants U24CA143883, U24CA143858, U24CA143840, U24CA143799, U24CA143835, U24CA143845,
U24CA143882, U24CA143867, U24CA143866, U24CA143848, U24CA144025, U54HG003067, U54HG003079, U54HG003273, U24CA126543, U24CA126544, U24CA126546, U24CA126551, U24CA126554, U24CA126561, U24CA126563, U24CA143731, U24CA143843, P30CA016672, P50 CA127001, U54CA193313, R01CA179044, R01CA185486, R01 CA190121, and P01 CA085878; Cancer Prevention & Research Institute of Texas (CPRIT) R140606; and Sa˜o Paulo Research Foundation (FAPESP) 2014/02245-3, 2015/07925-5, 2015/02844-7, and 2015/08321-3. D.J.W. is a consultant for Zymo Research Corporation. R.B. is a consultant for and received grant funding from Novartis. A.D.C. and M.M. received grant support from Bayer.
Received: July 17, 2015 Revised: October 20, 2015 Accepted: December 11, 2015 Published: January 28, 2016
REFERENCES
Bailey, M.L., O’Neil, N.J., van Pel, D.M., Solomon, D.A., Waldman, T., and Hi-eter, P. (2014). Glioblastoma cells containing mutations in the cohesin
compo-nent STAG2 are sensitive to PARP inhibition. Mol. Cancer Ther.13, 724–732.
Berman, B.P., Weisenberger, D.J., Aman, J.F., Hinoue, T., Ramjan, Z., Liu, Y., Noushmehr, H., Lange, C.P., van Dijk, C.M., Tollenaar, R.A., et al. (2012). Re-gions of focal DNA hypermethylation and long-range hypomethylation in colo-rectal cancer coincide with nuclear lamina-associated domains. Nat. Genet. 44, 40–46.
Borah, S., Xi, L., Zaug, A.J., Powell, N.M., Dancik, G.M., Cohen, S.B., Costello, J.C., Theodorescu, D., and Cech, T.R. (2015). Cancer. TERT promoter muta-tions and telomerase reactivation in urothelial cancer. Science347, 1006–1010.
Brennan, C.W., Verhaak, R.G., McKenna, A., Campos, B., Noushmehr, H., Sal-ama, S.R., Zheng, S., Chakravarty, D., Sanborn, J.Z., Berman, S.H., et al.; TCGA Research Network (2013). The somatic genomic landscape of glioblas-toma. Cell155, 462–477.
Cancer Genome Atlas Research Network, Brat, D.J., Verhaak, R.G., Aldape, K.D., Yung, W.K., Salama, S.R., Cooper, L.A., Rheinbay, E., Miller, C.R., Vi-tucci, M., et al. (2015). Comprehensive, integrative genomic analysis of diffuse
lower-grade gliomas. N. Engl. J. Med.372, 2481–2498.
Chi, A.S., Batchelor, T.T., Yang, D., Dias-Santagata, D., Borger, D.R., Ellisen, L.W., Iafrate, A.J., and Louis, D.N. (2013). BRAF V600E mutation identifies a subset of low-grade diffusely infiltrating gliomas in adults. J. Clin. Oncol.31,
e233–e236.
Eckel-Passow, J.E., Lachance, D.H., Molinaro, A.M., Walsh, K.M., Decker, P.A., Sicotte, H., Pekmezci, M., Rice, T., Kosel, M.L., Smirnov, I.V., et al. (2015). Glioma Groups Based on 1p/19q, IDH, and TERT Promoter Mutations in Tumors. N. Engl. J. Med.372, 2499–2508.
Flynn, R.L., Cox, K.E., Jeitany, M., Wakimoto, H., Bryll, A.R., Ganem, N.J., Ber-sani, F., Pineda, J.R., Suva`, M.L., Benes, C.H., et al. (2015). Alternative length-ening of telomeres renders cancer cells hypersensitive to ATR inhibitors. Sci-ence347, 273–277.
Frattini, V., Trifonov, V., Chan, J.M., Castano, A., Lia, M., Abate, F., Keir, S.T., Ji, A.X., Zoppoli, P., Niola, F., et al. (2013). The integrated landscape of driver genomic alterations in glioblastoma. Nat. Genet.45, 1141–1149.
Graham, V., Khudyakov, J., Ellis, P., and Pevny, L. (2003). SOX2 functions to maintain neural progenitor identity. Neuron39, 749–765.
Figure5. OverviewofMajorSubtypesofAdultDiffuseGlioma
Guintivano, J., Aryee, M.J., and Kaminsky, Z.A. (2013). A cell epigenotype spe-cific model for the correction of brain cellular heterogeneity bias and its appli-cation to age, brain region and major depression. Epigenetics8, 290–302.
Holland, E.C., Celestino, J., Dai, C., Schaefer, L., Sawaya, R.E., and Fuller, G.N. (2000). Combined activation of Ras and Akt in neural progenitors induces glioblastoma formation in mice. Nat. Genet.25, 55–57.
Horn, S., Figl, A., Rachakonda, P.S., Fischer, C., Sucker, A., Gast, A., Kadel, S., Moll, I., Nagore, E., Hemminki, K., et al. (2013). TERT promoter mutations
in familial and sporadic melanoma. Science339, 959–961.
Jones, D.T., Hutter, B., Ja¨ger, N., Korshunov, A., Kool, M., Warnatz, H.J., Zich-ner, T., Lambert, S.R., Ryzhova, M., Quang, D.A., et al.; International Cancer Genome Consortium PedBrain Tumor Project (2013). Recurrent somatic
alter-ations of FGFR1 and NTRK2 in pilocytic astrocytoma. Nat. Genet. 45,
927–932.
Killela, P.J., Reitman, Z.J., Jiao, Y., Bettegowda, C., Agrawal, N., Diaz, L.A., Jr., Friedman, A.H., Friedman, H., Gallia, G.L., Giovanella, B.C., et al. (2013). TERT promoter mutations occur frequently in gliomas and a subset of tumors derived from cells with low rates of self-renewal. Proc. Natl. Acad. Sci. USA 110, 6021–6026.
Kim, H., Zheng, S., Amini, S.S., Virk, S.M., Mikkelsen, T., Brat, D.J., Grimsby, J., Sougnez, C., Muller, F., Hu, J., et al. (2015). Whole-genome and multisector exome sequencing of primary and post-treatment glioblastoma reveals
pat-terns of tumor evolution. Genome Res.25, 316–327.
Kon, A., Shih, L.Y., Minamino, M., Sanada, M., Shiraishi, Y., Nagata, Y., Yosh-ida, K., Okuno, Y., Bando, M., Nakato, R., et al. (2013). Recurrent mutations in multiple components of the cohesin complex in myeloid neoplasms. Nat. Genet.45, 1232–1237.
Kurscheid, S., Bady, P., Sciuscio, D., Samarzija, I., Shay, T., Vassallo, I., Crie-kinge, W.V., Daniel, R.T., van den Bent, M.J., Marosi, C., et al. (2015). Chromo-some 7 gain and DNA hypermethylation at the HOXA10 locus are associated with expression of a stem cell related HOX-signature in glioblastoma. Genome Biol.16, 16.
Lambert, S.R., Witt, H., Hovestadt, V., Zucknick, M., Kool, M., Pearson, D.M., Korshunov, A., Ryzhova, M., Ichimura, K., Jabado, N., et al. (2013). Differential expression and methylation of brain developmental genes define
location-specific subsets of pilocytic astrocytoma. Acta Neuropathol.126, 291–301.
Lodato, M.A., Ng, C.W., Wamstad, J.A., Cheng, A.W., Thai, K.K., Fraenkel, E., Jaenisch, R., and Boyer, L.A. (2013). SOX2 co-occupies distal enhancer ele-ments with distinct POU factors in ESCs and NPCs to specify cell state.
PLoS Genet.9, e1003288.
Louis, D.N., Ohgaki, H., Wiestler, O.D., Cavenee, W.K., Burger, P.C., Jouvet, A., Scheithauer, B.W., and Kleihues, P. (2007). The 2007 WHO classification
of tumours of the central nervous system. Acta Neuropathol.114, 97–109.
Mazor, T., Pankov, A., Johnson, B.E., Hong, C., Hamilton, E.G., Bell, R.J., Smirnov, I.V., Reis, G.F., Phillips, J.J., Barnes, M.J., et al. (2015). DNA Methyl-ation and Somatic MutMethyl-ations Converge on the Cell Cycle and Define Similar Evolutionary Histories in Brain Tumors. Cancer Cell28, 307–317.
Mur, P., Mollejo, M., Ruano, Y., de Lope, A.R., Fian˜o, C., Garcı´a, J.F., Castre-sana, J.S., Herna´ndez-Laı´n, A., Rey, J.A., and Mele´ndez, B. (2013). Codeletion of 1p and 19q determines distinct gene methylation and expression profiles in
IDH-mutated oligodendroglial tumors. Acta Neuropathol.126, 277–289.
Noushmehr, H., Weisenberger, D.J., Diefes, K., Phillips, H.S., Pujara, K., Ber-man, B.P., Pan, F., Pelloski, C.E., SulBer-man, E.P., Bhat, K.P., et al.; Cancer Genome Atlas Research Network (2010). Identification of a CpG island
meth-ylator phenotype that defines a distinct subgroup of glioma. Cancer Cell17,
510–522.
Olar, A., Wani, K.M., Alfaro-Munoz, K.D., Heathcock, L.E., van Thuijl, H.F., Gilbert, M.R., Armstrong, T.S., Sulman, E.P., Cahill, D.P., Vera-Bolanos, E., et al. (2015). IDH mutation status and role of WHO grade and mitotic index
in overall survival in grade II-III diffuse gliomas. Acta Neuropathol. 129,
585–596.
Ozawa, T., Riester, M., Cheng, Y.K., Huse, J.T., Squatrito, M., Helmy, K., Charles, N., Michor, F., and Holland, E.C. (2014). Most human non-GCIMP glioblastoma subtypes evolve from a common proneural-like precursor
gli-oma. Cancer Cell26, 288–300.
Peters, J.M., and Nishiyama, T. (2012). Sister chromatid cohesion. Cold Spring Harb. Perspect. Biol.4, a011130.
Pineda, C.T., Ramanathan, S., Fon Tacer, K., Weon, J.L., Potts, M.B., Ou, Y.H., White, M.A., and Potts, P.R. (2015). Degradation of AMPK by a cancer-specific ubiquitin ligase. Cell160, 715–728.
Reuss, D.E., Mamatjan, Y., Schrimpf, D., Capper, D., Hovestadt, V., Kratz, A., Sahm, F., Koelsche, C., Korshunov, A., Olar, A., et al. (2015). IDH mutant diffuse and anaplastic astrocytomas have similar age at presentation and little
difference in survival: a grading problem for WHO. Acta Neuropathol.129,
867–873.
Roggendorf, W., Strupp, S., and Paulus, W. (1996). Distribution and character-ization of microglia/macrophages in human brain tumors. Acta Neuropathol. 92, 288–293.
Schwartzbaum, J.A., Fisher, J.L., Aldape, K.D., and Wrensch, M. (2006).
Epidemiology and molecular pathology of glioma. Nat. Clin. Pract. Neurol.2,
494–503.
Solomon, D.A., Kim, T., Diaz-Martinez, L.A., Fair, J., Elkahloun, A.G., Harris, B.T., Toretsky, J.A., Rosenberg, S.A., Shukla, N., Ladanyi, M., et al. (2011). Mutational inactivation of STAG2 causes aneuploidy in human cancer.
Sci-ence333, 1039–1043.
Sturm, D., Witt, H., Hovestadt, V., Khuong-Quang, D.A., Jones, D.T., Koner-mann, C., Pfaff, E., To¨njes, M., Sill, M., Bender, S., et al. (2012). Hotspot mu-tations in H3F3A and IDH1 define distinct epigenetic and biological subgroups of glioblastoma. Cancer Cell22, 425–437.
Sturm, D., Bender, S., Jones, D.T., Lichter, P., Grill, J., Becher, O., Hawkins, C., Majewski, J., Jones, C., Costello, J.F., et al. (2014). Paediatric and adult
glioblastoma: multiform (epi)genomic culprits emerge. Nat. Rev. Cancer14,
92–107.
Suva`, M.L., Rheinbay, E., Gillespie, S.M., Patel, A.P., Wakimoto, H., Rabkin, S.D., Riggi, N., Chi, A.S., Cahill, D.P., Nahed, B.V., et al. (2014). Reconstructing and reprogramming the tumor-propagating potential of glioblastoma stem-like cells. Cell157, 580–594.
Suzuki, H., Aoki, K., Chiba, K., Sato, Y., Shiozawa, Y., Shiraishi, Y., Shima-mura, T., Niida, A., MotoShima-mura, K., Ohka, F., et al. (2015). Mutational landscape and clonal architecture in grade II and III gliomas. Nat. Genet.47, 458–468.
Turcan, S., Rohle, D., Goenka, A., Walsh, L.A., Fang, F., Yilmaz, E., Campos, C., Fabius, A.W., Lu, C., Ward, P.S., et al. (2012). IDH1 mutation is sufficient to
establish the glioma hypermethylator phenotype. Nature483, 479–483.
van den Bent, M.J. (2010). Interobserver variation of the histopathological diagnosis in clinical trials on glioma: a clinician’s perspective. Acta Neuropa-thol.120, 297–304.
Verhaak, R.G., Hoadley, K.A., Purdom, E., Wang, V., Qi, Y., Wilkerson, M.D., Miller, C.R., Ding, L., Golub, T., Mesirov, J.P., et al.; Cancer Genome Atlas Research Network (2010). Integrated genomic analysis identifies clinically rele-vant subtypes of glioblastoma characterized by abnormalities in PDGFRA,
IDH1, EGFR, and NF1. Cancer Cell17, 98–110.
Yan, H., Parsons, D.W., Jin, G., McLendon, R., Rasheed, B.A., Yuan, W., Kos, I., Batinic-Haberle, I., Jones, S., Riggins, G.J., et al. (2009). IDH1 and IDH2 mu-tations in gliomas. N. Engl. J. Med.360, 765–773.
Yoshihara, K., Shahmoradgoli, M., Martı´nez, E., Vegesna, R., Kim, H., Torres-Garcia, W., Trevin˜o, V., Shen, H., Laird, P.W., Levine, D.A., et al. (2013). Infer-ring tumour purity and stromal and immune cell admixture from expression