UNRAVELING THE TRANSCRIPTOME OF ODONTOGENIC TUMORS
Shijia Hu
A dissertation submitted to the faculty of the University of North Carolina at Chapel Hill in partial fulfillment of the requirements for the degree of Doctor of Philosophy in the Curriculum
of Oral Biology in the School of Dentistry.
Chapel Hill 2016
Approved by: J. Timothy Wright Kimon Divaris Eric Everett Joel Parker
iii ABSTRACT
Shijia Hu: Unraveling the Transcriptome of Odontogenic Tumors (Under the direction of J. Timothy Wright)
Odontogenic tumors, represent 31% of the oral tumors in children, are phenotypically diverse neoplasms of tissues that are responsible for tooth formation. Ameloblastoma and keratocystic odontogenic tumor, both believed to be derived from the odontogenic epithelium, constitute more than 50% of odontogenic tumors. Although both are usually slow-growing, they are locally invasive and have a recurrence rate as high as 50-80%. The lack of established adjunctive therapy means that surgical removal of the tumor with extensive margins to ensure complete excision remains the primary treatment of choice, resulting in significant morbidity.
Tremendous advances are being made in the understanding of molecular mechanisms and pathways involved in tumorigenesis, improving diagnostic and therapeutic approaches. Most research on odontogenic tumors focused on candidate-genes with only a handful of studies employing whole genome and transcriptome approaches. Another limitation is the question of what normal tissue is most biologically-relevant for gene expression comparison with odontogenic tumors. Obtaining and characterizing the gene expression profile of
iv
This study aims to bridge the current gap of knowledge in odontogenic tumor biology by characterizing the transcriptome of ameloblastoma and KCOT which up till this point has not been fully explored.
The results showed that ameloblastoma separated into 2 distinct molecular clusters that were associated with 2 types of odontogenic tissue. Importantly, we found that 9/10 of the samples in the pre-secretory cluster were of the follicular type while 6/7 of the samples in the odontoblast cluster were of the plexiform type. Analysis of differential gene expression revealed alteration of common pathways in both clusters including cell cycle regulation,
inflammatory and MAPkinase. Similarly, 2 distinct molecular subtypes of KCOT were found with several canonical inflammatory pathways activated in both subtypes of KCOT. Of note, the AKT pathway was activated in one subtype while MAPkinase pathway was activated in the other.
Our results are suggestive of underlying molecular heterogeneity of odontogenic tumors which could indicate different receptiveness to treatment protocols. These findings have
v
ACKNOWLEDGEMENTS
The Dunning-Kruger effect (DuKE) is real. It is a cognitive situation whereby an individual is unable to recognize and evaluate their own ineptitude in a task accurately due to a lack of comprehension in the task in the first place (i.e. the stupid are too stupid to realize they’re stupid). When I started this program 5 years ago I definitely suffered from DuKE. Fortunately, I had many mentors guide me in this journey towards enlightenment. I could never fully express how thankful I am to this upstanding and noble community (unc) who have helped me in this chapter of my life; but like all PhD students, I can only try.
First and foremost, I need to thank Dr. Tim Wright. He has worn so many hats in my post-graduate career I am no longer sure how to define his impact on me. He was my mentor, my principal investigator, my committee chair, my department chair, attending and awesome dinner host. When I grow up, I want to be like Dr. Wright.
vi
I think the smartest thing I did for my time here was assembling a great committee. The intellectual exchange that occurred in those meetings had me in awe. Thank you Dr. Everett and Dr. Weissman, your time was greatly appreciated.
In addition, Ms. Cynthia Suggs has to be mentioned. She worked so hard on the
experiments and I greatly benefited from it. I would also like to thank my other co-authors Dr. Padilla and Dr. Murrah for your expertise and kind words when the papers got rejected time and again.
To all my comrades-in-arms from the Oral Biology program and the Pediatric Dentistry residency, I would never have survived these years in this foreign land without you guys. You welcomed me with open arms and picked me up when I was down. I came to America alone, but will be leaving family behind.
vii
TABLE OF CONTENTS
LIST OF TABLES ... xi
LIST OF FIGURES ... xii
LIST OF ABBREVIATIONS ... xiv
CHAPTER 1: INTRODUCTION ... 1
Odontogenic Tumors in Perspective ... 1
Tumorigenesis: What is currently known about Ameloblastoma and KCOT ... 3
The human dentome ... 6
Investigative approaches ... 9
Future implications ... 11
Conclusion ... 13
CHAPTER 2: TOWARDS UNRAVELING THE HUMAN TOOTH TRANSCRIPTOME: THE DENTOME ... 14
Abstract ... 15
Introduction ... 16
Materials and methods ... 18
viii
Laser capture of specific tissue ... 18
RNA Microarray ... 19
RTPCR ... 20
Data analysis ... 21
Results ... 21
Genes expressed during tooth formation... 22
Differential gene expression in enamel and dentin formation ... 22
Pathways important to enamel and dentin formation ... 29
Upstream Analysis ... 29
Discussion... 32
CHAPTER 3: AMELOBLASTOMA PHENOTYPES REFLECTED IN DISTINCT TRANSCRIPTOME PROFILES ... 38
Abstract ... 39
Introduction ... 40
Materials and methods ... 41
Tumor collection and preparation ... 41
Laser capture microdissection ... 42
RNA extraction and microarray ... 43
ix
Microarray gene expression validation using
NanoString ... 45
Results ... 45
NanoString validation ... 46
Determination of comparison tissue ... 46
Multiclass analysis ... 53
Pathway and gene set enrichment analysis ... 57
Upstream analysis ... 57
Correlation with The Cancer Genome Atlas ... 58
Discussion... 63
CHAPTER 4: TRANSCRIPTOME VARIABILITY IN KERATOCYSTIC ODONTOGENIC TUMOR SUGGESTS DISTINCT MOLECULAR SUBTYPES ... 67
Abstract ... 68
Introduction ... 69
Materials and methods ... 70
Patient recruitment and sample collection ... 70
Sample preparation ... 71
Microarray analysis ... 72
Determination of reference tissue and bioinformatics analysis ... 74
x
Results ... 78
Reference tissue and multiclass analysis ... 78
Canonical pathways and gene set enrichment analysis ... 83
Upstream analysis ... 87
Discussion... 89
CHAPTER 5: FINAL THOUGHTS AND FUTURE DIRECTIONS ... 93
xi LIST OF TABLES
Table 2.1: Top 20 differentially expressed canonical pathways
between odontoblasts and pre-secretory ameloblasts ... 30
Table 3.1: Fold change comparison between microarray and
NanoString expression data ... 48
Table 3.2: Canonical pathways differentially expressed in
ameloblastoma clusters ... 59
Table 3.3: Upregulated gene sets of ameloblastoma common tumor
clusters compared to normal cells ... 60
Table 3.4: Upstream analysis using Ingenuity Pathway Analysis ... 61
Table 4.1: Nano string validation of microarray ... 76
Table 4.2: IPA canonical pathway analysis between the different KCOT molecular clusters and reference odontogenic tissue ... 84
Table 4.3: Results of Gene set enrichment analysis (GSEA) conducted
between KCOT and reference cells using “all curated gene sets v4.0” ... 85
Table 4.4: Results of IPA Upstream analysis indicating significantly
xii
LIST OF FIGURES
Figure 1.1: Development of ameloblast and odontoblast ... 7
Figure 1.2: Micrograph of Laser microdissection ... 10
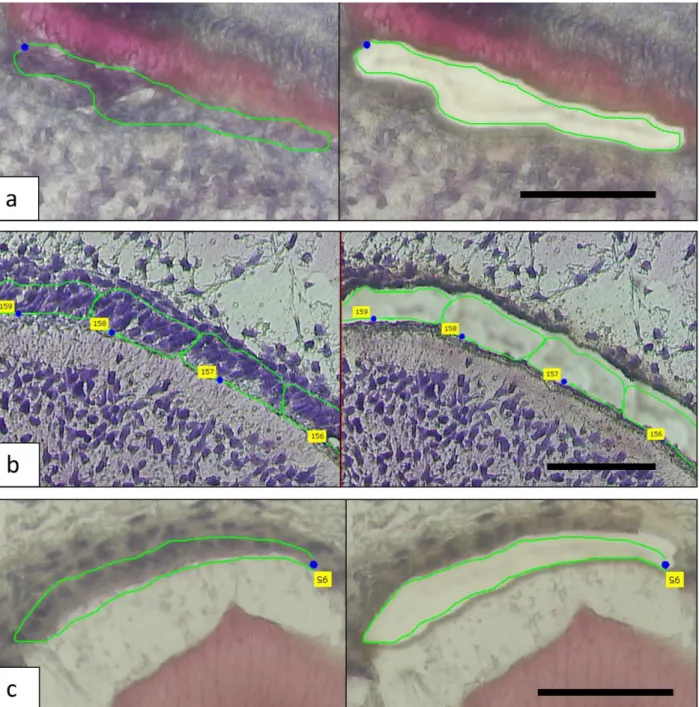
Figure 2.1: The micrographs show the laser capture of a – odontoblasts, b - pre-secretory ameloblasts and c – secretory ameloblasts ... 23
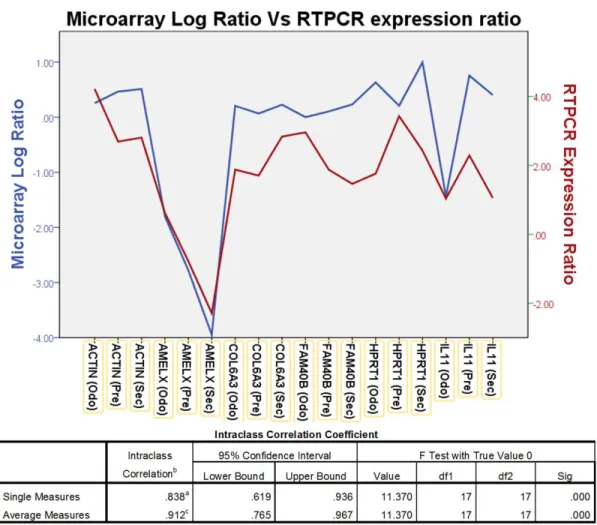
Figure 2.2: The graph shows comparison between the microarray Log ratio and RTPCR Log expression ratio ... 24
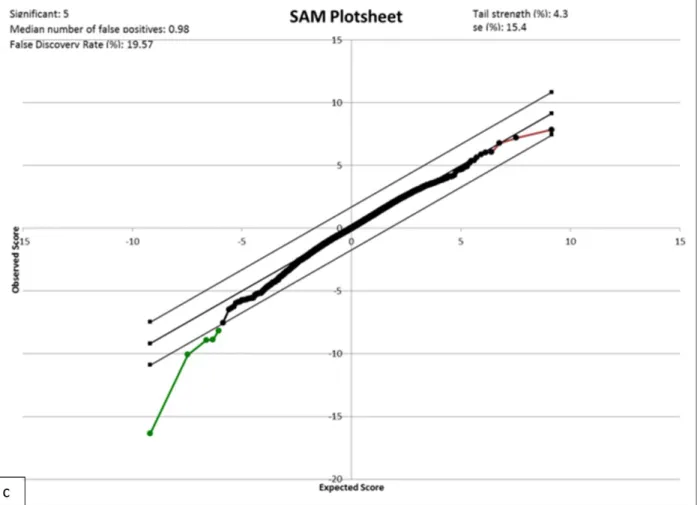
Figure 2.3: SAM plots ... 25
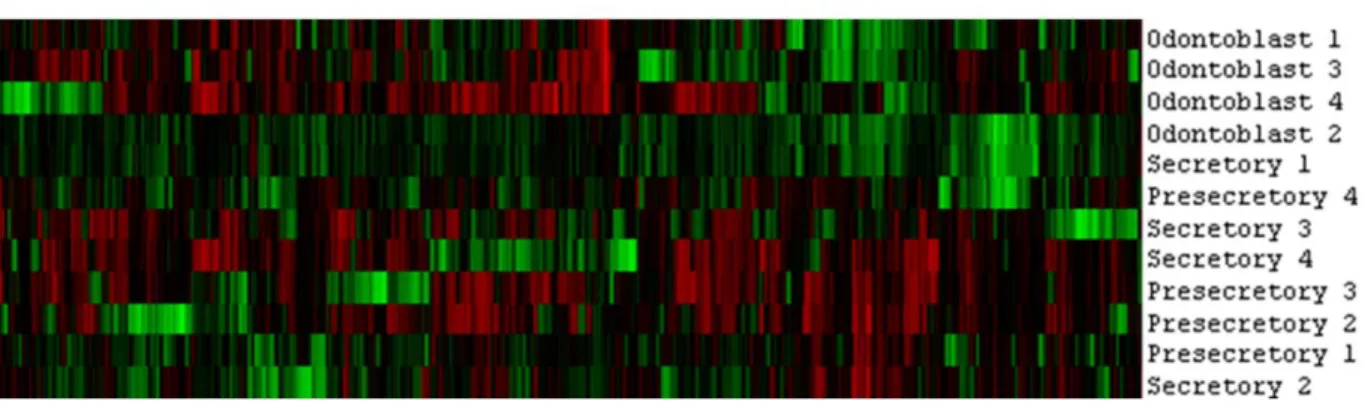
Figure 2.4: Heat map from cluster analysis ... 28
Figure 2.5: Upstream analysis ... 31
Figure 3.1: The micrographs show the laser capture of the epithelial portion of an ameloblastoma sample ... 47
Figure 3.2: Scatterplot of Microarray (x-axis) differential expression versus NanoString (y-axis) differential expression ... 49
Figure 3.3: Unsupervised hierarchical cluster analysis of reference tissue with tumor samples ... 50
Figure 3.4: Cluster analysis used to determine reference tissue ... 51
Figure 3.5: Multiclass and pathway analysis of the different tumor clusters ... 54
Figure 3.6: Correlation analysis with The Cancer Genome Atlas subtypes ... 62
Figure 4.1: The micrographs show the laser capture of the epithelial portion of a KCOT sample ... 73
xiii
Figure 4.3: Cluster analysis to determine reference tissue ... 79
Figure 4.4: Multiclass analysis and pathway analysis of the different tumor clusters ... 81
xiv
LIST OF ABBREVIATIONS
AKT1 Protein kinase B Alpha
ASTN1 Astrotactin 1
AMBN Ameloblastin
AMELX Amelogenin, X isoform
B3GALTL Beta 1,3-Galactosyltransferase-Like
BRAF v-Raf murine sarcoma viral oncogene homolog B
cDNA Complementary Deoxyribonucleic acid
COPZ2 Coatomer Protein Complex, Subunit Zeta 2
DMP1 Dentin matrix protein
EDTA Ethylenediaminetetraacetic acid
EFGR Epidermal growth factor receptor
ENAM Enamelin
EZH2 Enhancer Of Zeste 2 Polycomb Repressive Complex 2 Subunit
FDR False discovery rate
FFPE Formalin-fixed paraffin-embedded
xv GEO Gene Expression Omnibus
GSEA Gene set enrichment analysis
GWAS Genome-wide association study
HIF1A Hypoxia Inducible Factor 1, Alpha Subunit
IPA Ingenuity pathway analysis
IRB Institutional review board
KCOT Keratocystic odontogenic tumor
K-ras V-Ki-ras2 Kirsten rat sarcoma viral oncogene homolog
KRT19 Keratin 19
LCM Laser capture microdissection
LUM Lumican
MAPK Mitogen-activated protein kinases
MDM2 Mouse double minute 2 homolog
MEK Mitogen-activated protein kinase kinase
mRNA Messenger Ribonucleic acid
MSigDB Molecular Signatures Database
xvi NBCCS Nevoid basal cell carcinoma syndrome
NSAID Nonsteroidal anti-inflammatory drug
oAM Odontoblast-like ameloblastoma
OB Odontoblast
oKC Odontoblast-like Keratocystic odontogenic tumor
p53 Tumor protein p53
PA Pre-secretory ameloblast
pAM Pre-secretory ameloblast-like ameloblastoma
PI3K Phosphatidylinositol-4,5-bisphosphate 3-kinase
PTCH1 Protein patched homolog 1
RIN RNA Integrity Number
RNA Ribonucleic acid
RTPCR Reverse transcription polymerase chain reaction
SA Secretory ameloblast
SAM Significance Analysis of Microarrays
SEZ6L Seizure 6-like
xvii
sKC Secretory ameloblast-like Keratocystic odontogenic tumor
SOX2 SRY (sex determining region Y)-box 2
TCGA The Cancer Genome Atlas
WHO World Health Organization
1
CHAPTER 1: INTRODUCTION
Odontogenic Tumors in Perspective
Although odontogenic tumors are rare when compared to other head and neck tumors, they represent 31% of the oral tumors in children (Adebayo et al. 2002) and often are clinically challenging to manage. They represent a phenotypically diverse group of tumors that have shown differing prevalence among different populations, suggesting different genetic and/or environmental etiological factors. The 2 most prevalent odontogenic tumors are the
ameloblastoma (Avelar et al. 2011) and keratocystic odontogenic tumor (KCOT) (Servato et al. 2012). Both are believed to be derived from the odontogenic epithelium. Together, they constitute more than 50% of all odontogenic tumors (Buchner et al. 2006).
Ameloblastoma is a slow-growing, locally invasive, benign epithelial odontogenic
neoplasm. It is thought to arise from remnants of odontogenic epithelium of the tooth-forming enamel organ, also known as the cell rests of the dental lamina (Sehdev et al. 1974). This tumor exhibits epithelial cells resembling pre-ameloblasts on a basement membrane in loosely
arranged cells resembling stellate reticulum while the stroma consists of loose connective tissue. Although rare, ameloblastoma has been known to show malignant potential (Bedi et al. 2012) and occasionally metastasize (Luo et al. 2012). Currently, the WHO divides
ameloblastoma into 4 subtypes namely, 1) solid, 2) peripheral, 3) desmoplastic, and 4)
2
divided into a follicular and plexiform type while the much rarer unicystic ameloblastoma can be divided into the intraluminal and luminal types (Barnes L 2005). Current treatment
modalities range from conservative enucleation and curettage for the unicystic subtype to radical maxillectomy for follicular subtypes (Singh et al. 2014). A striking feature of
ameloblastoma is its penchant for recurrence with high recurrence rates (50-80%) being observed in cases of conservative treatment (Mendenhall et al. 2007). For this reason, and despite recent advances in imaging-assisted surgical margin localization, post-operative histological confirmation is still required. Meanwhile, intra-operative histological margin confirmation is challenging due to the calcified nature of the tumor and surrounding healthy tissue. This forces surgeons to either act conservatively risking the need for a second surgery, or act aggressively thus increasing morbidity (De Silva et al. 2012) and the need for extensive reconstructive surgery. This can be exceptionally devastating for young children due to their continued growth and development. Moreover, histological diagnosis can take up to 4 weeks and in cases of inadequate margins, patients will have to undergo further radiotherapy
increasing the morbidity associated with radiation to the head and neck region. Recently, a case report of a recalcitrant stage 4 ameloblastoma carrying a BRAF V600E mutation was
successfully treated with a combination of BRAF/MEK inhibitors (Kaye et al. 2015) raising the possibility of the increased use of chemotherapeutics in the treatment of ameloblastoma.
3
Histological features includes a thin fibrous wall of connective tissue surrounding an epithelial layer of columnar, pallisading, hyperchromatic basal cells with a cystic lumen filled with keratin (Grasmuck and Nelson 2010). As with the ameloblastoma, it can in rare cases undergo
malignant transformation (Tan et al. 2013). A high recurrence rate of up to 30% has been found following conservative treatment such as enucleation and curettage, creating a dilemma in determining the optimal extent of surgical resection to balance the risk of recurrence with the morbidity associated with extensive reconstruction. Although conservative treatment involving enucleation with application of Carnoy’s solution has recently been shown to be effective in reducing recurrence (Guler et al. 2012), larger lesions require more aggressive treatment. Of note, mutations in PTCH1, a tumor suppressor gene, causes the autosomal disorder Nevoid basal cell carcinoma syndrome (NBCCS) characterized by multiple basal cell carcinomas, KCOT and bifid ribs (Lam et al. 2013). These cases have higher recurrence rates when compared to isolated unifocal cases not associated with NBCCS (Johnson et al. 2012).
Tumorigenesis: What is currently known about Ameloblastoma and KCOT
Despite tremendous interest in these tumors, most published scholarship on this topic consists of case reports with a scant handful of genetic and molecular studies. Furthermore, in the majority of these studies, a bias selection of specific candidate genes or proteins were evaluated with little attention to genome-wide methods such as microarrays to describe the transcriptome of the tumors.
4
tumor showing a K-ras mutation (Kumamoto et al. 2004b). The follow up study showed altered expression of activated members of the MAPK pathway in ameloblastomas suggesting an involvement in oncogenesis and tumor cell differentiation (Kumamoto and Ooya 2007). Recently, involvement of the MAPK pathway in ameloblastoma tumorigenesis was further explored. Specifically, a V600E mutation in BRAF was described by 3 different groups (Brown et al. 2014; Kurppa et al. 2014; Sweeney et al. 2014) with Kruppa and colleagues finding BRAF mutations in 63% of ameloblastomas. Additionally, transgenic mouse models carrying the v-Ha-ras oncogene also have been found to develop ameloblastoma-like tumors spontaneously
which is rare in the wild type variant (Dodds et al. 2003). Interestingly, activation of the nuclear mTOR pathway has been found to increase the recurrence of ameloblastomas by a factor of 6.4 fold (Li et al. 2012).
Molecular studies of KCOT have linked PTCH1 mutations to the aggressiveness and recurrence of KCOT with PTCH1 mutation associated with a higher recurrence rate; however, patients carrying PTCH1 mutation also have nevoid basal cell carcinoma syndrome (Kadlub et al. 2013) while mutation of PTCH1 were found only infrequently (30%) in non-syndromic patients (Pan et al. 2009). Conversely, a recent study employing more sensitive techniques suggests that the proportion of sporadic KCOT with PTCH1 mutations could be greater than originally
believed with up to 80% of the cases affected (Qu et al. 2015). To date, the entire PTCH1
5
defects. If the pathway is aberrantly activated during adult life, it causes uncontrolled cell proliferation that manifests as cancer (Villavicencio et al. 2000).
Interestingly, there are a number of genes and pathways that could be active and important in the tumorigenesis of both ameloblastoma and KCOT. The elevated expression of p53 and MDM2 has been implicated in the development of both ameloblastoma and KCOT (Kumamoto et al. 2004a; Sharifi-Sistani et al. 2011). Recently, there has been interest in the WNT pathway being involved in the pathogenesis of ameloblastoma and KCOT. The WNT pathways are essential for tooth development and altered expression of WNT associated genes had been found in ameloblastoma (Kibe et al. 2013) and KCOT (Hakim et al. 2011). Specifically, WNT5a was found to be highly expressed in a mouse tumor model (Sukarawan et al. 2010) leading to speculation that differential activation of these molecular pathways leads to tumorigenesis.
6
This heterogeneity is a reflection of the lack of agreement on what constitutes the most biologically-relevant tissue for comparison. Given that odontogenic tumors are thought to be derived from the normal tissues involved in tooth formation, an appropriate comparison would be the normal odontogenic tissue transcriptome.
The human dentome
There is a need to address this lack of a normal tissue/cell‑of‑origin material for the
examination of differential gene expression with the odontogenic tumors. The tissue of comparison will determine which genes and pathways are deemed different in the tumor. Using an inappropriate tissue for comparison can cloud the picture of pathways that are important to tumorigenesis. Ameloblastomas and KCOTs arise from the odontogenic
epithelium. Obtaining the gene expression profile of odontogenic epithelium at different stages of development will help identify the tissue and developmental stage that most closely
resembles the tumor tissue. This will aid in elucidating aberrant pathways present in odontogenic tumors compared with normal odontogenic tissue.
Tooth formation or odontogenesis is strictly regulated at the molecular level and involves multiple complex processes including development of highly specialized cells that produce unique extracellular matrices and ultimately mineralized tissues. Human enamel and
7
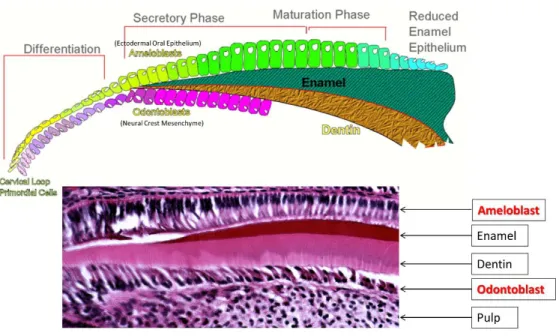
Figure 1.1: Development of ameloblast and odontoblast. Ameloblast is derived from
ectodermal oral epithelium and undergo stages of differentiation (pre-secretory), secretory and maturation before undergoing apoptosis with the remaining cells contributing in the
development of gingival attachment. Odontoblast is derived from the neural crest mesenchyme and remain functional throughout the tooth’s life. Both tissue exist in a pseudo-single layer while odontoblast is sandwiched by hard tissue (dentin) and a cell rich matrix (pulp). With permission from Dr. Tim Wright.
The oral epithelium invaginates into the underlying mesenchymal tissue during the early stages of odontogenesis and gives rise to ameloblasts, the cells that form enamel. The
ameloblasts undergo extensive histodifferentiation during their life cycle, going from cuboidal to columnar to squamous morphologies while creating and regulating a unique and changing microenvironment and extracellular matrix (Simmer et al. 2012). During the process of
8
ameloblasts alter their morphology again to facilitate maturation and further mineralization of the enamel. Upon completion of the enamel maturation process, the ameloblasts then become a protective covering until the tooth crown emerges into the oral cavity. At which point, most of the ameloblasts undergo apoptosis and cease to exist with the remaining cells contributing in the development of gingival attachment. Developing ameloblasts exist as a pseudo-single cell layer making it extremely challenging to the harvest and examine them. It is also known that some less differentiated cells of the dental lamina persists in the oral cavity (e.g. epithelial cell rests of Malassez) after odontogenesis and it is theorized that these cells undergo
tumorigenesis and form odontogenic tumors (Juuri et al. 2013; Partridge and Towers 1987; Sehdev et al. 1974).
In contrast, dentin-forming odontoblasts that are derived from the odontogenic mesenchyme continue to lay down matrix and remain functional throughout the tooth’s life (Couve et al. 2013). These cells are able to react to stimuli and lay down reparative or
reactionary dentin when the tooth experiences environmental insults. During odontogenesis, ameloblasts from the dental epithelium are involved in molecular cross talk with the underlying mesenchymal cells which ultimately form odontoblasts (Jernvall and Thesleff 2000). Although odontoblasts persists throughout the life of the tooth, like ameloblasts, they present as a pseudo-single layer. In addition, the odontoblast cell layer is sandwiched between a highly mineralized layer (the dentin), and a cell rich layer (the pulp) making its study just as, if not more, difficult than ameloblast.
9
associated with ameloblast and odontoblast development and function such as tooth agenesis (Thesleff et al. 2001) and amelogenesis imperfecta (Stephanopoulos et al. 2005).
Investigative approaches
Laser capture microdissection (LCM) is a technique that allows the isolation of specific cells from microscopic regions of tissue samples (Decarlo et al. 2011) (Figure 1.2). This
technique can be applied to frozen sections (Hayashi et al. 2010) or archival tissues embedded in paraffin (Salmon et al. 2012). Because LCM does not change or damage the target cell
10
Figure 1.2: Micrograph of Laser microdissection. The arrow shows the cells of interest in all panels. Panel C shows the tissue left behind after LCM while panel D shows the capture of the target cells. With permission from Dr. Tim Wright.
Whole genome microarray allows for entire transcriptome examination of target tissue samples providing a global picture of cellular activity. Traditionally, a 2-color microarray
11
compare data from future studies when the same commercially available standardized reference RNA is used for normalization.
The development and refinement of molecular pathway analysis software aids in the analysis of gene expression data. Using this analytical approach allows us to build on existing knowledge from candidate gene studies, to examine upstream regulators and downstream effectors responses to gene expression changes of these genes of interest, as well as identify driver genes and derive a better understanding of the tumorigenesis of odontogenic tumors (Thomas and Bonchev 2010). Pathway analysis organizes genes into categories based on location, cellular components and reported molecular functions, facilitating assembly of nodes for the analysis of genetic networks and canonical pathways available in the database which will aid in our understanding of the pathogenesis of ameloblastoma and KCOT. Most diseases are complex and multi-factorial and result from the interaction of numerous genetic and environmental factors. The use of pathway analysis has advantages over the candidate gene approaches in this regard. The molecular approach using multi-omic techniques had helped unravel the molecular heterogeneity of breast cancer (Cancer Genome Atlas 2012) and
understand the molecular pathogenesis of human hepatocellular carcinoma (Thorgeirsson and Grisham 2002).
Future implications
12
couple, are likely controlling essential processes involved in normal odontogenesis and are worth closer examination. Unravelling the human dentome will advance our knowledge of tooth formation and the critical events that are regulated by gene expression and that control cell function and development of the tooth. This information can be used for establishing models for tooth development studies and ultimately pave the way for novel treatment for several tooth malformation disorders. For example, the use of a recombinant ectodsyplasin A in dogs can significantly reduce the burden of ectodermal dysplasia, a syndrome in human which includes multiple missing teeth (Casal et al. 2007). Establishing a good tooth development model can be used for developing similar novel therapeutics for the hundreds of hereditary defects affecting teeth.
Comprehensive molecular portraits of many cancers utilizing whole transcriptome approaches (Cancer Genome Atlas 2012) have led to a better understanding of genomic aberrations and other events driving tumor biology. This knowledge is leading to the
identification of therapeutically tractable pathways and more effective therapies. The current paucity of knowledge of tumorigenesis in odontogenic tumors means that treatment is still limited to surgical intervention and the need for extensive and devastating reconstructive surgery. Recently, chemotherapeutic agents have been used successfully in dogs for the
13
Furthermore, we anticipate that the characterization of the transcriptome will elucidate molecular pathways and provide a rationale for the mutational analysis of genes strongly implicated in tumorigenesis. These findings can then be used to identify more specific
molecular markers for tumor diagnosis and improve the identification of surgical margins using biological markers rather than traditional histopathology (Otero et al. 2013). As a corollary example, it was shown recently that the use of mass spectrometry to identify molecular markers in brain tumors correlated well with histological diagnosis, offering the potential for surgeons to maximize tumor resection while preserving function (Eberlin et al. 2013). A similar discovery of detectable molecular markers in odontogenic tumors could greatly enhance surgical margin determination and improve current treatment strategies.
Conclusion
In summary, this study aims to bridge the current gap of knowledge in odontogenic tumor biology by characterizing the transcriptome of ameloblastomas and KCOTs which up until now has not been fully explored. A comprehensive molecular profile can serve as a hypothesis-generating resource for the advancement of precision medicine for the diagnosis and treatment of odontogenic tumors. In addition, the genes and pathways found to be associated with
14
CHAPTER 2: TOWARDS UNRAVELING THE HUMAN TOOTH TRANSCRIPTOME: THE DENTOME
Shijia Hu1,2, Joel Parker3, John Timothy Wright1
15 Abstract
The goal of the study was to characterize the transcriptome profiles of human
ameloblasts and odontoblasts, evaluate molecular pathways and advance our knowledge of the human “dentome”. Laser capture microdissection was used to isolate odontoblasts and
ameloblasts from human tooth buds (15-20week gestational age) from 4 fetuses. RNA was examined using Agilent 41k whole genome arrays at 2 different stages of enamel formation, presecretory and secretory. Probe detection was considered against the array negative control to control for background noise. Differential expression was examined using Significance
Analysis of Microarrays (SAM) 4.0 between different cell types and developmental stages with a false discovery rate of 20%. Pathway analysis was conducted using Ingenuity Pathway Analysis software. We found that during primary tooth formation, odontoblasts expressed 14,802 genes, presecretory ameloblasts 15,179 genes and secretory ameloblasts 14,526 genes. Genes known to be active during tooth development for each cell type (eg COL1A1, AMELX) were shown to be expressed by our approach. Exploring further into the list of differentially
16
human dentome and related molecular pathways provides new insights into the complex mechanisms regulating odontogenesis and biomineralization. This knowledge could prove useful in future studies of odontogenic related pathologies.
Introduction
Tooth formation or odontogenesis is strictly regulated at the molecular level and involves multiple complex processes including development of highly specialized cells that produce unique extracellular matrices and ultimately mineralized tissues including the hardest tissue in the body, enamel (Thesleff et al. 2001). Ameloblasts, the cells that form enamel, undergo extensive histodifferentiation during their life cycle going from cuboidal to columnar to squamous morphologies while creating and regulating a unique and changing
microenvironment and extracellular matrix (Deutsch et al. 1995; Simmer et al. 2012). During
the process of producing a unique extracellular matrix, the ameloblasts move in a highly organized manner to produce enamel prisms that are directionally oriented into three dimensional patterns that are species specific (Bartlett and Smith 2013).
17
The roles of specific genes and pathways involved in tooth development have been queried by numerous investigators using the murine model (D'Souza et al. 1999; Dassule and McMahon 1998; Jarvinen et al. 2006; Kim et al. 2012). Many human studies of odontogenesis have focused on single genes and pathways that are disease driven (Bergendal et al. 2011; Liu and Millar 2010; Rufini et al. 2011). The study of human odontogenesis is challenging due to the issue of obtaining samples at different developmental stages and the difficulty in isolating the different tissue components of the developing tooth bud. Most research has been based on the examination of entire tooth buds (Heikinheimo et al. 2002; Lin et al. 2007) which does not allow interrogation of the disparate tissues present in a developing tooth.
Laser capture microdissection (Decarlo et al. 2011) allows the isolation of specific cells from microscopic regions of tissue samples (Chokechanachaisakul et al. 2012; Sun et al. 2012).
18
The objective of this study was to characterize the gene expression profiles of human ameloblasts and odontoblasts and to further unravel the transcriptome of human teeth that we call the dentome. The investigation reveals many genes and molecular pathways not previously known to be involved in tooth formation that appear to be important.
Materials and methods
Tissue collection and preparation
Written consent was obtained from mothers that were preparing for elective abortions in this IRB approved protocol through the University of North Carolina-Chapel Hill Office of Human Research Ethics. Four human fetuses were obtained at ages 15-20 weeks gestation, immediately placed on ice and the tooth buds dissected from the jaws, placed in RNAlater and refrigerated at 4C for 1-4 weeks to allow decalcification in Richard Allan Scientifics’ decalcifiying solution (ThermoScientific, Grand Island, NY, USA). The tissue was then frozen and stored at -80oC. The tissue was sectioned at -35C at a thickness of 7 microns and lightly stained with haematoxylin and eosin to allow better visualization of the different cell types. Only anterior teeth from both the maxillary and mandibular jaws were used due to similar stage of dental development.
Laser capture of specific tissue
19
assigned to specific developmental stages based on the presence or absence of visible enamel matrix at the light microscope level and cell morphology (e.g. presence of Tomes Process). Cells isolated before enamel apposition were designated as being in the pre-secretory stage and if enamel extracellular matrix was visible the ameloblasts were classified as being in the secretory stage. Odontoblasts adjacent to the enamel epithelium secrete the predentin matrix and were harvested predominantly after some dentin matrix secretion. This process allowed
standardization of the cell’s developmental stage despite slight differences in an individual tooth bud’s stage of development.
During the microdissection procedure, a CapSure (ThermoFisher, Grand Island, NY, USA) cap is positioned over the tissue section. At the end of the LCM procedure the transparent thermoplastic film that covers the cap was peeled off with the attached cells of interest and
placed into RNA extraction buffer. Images were obtained of the tissue sections before and after LCM, including the captured regions.
Total RNA was isolated from the microdissected cells with the PicoPure RNA Isolation kit (Arcturus Bioscience, Santa Clara, CA, USA). The quality and yield of total RNA were assessed on an Agilent Bioanalyzer 2100 (Agilent Technologies, Palo Alto, CA, USA). Samples from each cell type were then sent for analysis to determine the RNA Integrity Number (RIN).
RNA Microarray
Four samples each of odontoblasts, pre-secretory ameloblasts and secretory
20
200ng of RNA for each sample. This gave us a total of 4 different samples of each cell type for microarray analysis. Whole genome human oligonucleotide microarrays (41K Agilent) were used to examine gene expression of the different tissue. The arrays contain 44K 60-mer oligonucleotides representing over 41K human genes and transcripts.
Two hundred nanograms of total RNA was converted into labeled cRNA with nucleotides coupled to fluorescent dye Cy3 using the Low RNA Input Linear Amplification Kit (Agilent
Technologies, Palo Alto, CA) following the manufacturer’s protocol. The Human Universal Reference RNA from Stratagene (Santa Clara, CA, USA) was coupled with Cy5.
Cy3-labeled cRNA (1.65 ng) from each sample was hybridized to Agilent whole genome array 41k formated chips. The hybridized array was then washed, scanned and data was extracted from the scanned image using Feature Extraction version 9.5 (Agilent Technologies, Palo Alto, CA). The microarray data is then submitted to the Gene Expression Omnibus (GEO) microarray database (accession number GSE63289).
RTPCR
RNA from a sample each of pre-secretory ameloblasts, secretory ameloblasts and odontoblasts were compared to the Human Universal Reference RNA from Stratagene by probing for high intensity, medium intensity and low intensity levels of expression based on the microarray data. The probes ACTIN, AMELX, COL6A3, FAM40B, HPRT1, IL11 were selected based on intensity levels obtained from the microarrays. RTPCR was performed using QIAGEN RT2 qPCR Primer Assays (Frederick ,MD, USA) in an Eppendorf Mastercycler gradient
21
calculated between microarray log ratio and RTPCR expression ratio using SPSS 21 (IBM, Armonk, NY, USA).
Data analysis
Unbiased cluster analysis was carried out on the samples using Cluster 3.0 (open source) and the heat maps visualized using Java TreeView-1.1.6r2 (open source).
For the expression data, each microarray was examined and the minimum intensity for expression was set at 95% confidence of the negative controls on that array. The lists were crossed referenced and only genes that were expressed in all 4 samples for each tissue type was determined to be expressed. Differential expression was examined using Significance analysis of microarrays (SAM) 4.0 between the different stages of ameloblasts and different tissues. The false discovery rates of the SAM analyses were set at 20%.
Ingenuity pathway analysis was used to examine the pathways of the differential expression between the samples specifically focusing on the upstream analysis.
Results
22 Genes expressed during tooth formation
Laser capture microdissection allowed us to obtain small discrete areas of cells at relatively specific developmental stages from human tooth bud tissues (Figure 2.1). Using the negative control spots to eliminate background at 95% confidence level, we found that during tooth formation odontoblasts expressed 14,802 genes, pre-secretory ameloblast expresses 15,179 genes and secretory ameloblast expresses 14,526 genes.
Differential gene expression in enamel and dentin formation
To validate the overall gene expression levels observed in the microarrays we performed RTPCR on selected genes in the samples and compared them with the standard reference RNA used in the microarray. The RTPCR analysis showed a intraclass correlation coefficient of 0.838 (p<0.05) for single measures, suggesting good correlation for genes (ACTIN, AMELX, COL6A3, FAM40B, HPRT1, IL11) that had high, moderate and low levels of expression
on the microarray (Figure 2.2).
Using SAM analysis, we looked at differential gene expression between the different tissues at a false discovery rate of 20%. From the SAM plots (Figure 2.3) and unbiased cluster analysis (Figure 2.4), we observed that the greatest gene expression difference was between odontoblasts and pre-secretory ameloblasts.
23
ameloblasts; 4 genes (DMP1, AMBN, COPZ2, B3GALTL) were expressed at lower levels in pre-secretory compared with pre-secretory ameloblasts.
24
27
28
29 Pathways important to enamel and dentin formation
The Ingenuity Pathway Analysis program uses an extensive database of canonical pathways to analyze the differentially expressed genes, the pathways they are involved in and examine the activated and/or inhibited pathways. Pathway analysis shows that the 2 networks with the greatest difference between odontoblasts and pre-secretory ameloblasts are mainly collagen and NF-κB driven. There were minimal differences for odontoblasts compared to secretory ameloblasts and pre-secretory compared to secretory ameloblasts.
Some of the canonical pathways that are different between odontoblasts and pre-secretory ameloblasts include - Intrinsic Prothrombin Activation Pathway, Hepatic Fibrosis / Hepatic Stellate Cell Activation, Atherosclerosis Signaling, Phospholipase C signaling, ERK5 signaling and Sphingosine-1-phosphate signaling. (Table 2.1)
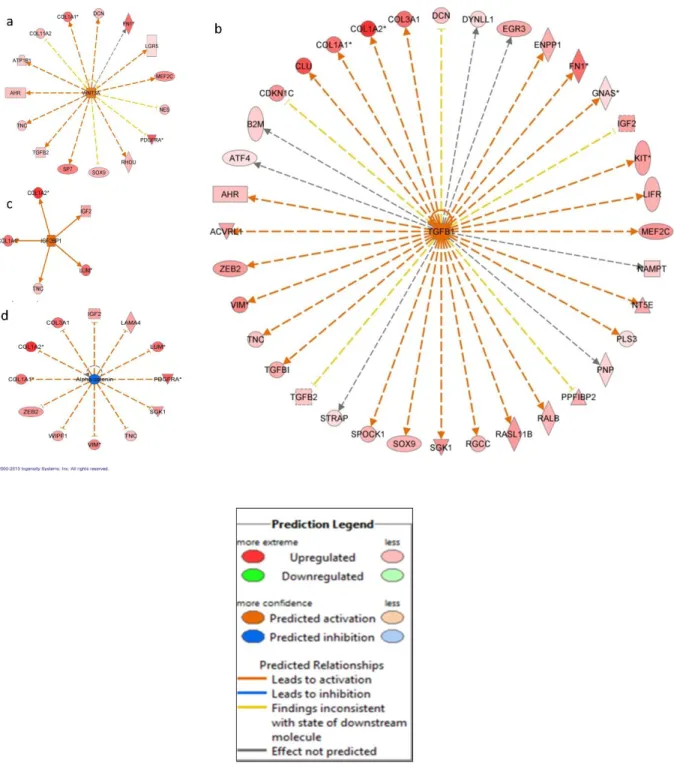
Upstream Analysis
An upstream analysis examines current levels of gene expression detected by the microarray analysis and predicts which upstream regulators were most likely to be involved. Our analysis indicated that numerous upstream regulators were predicted to be different between odontoblasts and pre-secretory ameloblasts. Of note we found that WNT3A, TGFB1, IGF2BP1, SHH, GLI1 and FGF2 were predicted to be significantly more active in odontoblast
31
32 Discussion
Examination of murine tooth development using many different approaches suggested that more than 300 genes are involved in the tooth formation (Nieminen et al. 1998). More recently, the use of microarrays showed that 4362 genes are differentially expressed (Landin et al. 2012), suggesting that in fact large numbers of genes are involved. We showed that a much larger portion of the human genome is involved in the development of the human tooth. Many of the 14,802 genes and 15,179 genes expressed by odontoblasts and ameloblasts respectively are involved in basic cellular functions rather than tooth development specific functions. Other investigators found that various types of tissue express between 10,000 to 14,000 genes with an upper limit of 17,000 genes (Jongeneel et al. 2003). The present study clearly shows that the molecular control of odontogenesis is extremely complex and involves many more genes and molecular pathways than previously known.
Our observation that secretory ameloblast expression profile was more similar to odontoblast expression as compared with pre-secretory ameloblast was unexpected. This finding is likely due to secretory ameloblasts and odontoblasts sharing many similar characteristics as both are differentiated cells, are secreting an extracellular matrix, are controlling the microenvironment of that matrix, and are motile and moving away from the secreted matrix. This is in contrast to the pre-secretory ameloblasts that are in the process of differentiation, are not motile, and not secreting an extracellular matrix. As ameloblasts
33
As expected, the SAM analysis showed significantly higher expression of known dentin products such as collagen type 1, collagen type 3 in odontoblasts when compared to pre-secretory ameloblasts. Our findings showed that the ENAM and AMELX genes which code for the enamel specific extracellular matrix proteins enamelin and amelogenin respectively were expressed at higher levels in enamel forming secretory ameloblasts. These differences in gene expression are reflective of the unique extracellular matrices produced by these different cell types and ultimately the compositionally and structurally different mineralized tissue they create.
Interestingly, fibronectin (FN1) and lumican (LUM), showed greater levels of expression in odontoblasts compared with pre-secretory ameloblasts. The proteins derived from these genes are thought to be involved in the organization of extracellular matrix (Kadler et al. 2008;
34
these different odontogenic cell types but it is known that motility is critical in the normal formation and structure of the mineralized dentin and enamel. The other differentially expressed genes have been implicated in various other pathologies such as Peters' plus syndrome with cleft lip/palate (B3GALTL) (Schoner et al. 2013), tumor formation (COPZ2) (Shtutman et al. 2011) and lung cancer development (SEZ6L) (Gorlov et al. 2007) but have not yet been associated with tooth development.
35
Examination of upstream regulators showed that SHH, GLI1, FGF2 and TGFB1 are likely involved in dentinogenesis. This finding was expected as these genes have been well
characterized to be involved in tooth formation and the disturbances of these genes are known to lead to tooth malformation and agenesis (Cobourne et al. 2001; Lee et al. 2011; Pispa et al. 1999). Upstream analysis also indicated that both WNT3A and TGFB1 are activated in
odontoblasts (Figure 2.5a-b). Recent investigation of Schimke immuno-osseous dysplasia, a syndrome associated with mutations of the SMARCAL1 gene shows there are cellular
disturbance in the expression of WNT3A and TGFB1 as a result of abnormal SMARCAL1. Patients with this rare condition exhibit microdontia, hypodontia and severe molar root hypoplasia (Morimoto et al. 2012). These findings suggest that these pathways could be important in root formation and tooth morphogenesis.
The present study also found that IGF2BP1 was identified as an active upstream regulator in odontoblasts (Figure 2.5c) and a human GWAS showed that it is one of the loci associated with tooth agenesis (Pillas et al. 2010). IGF2BP1 has also been implicated in the upregulation of betaTrCP1 leading to the activation of beta-catenin/Tcf signaling (Noubissi et al. 2006) that is important in beta-actin mRNA translation and cell migration. This pathway
provides a possible mechanism for the movement of odontoblasts as it deposits newly formed dentin.
36
Bossche et al. 2012). The nature and complexity of movement has been shown to be quite different between odontoblasts and ameloblasts. A recent paper described the importance of MMP20 and the cadherin complexes during ameloblast maturation to allow movement of the epithelial cells by the switching of cadherin types (Guan and Bartlett 2013).
One of the shortcomings of this study is that we were only able to obtain primary tooth buds for examination. It is likely that there are differences between the dentome of primary and permanent teeth; however, permanent tooth buds were not available in our study sample. Future studies of permanent tooth buds using similar protocols will shed light on the
differences between the dentome of primary and permanent teeth. Later stages of tooth formation were not evaluated as the later stages of tooth formation (e.g. maturation) were not available. In addition, although the use of the LCM aids in providing a relatively discrete sample, there is still a possibility of contamination from adjacent cell layers such as the stratum
intermedium collected with the ameloblasts. Furthermore, we did not analyze cementum or root forming cells, leaving the dentome incomplete at the moment.
In summary, our results support the utility of laser capture microdissection as a valuable tool that allows interrogation of different tissues and cell types present in human teeth during different stages of development. The use of laser capture and RNA microarrays shows that the early developing human tooth transcriptome involves more genes than anticipated and diverse molecular pathways that are differentially activated in the tooth forming cells. We identified genes and pathways not previously known to play a role in tooth formation. For example, the genes and pathways involved in cell movement may be essential processes in normal
37
38
CHAPTER 3: AMELOBLASTOMA PHENOTYPES REFLECTED IN DISTINCT TRANSCRIPTOME PROFILES
Shijia Hu1,2, Joel Parker3, Kimon Divaris1,4, Ricardo Padilla5, Valerie Murrah5, John Timothy Wright1
1Pediatric Dentistry, School of Dentistry University of North Carolina-Chapel Hill, Chapel Hill, NC,
USA
2Faculty of Dentistry, National University of Singapore, Singapore
3Cancer Genetics, University of North Carolina-Chapel Hill, Chapel Hill, NC, USA
4Epidemiology, Gillings School of Global Public Health, University of North Carolina-Chapel Hill,
Chapel Hill, NC, USA
5Diagnostic Sciences, School of Dentistry, University of North Carolina-Chapel Hill, Chapel Hill,
39 Abstract
Ameloblastoma is a slow growing, locally invasive benign epithelial odontogenic neoplasm derived from odontogenic epithelium. Although relatively rare, it makes up 40-50% of odontogenic tumors. A high recurrence rate of 50-80% with conservative treatment in some sub-types warrants radical surgical resections resulting in high morbidity. Ameloblastoma presents with diverse phenotypes which have yet to be characterized at the molecular level. The objective of the study was to characterize the transcriptome of ameloblastoma and identify relevant genes and molecular pathways using normal odontogenic tissue for comparison. Seventeen patients with ameloblastoma formed the study sample. Laser capture
microdissection was used to obtain discrete samples of neoplastic epithelial tissue from excised tumors which were examined using the Agilent 44k whole genome microarray and the
NanoString nCounter system. Odontogenic tissue transcriptome (human “dentome”) was used as reference for cluster, fold change, pathway and gene set enrichment analyses. The
ameloblastomas separated into 2 distinct molecular clusters that were associated with 2 types of odontogenic tissue, namely secretory ameloblast and odontoblast. Within the pre-secretory cluster, 9/10 of ameloblastoma samples were of the follicular type while 6/7 of the samples in the odontoblast cluster were of the plexiform type (p<0.05). Analysis of differential gene expression revealed alteration of common pathways in both clusters including cell cycle regulation, inflammatory and MAP kinase. The pre-secretory ameloblast cluster exhibited higher activation of inflammatory pathways while the odontoblast cluster showed greater disturbances in transcription regulators. Known cancer-driving genes such as TP53 and
40
results are suggestive of underlying inter-tumor molecular heterogeneity of ameloblastoma, where different clinical phenotypes show different molecular signatures and involve different pathways. These findings highlight the molecular heterogeneity of ameloblastoma sub-types and may have implications in the tailored use of other treatment modalities.
Introduction
Ameloblastoma is a slow-growing, locally invasive, benign epithelial odontogenic neoplasm. It is thought to be arise from SOX2-expressing dental lamina epithelium (Juuri et al. 2013), remnants of the tooth-forming enamel organ (Sehdev et al. 1974). The tumor exhibits epithelial cells resembling pre-ameloblasts on a basement membrane in loosely arranged cells resembling stellate reticulum while the stroma consists of loose connective tissue. Although odontogenic tumors are relatively rare, they constitute 3.8% of head and neck pathology, of which 40-50% are ameloblastoma (Avelar et al. 2011; Siriwardena et al. 2012). Occasionally, ameloblastomas show malignant features or transform into malignancy (Uzawa et al. 2015) and in rare cases metastasize (Luo et al. 2012). Current treatment modalities range from
conservative enucleation to radical excision and vary according to tumor subtypes and location (Reichart et al. 1995; Singh et al. 2014). High recurrence rates (50-80%) have been observed in cases of conservative treatment (Mendenhall et al. 2007). Consequently, and despite recent advances in imaging-assisted surgical margin localization, post-operative histological
41
There are few genomics and transcriptomics studies of ameloblastoma, with most investigations focusing on candidate-genes. Moreover, different comparison tissues were used in the handful of microarray studies; including gingival tissue (Carinci et al. 2003; Heikinheimo et al. 2015b), whole tooth buds (Heikinheimo et al. 2002), dentigerous cysts (Lim et al. 2006) and a universal human reference RNA (DeVilliers et al. 2011). Furthermore, whole tumor samples were used in these studies which includes large portions of stromal tissue. In spite of the heterogeneity in comparison tissue, there have been advances in understanding
tumorigenesis of ameloblastoma.
A recent study examining the whole transcriptome of ameloblastoma suggested the existence of distinct molecular subtypes (Heikinheimo et al. 2015b). It is envisaged that better understanding of the molecular basis of ameloblastoma can aid the identification of diagnostic and prognostic markers and may lead to the development of novel, personalized treatment protocols (Gomes et al. 2014). To address this knowledge gap, we embarked on this study aiming to characterize the transcriptome of neoplastic ameloblastoma tissue and identify relevant molecular pathways and genes, using a whole genome microarray.
Materials and methods
Tumor collection and preparation
Written informed consent was obtained from 17 subjects diagnosed with
42
paraffin-embedded (FFPE) samples were retrieved from the archives of the Department of Oral and Maxillofacial Pathology Laboratory, UNC School of Dentistry. All samples were evaluated by a board-certified oral and maxillofacial pathologist and at least one other author and diagnoses were classified based on the 2005 WHO Histologic Classification of Odontogenic Tumors. Additional demographic data including gender, age, race, and tumor recurrence were recorded and examined for potential associations.
Dissected tumors were placed in RNAlater and Richard Allan Scientifics’ decalcifying solution (water, hydrochloric acid, EDTA, tetrasodium tartrate and potassium tartrate) at 4oC for 1-4 weeks before 7µm sections were obtained under RNAse-free conditions (DeVilliers et al. 2011). The sections were then used for laser capture microdissection (LCM).
Laser capture microdissection
The ability of LCM to isolate one cell-thick discrete tissue populations (Hayashi et al. 2010) facilitates the targeting and pooling of neoplastic epithelial portions of ameloblastoma. The AutoPixTM automated LCM system (Arcturus Engineering, Santa Clara, CA, USA) was used to isolate tumor cells (basal epithelial cells adjacent to the basement membrane). Images of the tissue sections including the captured regions were obtained before and after LCM.
RNA extraction and microarray
43
RNA. Amplification was completed on all samples using TargetAmpTM 2-Round Aminoallyl-aRNA Amplification Kit (Epicentre Biotechnologies, Madison, WI, USA). RIN values ranged from 2.3 to 4.9 with a mean of 3.0 ± 0.85.
RNA was then analyzed using whole genome human oligonucleotide microarrays (41K Agilent) containing 44 thousand 60-mer oligonucleotides representing over 41 thousand human genes and transcripts. For this step, 200ng of RNA was converted into labeled cRNA with
nucleotides coupled to fluorescent dye Cy3 using the Low RNA Input Linear Amplification Kit (Agilent Technologies, Palo Alto, CA) according to the manufacturer’s protocol. The Human Universal Reference RNA from Stratagene (Santa Clara, CA, USA) was coupled with Cy5. Cy3-labeled cRNA (1.65 ng) from each sample and the Cy5-Cy3-labeled universal reference was
hybridized to the Agilent whole genome array 41k formatted chips. Data were extracted using Feature Extraction version 9.5 (Agilent Technologies, Palo Alto, CA). Background subtraction and Loess normalization were performed using default setting of the Agilent extractor. The use of the universal RNA facilitated the use of the dentome as a comparison. It acts as a technical intra/inter normalizing control, decreasing variability by measuring signal output ratio of experimental to reference RNA rather than relying on absolute signal intensity two-color hybridization experiments (Novoradovskaya et al. 2004). The dentome consists of odontogenic tissue (microdissected samples of human odontoblasts, pre-secretory ameloblasts and
44
tissue was collected from a single tooth bud with each of the 3 buds providing a single type of odontogenic tissue or developmental stage. (Gene Expression Omnibus microarray database accession number GSE63289)
The ameloblastoma expression data were submitted to the Gene Expression Omnibus microarray database (accession number GSE68531).
Microarray data analysis
A multiclass analysis was conducted between the 3 types of odontogenic tissue and the 60 genes differentially expressed at a false discovery rate (FDR) < 20% were designated as the odontogenic tissue-defining genes. The most appropriate comparison tissue was decided to be the normal tissue with the most similar profile to ameloblastoma, such that identified
differences would be tumor specific. Cluster analysis was conducted using Cluster 3.0 between the 3 normal and tumor samples and visualized using Java TreeView-1.1.6r2.
45
Microarray gene expression validation using NanoString
A variety of approaches have been used to validate microarray data in the literature and
NanoString was selected for the study. A random subset of 3 ameloblastoma and 2 control odontogenic tissue samples was used to validate the microarray gene expression data.
NanoString nCounter (Seattle, WA, USA) high throughput gene expression analysis (Geiss et al. 2008) was performed using the Human Cancer Reference codeset
(http://www.nanostring.com/products/gene_expression_panels). Each reaction contained 50 ng of total sample RNA plus reporter and capture probes. Digital counts were extracted, normalized and analyzed using nSolver v2.5 software. Differential expression between ameloblastoma and pre-secretory ameloblast from nanoString was compared with that obtained from the microarray.
Results
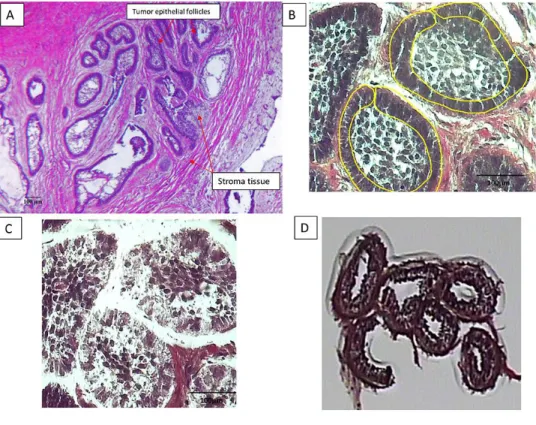
LCM facilitated the isolation of basal epithelial (neoplastic) cells from the tumor samples (Figure 3.1) without contamination from surrounding stroma cells. RNA was extracted from the LCM samples, with the 260/280 ratio for the 17 samples between 1.7-2.1 and a yield of
46 NanoString validation
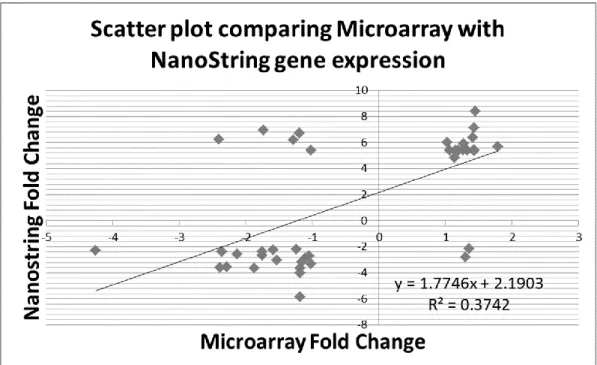
Fold changes obtained with the nCounter system were correlated with those obtained
from the microarray for the same samples (Table 3.1). The 2 sets of expression data showed a good Pearson correlation (r = 0.61) in the scatter-plot (Figure 3.2).
Determination of comparison tissue
Unsupervised hierarchical cluster analysis was conducted for the tumor and normal tissue samples which showed the presence of 2 distinct clusters of ameloblastoma and a
47
Figure 3.1: The micrographs show the laser capture of the epithelial portion of an
49
50
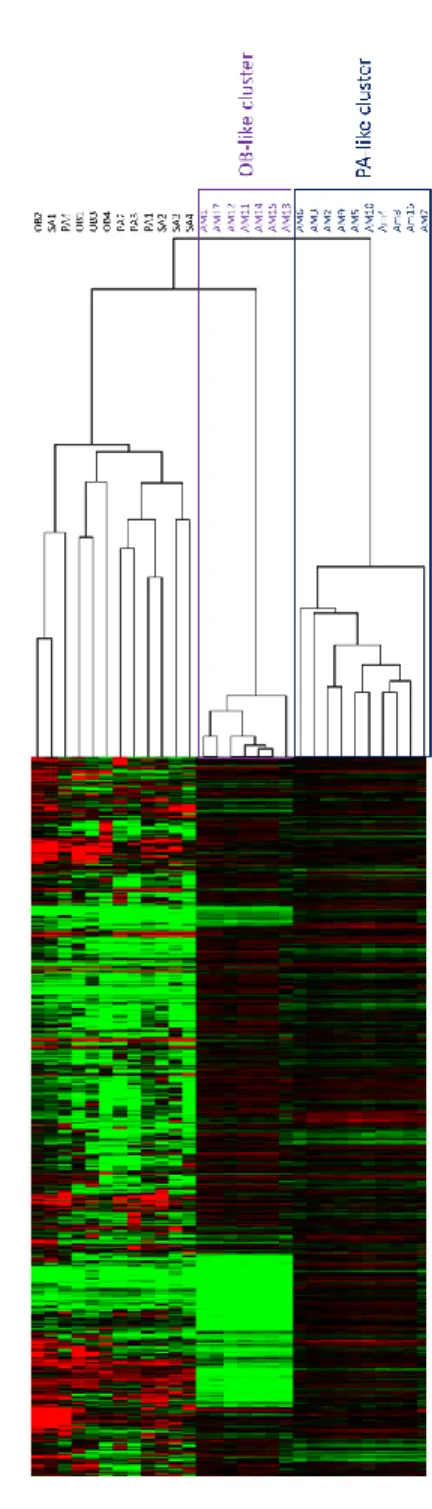
52
Figure 3.4: Cluster analysis used to determine reference tissue. A – Heat map of the 3 different odontogenic tissue (OB – Odontoblast, PA – Pre-secretory ameloblast, SA – Secretory
ameloblast) and the 2 distinct clusters of Ameloblastoma (AM) clustered using the 60
53 Multiclass analysis
Multiclass analysis was conducted between the 2 tumor clusters and 2 associated
normal tissue (pAM, oAM, PA, OB) and differentially expressed genes were carried forward in a cluster analysis (Figure 3.5A). To characterize the transcriptome of ameloblastoma and the 2 molecular sub-clusters, the gene expression data were analyzed in 3 groups. The common tumor cluster describes differential gene expression common in both tumor clusters compared to normal tissue and comprises 2592 genes that were expressed at a higher and lower level in the 2 tumor clusters (pAM, oAM) compared to the 2 normal tissue clusters (OB, PA). The pAM cluster describes differential gene expression unique to that cluster and consists of 1287 genes expressed at higher and lower levels compared to the other 3 groups. The oAM cluster
describes differential gene expression unique to oAM tumors and consists of 1516 genes expressed at a higher and lower levels compared to the other 3 groups. The genes with fold changes at FDR < 1% were used for pathway analysis (Data uploaded at
56
57 Pathway and gene set enrichment analysis
Ingenuity pathway analysis was used to examine the activated and inhibited canonical pathways for each tumor cluster (Table 3.2).
The common tumor cluster had 21 activated (z-score>1) and 5 inhibited (z-score <-1) pathways (Figure 3.5B) at p-value<0.05. Genes associated with notable biological processes that were differentially expressed in all the ameloblastoma tumors included prevention of damage to cell cycle regulation, cancer pathways, inflammatory pathways and Map kinase related pathways. In addition, GSEA conducted between the common tumor cluster and normal tissues showed that 1860 out of the 2381 genes sets in the “all curated gene sets v4.0” were
up-regulated in the common tumor cluster. Nineteen upup-regulated gene sets were significantly enriched at the nominal p-value<0.05. (Table 3.3).
The pre-secretory ameloblast tumor cluster had 22 activated and 1 inhibited pathway below the critical p-value threshold (Figure 3.5C). Pathway analysis showed activation in the known cancer pathways, several inflammatory pathways and EGFR pathways.
The odontoblast tumor cluster had 1 activated and 8 inhibited pathways (Figure 3.5D). Several inflammatory pathways were found to be inhibited in this cluster.
Upstream analysis
58
regulators, kinases and cytokines. Specifically, several Map kinase members and inflammatory cytokines were predicted to be activated.
Correlation with The Cancer Genome Atlas
The 2 molecular subtypes of ameloblastoma were compared with the transcriptome of the cancer subtypes in TCGA (Figure 3.6). The analysis did not show any significant correlation of ameloblastoma with any of the 13 subtypes of cancers that are well studied and has
62
63 Discussion
The major finding of this study was the molecular heterogeneity of ameloblastoma that
was strongly associated with its histological subtypes. Gene expression profiles of follicular and plexiform subtypes were more closely related to gene expression profiles of different normal odontogenic tissues and the follicular subtype showed activation of different molecular pathways compared with the plexiform subtype. This new knowledge can serve as a rich hypothesis-generating resource for the study of molecular and phenotypic characteristics of ameloblastoma.
Similar to the present study, Heikinheimo and colleagues found that ameloblastoma gene expression is heterogeneous, and identified 2 distinct tumor clusters with gene expression profile that were most similar to gene expression in the cap/bell stage of tooth development (Heikinheimo et al. 2015b). Using supervised cluster analysis we found that more than half of ameloblastoma samples were most similar in gene expression to pre-secretory ameloblast, similar to those observed in the early cap/bell stage as described by Heikinheimo. It was surprising that using the supervised cluster analysis the remaining ameloblastoma samples associated with mesenchymal derived odontoblasts rather than with the epithelial derived ameloblasts. This finding appears to be driven by differences in inflammatory pathways and was associated with a different histological appearance.
64
several predicted activated upstream cytokines. The association between dysregulated
inflammation and cancer progression has been studied extensively (Coussens and Werb 2002). The greater number of pathways activated in the pre-secretory cluster suggests that this process may be more important in the follicular subtype.
Additionally, both tumor clusters revealed that damage to cell cycle regulation pathways play important roles. A key regulator in the cell cycle damage prevention pathways is TP53 which is also predicted to be inhibited in our upstream analysis. TP53 is a major tumor suppression gene (Rivlin et al. 2011) and the loss of a tumor suppressor gene activity in ameloblastoma may be important in the tumorigenesis process.
Several canonical pathways involving the MAPK pathways and upstream members were found to be activated in the common tumor cluster. The MAPK pathways have long been considered tumor driver pathways in the pathogenesis of various cancers and also is thought to be important in ameloblastoma tumorigenesis (Brown et al. 2014; Sweeney et al. 2014).
65
In GSEA, the gene sets with the highest activation scores, were cancer related including “SMID_BREAST_CANCER_LUMINAL_A_DN”. Cancer related pathways were also found to be differentially expressed in our pathway analysis. Moreover, breast cancer specific “Role of BRCA1 in DNA Damage Response” pathway was found to be differentially expressed, with the 2 different analyses highlighting similar molecular pathways.
One of the short-comings of this study is that most of the samples were FFPE. Formalin fixing can cause the degradation of RNA (Ravo et al. 2008) and affect the accuracy of
microarrays. However, recent studies supported the use of such samples for gene expression analysis (Abdueva et al. 2010) and NanoString has been shown to produce consistent results independent of the sample type (fresh frozen versus FFPE) (Malkov et al. 2009). Genes in our microarray data that had the greatest fold changes showed good correlation with the
nanoString expression. In addition, there were no outliers in the cluster analysis among the ameloblastoma cluster analysis indicating consistent results between fresh frozen and FFPE samples.
Strengths of the study included the use of LCM and universal RNA as a means of normalizing between arrays. Ameloblastoma presents with neoplastic epithelial tissue
66
In conclusion, our study isolated ameloblastoma epithelial and normal odontogenic cells using LCM to identify gene expression profiles and molecular pathways that are potentially important in the tumorigenesis of ameloblastoma. Ameloblastoma showed 2 distinct molecular profiles that were associated with different histological subtypes suggesting they could be receptive to different chemotherapeutic protocols. These results provide a wealth of
67
CHAPTER 4: TRANSCRIPTOME VARIABILITY IN KERATOCYSTIC ODONTOGENIC TUMOR SUGGESTS DISTINCT MOLECULAR SUBTYPES
Shijia Hu1,2, Kimon Divaris1,3, Joel Parker4, Ricardo Padilla5, Valerie Murrah5, John Timothy Wright1
1Pediatric Dentistry, University of North Carolina, Chapel Hill, NC, USA
2Faculty of Dentistry, National University of Singapore, Singapore
3Epidemiology, Gillings School of Global Public Health, University of North Carolina-Chapel Hill,
Chapel Hill, NC, USA
4Cancer Genetics, University of North Carolina-Chapel Hill, Chapel Hill, NC, USA
5Diagnostic Sciences, School of Dentistry, University of North Carolina-Chapel Hill, Chapel Hill,
68 Abstract
Keratocystic Odontogenic Tumor (KCOT) is a locally aggressive developmental cystic
neoplasm thought to arise from the odontogenic epithelium. A high recurrence rate of up to 30% has been found following conservative treatment. Aggressive tumor resection can lead to the need for extensive reconstructive surgery, resulting in significant morbidity and impacting quality of life. Most research has focused on candidate-genes with a handful of studies
69 Introduction
In 2005, the World Health Organization reclassified the Keratocystic Odontogenic Tumor
(KCOT) from a cyst to a tumor to better reflect its neoplastic nature (Barnes L 2005). KCOT is a benign but locally aggressive developmental cystic neoplasm historically thought to arise from the odontogenic epithelium (Partridge and Towers 1987) and frequently is associated with the follicle of unerupted teeth. During the last decade there has been a resurgence of interest in and efforts to understand tumorigenesis of KCOTs with the ultimate goal of developing better diagnostic and treatment approaches.
Despite advancements in antineoplastic therapies, surgical intervention remains the treatment of choice for KCOTs. A high recurrence rate of up to 30% has been found following conservative treatment such as enucleation and curettage, creating a challenge in determining the optimal extent of surgical resection. Nevoid basal cell carcinoma syndrome (NBCCS) is a disorder that presents with multifocal KCOT; these cases have even higher recurrence rates when compared to isolated unifocal cases not associated with NBCCS (Johnson et al. 2013). Aggressive tumor resection can lead to the need for extensive reconstructive surgery and rehabilitation for patients with KCOTs, causing significant morbidity and negatively impact their quality of life.