Remote Sensing and GIS for Hydrology and Water Resources (IAHS Publ. 368, 2015) (Proceedings RSHS14 and ICGRHWE14, Guangzhou, China, August 2014).
108
Study of a dynamic downscaling scheme for quantitative
precipitation forecasting
YUAN LI
1, G.H. LU
1, Z.Y. WU
1& JUN SHI
21 College of Hydrology and Water Resources, Hohai University, Nanjing, Jiangsu Province, 210098, China
2 Henan Electric Power Survey & Design Institute, Zhengzhou, Henan Province, 450007, China
Abstract Dynamic downscaling is the best way to get high resolution quantitative precipitation forecasts. The Weather Research and Forecasting Model (WRF) was utilized as a dynamic downscaling tool in this study. The influence of the horizontal resolutions and the model domains on precipitation forecasts has been analysed to establish an optimized dynamic downscaling scheme. Three precipitation events over Xijiang basin, China, were simulated with different horizontal resolutions and domains. The results indicate that both the horizontal resolution and model domain have an influence on the precipitation forecast. However, the correlation between high precipitation forecast accuracy and the high horizontal resolution or the large model domain were not very strong. Comprehensive consideration of the results shows that the accuracy of forecast is best when the horizontal resolution is 20-km. Although the model domain size has no significant influence on the precipitation forecast, a larger domain may improve the stability of forecasting.
Key words WRF model; dynamic downscaling; horizontal resolution; model domain; Xijiang Basin
INTRODUCTION
China is located in the eastern part of Asia and has complicated topography, and its climate varies greatly from region to region. The South of China is greatly affected by the monsoon climate and tropical cyclones, and flood disasters take place frequently. Flood forecasting, as one of the non-structural flood protection measures, is capable of reducing the risk of flood disaster effectively. Precipitation is the most important atmospheric input to hydrological models, and is always acquired by gauge-based precipitation measurements. However, utilizing observed precipitation data as input to hydrological models would limit the flood lead time. Compared with traditional methods (Lu et al., 2006), using quantitative precipitation forecasts with a certain accuracy as input can be an effective way to provide longer flood lead times.
Although the global numerical weather prediction models have skills in predicting large-scale circulation features, meso- and micro-scale weather systems, which are the major factor for the occurrence of rainstorms, cannot be predicted effectively. Also, existing global models typically run at a coarse resolution due to the limitations of computing resources. In order to meet the requirements of flood forecasting, the downscaling methods should be utilized to increase the horizontal resolution. Downscaling techniques that have been widely used are the dynamic downscaling method and statistical downscaling method. Compared with the statistical downscaling method, dynamic downscaling techniques are more physically based. The customary practice of dynamic downscaling method is to utilize mesoscale regional atmospheric models within a global model to simulate local climate. Atmospheric dynamic processes and physical processes have been taken into consideration (Li et al., 2009). Regional atmospheric models run at finer horizontal resolution than global-scale models, and thus provide a more accurate output with higher temporal and spatial resolution.
The Weather Research and Forecasting (WRF) model is a mesoscale numerical weather prediction (NWP) and atmospheric simulation system. The WRF dynamics solver integrates the compressible, non-hydrostatic Euler equations. Geographical position can be easily located and multiple horizontal resolutions can be set as well. Research has indicated that utilizing the WRF model as a dynamic downscaling tool with a suitable dynamic downscaling scheme is capable of forecasting precipitation with higher horizontal resolution for different regions in China (Wang et al., 2008; Wei et al., 2011). Both the horizontal resolution and domain size have a significant influence on the accuracy of weather forecasts. So it is of great importance to set proper
resolutions and domains when the WRF model is implemented. The Xijiang River is the major tributary of the Pearl River, South China. However, application of the WRF model over Xijiang basin has been investigated less. We implemented the WRF model as a dynamic downscaling tool to analyse the influence of horizontal resolution and domain size on the simulations over Xijiang basin in this paper. An optimized dynamic downscaling scheme for Xijiang basin was established. Higher accuracy of quantitative precipitation forecasting with higher temporal and spatial resolutions for Xijiang basin are provided as input to hydrological models.
DATA AND METHODOLOGY Data
The output of the Global Forecast System (GFS) model is used as input to the WRF model in this paper. The global forecast data we have used are at a horizontal resolution of 1° × 1° with a frequency of 6 hourly. The output of different downscaling schemes has been validated by using automatic precipitation stations over Xijiang basin.
Several rainstorms were selected according to the average precipitation amount over Xijiang basin. The occurrence time of these rainstorms are shown in Table 1.
Table 1 Occurrence time of selected rainstorms over Xijiang basin
Rainstorm Occurrence time
Storm 1 5–6 June 2005
Storm 2 21–22 June 2005
Storm 3 12–13 June 2008
Methodology
The WRF model is used to simulate rainstorms over Xijiang basin. In this study, all domains are centred at 23.8N, 109.2W. All runs utilize the same physical functions on a Lambert conformal projection. The vertical structure of the model includes 28 layers covering the whole troposphere. The WRF single-moment 3-class microphysics parameterization (Hong and Lim, 2006) and the Kain-Fritsch cumulus parameterization (Kain, 2004) which are related to the precipitation simulation, have being used on all domains for all runs. Other physical options are left as the recommended default settings. Simulations were conducted for three periods corresponding to the occurrence of three selected typical rainstorms: from 0000 UTC 5th June 2005 to 0000 UTC 6th June 2005 (Storm 1); from 0000 UTC 21th June 2005 to 0000 UTC 22th June 2005 (Storm 2); from 0000 UTC 12th June 2008 to 0000 UTC 13th June 2008 (Storm 3).
Experimental design of horizontal resolution sensitivity
To analyse the influence of horizontal resolution on the precipitation forecast, the domain is set to be the same with different horizontal resolutions. The number of grids at different resolutions is shown in Table 2.
Table 2 The designations of simulations with different horizontal resolutions
Horizontal resolution Number of grids
30 km 50×36
25 km 60×44
20 km 77×54
15 km 100×72
10 km 150×108
Experimental design of model domain sensitivity
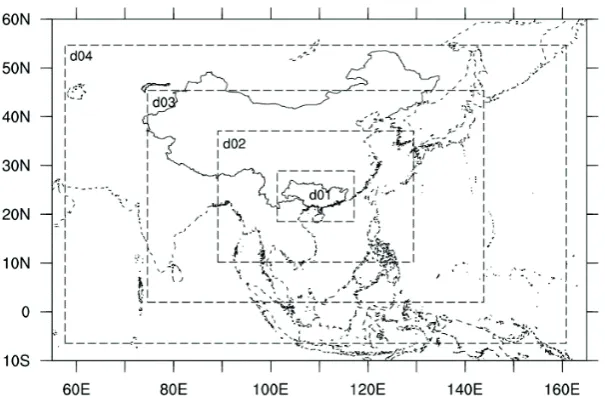
The horizontal resolution was set as 20 km for the test. Four different domain sizes were utilized to simulate the selected rainstorms (Fig. 1). The Xijiang basin is included under different domain sizes from D01 to D04.
Fig. 1 The designations of simulations with different domain sizes.
Evaluation methodology
Evaluation of the WRF sensitivity experiments was performed using a variety of statistical verification techniques. To facilitate comparisons, the output of WRF was bilinearly interpolated into the automatic precipitation stations over Xijiang basin. The quantitative accuracy of simulations is assessed by the mean error (ME), root mean square error (RMSE) and correlation coefficient (R), which are defined as:
𝑀𝑀𝑀𝑀 = 𝑁𝑁1∑𝑁𝑁𝑖𝑖=1(𝑝𝑝𝑖𝑖− 𝑜𝑜𝑖𝑖) (1)
𝑅𝑅𝑀𝑀𝑅𝑅𝑀𝑀= �𝑁𝑁1∑𝑁𝑁𝑖𝑖=1(𝑝𝑝𝑖𝑖− 𝑜𝑜𝑖𝑖)2� 1/2
(2)
𝑅𝑅= ∑𝑁𝑁𝑖𝑖=1(𝑝𝑝𝑖𝑖−𝑝𝑝̅)(𝑜𝑜𝑖𝑖−𝑜𝑜�) �∑𝑁𝑁𝑖𝑖=1(𝑝𝑝𝑖𝑖−𝑝𝑝̅)2∙∑𝑁𝑁𝑖𝑖=1(𝑜𝑜𝑖𝑖−𝑜𝑜�)2�1/2
(3)
where N is the total number of verification grid point, p and o are the model simulation and observed values, and 𝑝𝑝̅ and 𝑜𝑜̅ are the mean forecasted and observed precipitation.
To verify the accuracy of the spatial distribution of precipitation forecasting at different precipitation thresholds over Xijiang basin, the threat score (TS) was computed. TS is used to measure the skill of predicting the area of precipitation for a certain threshold. TS is defined as:
𝑇𝑇𝑅𝑅= 𝑎𝑎+𝑏𝑏+𝑐𝑐𝑎𝑎 (4)
where a is the number of points where both the forecasted and observed amount of precipitation are in a certain threshold, b is the number of points where the forecasted amount of precipitation is beyond the threshold while the observed is under the threshold, c is the number of points where forecasted amount of precipitation is under the threshold while the observed is beyond the threshold.
RESULTS AND DISCUSSION
Influence of horizontal resolution on simulations
Figure 2 indicates that all simulations at different horizontal resolutions are capable of forecasting this precipitation process. However, the location and intensity of the rainstorm centre are not the same when the horizontal resolutions are different. When the horizontal resolution is 30 km, the simulated intensity of the rainstorm centre is much lower than observed. The intensity and area of the rainstorm centre increases as the horizontal resolution increases. The simulated location of the rainstorm centre also gets much closer to observed. The simulation is best when the horizontal resolution is 20 km. Further increase of the horizontal resolution leads to the occurrence of false rainstorm centres.
Fig. 2 Comparison of observed and simulated precipitation distribution at different horizontal resolution for Storm 3
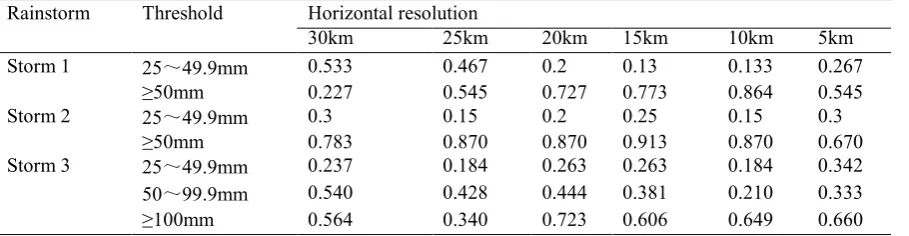
Table 3 presents the threat scores of simulations with different horizontal resolutions and indicates that no obvious tendency has been observed as the horizontal resolution increases. The influence of horizontal resolution is different for each selected rainstorm at different thresholds.
For large rain, the TS is the best when the horizontal resolution is 30 km for the simulation of Storm 1 and Storm 2. The best simulation of Storm 3 occurs at the large rain threshold when the horizontal resolution is 5 km.
The result of TS at thresholds ≥50 mm is totally different from the results at the large rain threshold. TS increases as the horizontal resolution gets higher. The highest TS occurs when the horizontal resolution is 10 km for Storm 1 and 15 km for Storm 2.
The TS of Storm 3 at heavy rain threshold is best when the horizontal resolution is 30 km, and worst when the horizontal resolution is 10 km. The highest TS of Storm 3 at a threshold ≥100 mm appears at a horizontal resolution of 20 km.
It is obvious that the horizontal resolution has a significant influence on simulations. According to the results, the TS at different thresholds is more stable when the horizontal resolution is 20 km.
Table 3 Threat Scores of each simulation at different horizontal resolution Rainstorm Threshold Horizontal resolution
30km 25km 20km 15km 10km 5km
Storm 1 25~49.9mm 0.533 0.467 0.2 0.13 0.133 0.267
≥50mm 0.227 0.545 0.727 0.773 0.864 0.545
Storm 2 25~49.9mm 0.3 0.15 0.2 0.25 0.15 0.3
≥50mm 0.783 0.870 0.870 0.913 0.870 0.670
Storm 3 25~49.9mm 0.237 0.184 0.263 0.263 0.184 0.342
50~99.9mm 0.540 0.428 0.444 0.381 0.210 0.333
Influence of domain size on simulations
The simulated distribution of precipitation has been compared with the observed precipitation distribution for Storm 3 (Fig. 3). The intensity decreases from north-east to south-west for all runs, which the tendency is the same as we have observed. When the domain is D01, the intensity of rainstorm centre is lower than observed. The intensity, location and area of rainstorm centre are almost the same when the domain is D02, D03 and D04.
Fig. 3 Comparison of observed and simulated precipitation at different domain size for Storm 3.
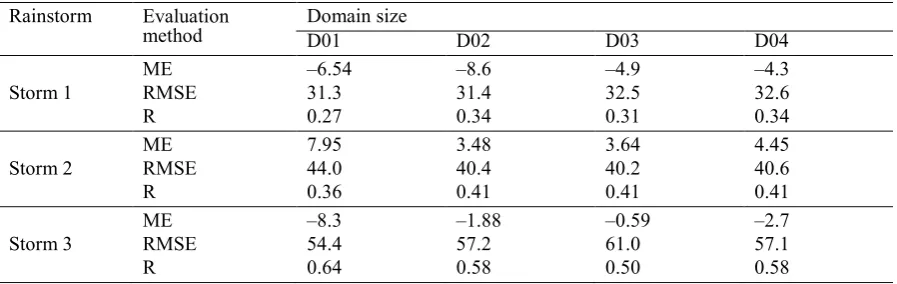
According to the results shown in Table 4, domain size also has an influence on simulation. When the domain size is D01, the simulations are always the worst. The mean error of Storm 2 is 7.95, almost twice higher than the results of other domains. The mean error of Storm 3 is also much higher than for the other domains. R of Storm 2 and Storm 3 is also lower than others.
When domain size increases to D02, the simulations are not stable. The results are strongly affected by the storm we have selected. The ME of Storm 1 with D02 is –8.6. However, the ME of Storm 2 is 3.48 and for Storm 3 is –1.88.
The results of D03 and D04 are almost the same. Although a larger domain size would not raise forecast accuracy effectively, a larger domain may improve stability of forecast.
Table 4 Statistical evaluation of simulations at different domain size Rainstorm Evaluation
method Domain size D01 D02 D03 D04
ME –6.54 –8.6 –4.9 –4.3
Storm 1 RMSE 31.3 31.4 32.5 32.6
R 0.27 0.34 0.31 0.34
ME 7.95 3.48 3.64 4.45
Storm 2 RMSE 44.0 40.4 40.2 40.6
R 0.36 0.41 0.41 0.41
ME –8.3 –1.88 –0.59 –2.7
Storm 3 RMSE 54.4 57.2 61.0 57.1
R 0.64 0.58 0.50 0.58
DISCUSSION
always leads to a higher false alarm rate, when they compared the results of WRF with different horizontal resolutions (45, 30, 20 and 10 km) on simulating rainstorms in Huaihe River Basin.
The domain size also has an influence on the accuracy of precipitation forecast. We found the best domain size includes most parts of East Asia, and takes topography into consideration. The best domain for Xijiang basin in this research is 77 × 54 points at a horizontal resolution of 20 km. Such a large domain is able to simulate large-scale weather systems and the results are stable. Olsson et al. (2013) also pointed out that a large domain can capture the larger scales of the sub-synoptic forcing. However, a larger domain always lead to higher computing time. So, we should balance the model accuracy and efficiency when choosing a simulation domain for the WFR model.
CONCLUSION
In this study, the WRF model was utilized as a dynamic downscaling tool to analyse the influence of horizontal resolution and domain size on precipitation forecasting over Xijiang basin. Several typical rainstorms were simulated under different downscaling schemes. An optimized dynamic downscaling scheme has been established. The conclusions are drawn as follows:
(a) Higher horizontal resolution may improve the spatial distribution forecast of rainstorms. However, a threshold of horizontal resolution exists. Continuous raise of horizontal resolution may lead to lower accuracy of precipitation forecast. The threshold of WRF model is 20-km over Xijiang basin.
(b) Topography should be considered. Although D02 is larger than D01, the simulations are more chaotic for the left margin is close to Qinghai-Tibet. The results are almost the same when the domain is D03 and D04. But larger domain size always lead to longer computing time. D03 is more likely to be used on simulations.
(c) Overall, an optimized downscaling scheme is established, which the horizontal resolution is 20-km and domain size is D03. This optimized scheme has a significant guiding meaning and practical application value for the quantitative precipitation forecast and flood prevention over Xijiang basin.
Acknowledgements This work is supported by the Special Public Sector Research Program of Ministry of Water Resources (Grant nos 201301040, 201401008 and 201301070), the Foundation for the Author of National Excellent Doctoral Dissertation of PR China (Grant no. 201161), the Qing Lan Project and Program for New Century Excellent Talents in University(Grant no. NCET-12-0842), the Natural Science Foundation of Jiangsu Province of China (Grant no. BK20131368) and the National Science and Technology Major Projects (2012ZX07101-010)
REFERENCES
Chen, J. and Wang, J.J. (2006) Mesoscale precipitation simulation sensitivity to PBL parameterization. Journal of Applied
Meteorological Science 17, 11–17.
Deng, L.T., Shi, X.L. and Yan, Z.H. (2012) Mesoscale simulation of a heavy rainfall in the Huaihe River Valley in July 2003:
Effects of different horizontal resolutions. Journal of Tropical Meteorology 28(2), 167–176.
Hong, S.Y. and Lim, J.0.J. (2006) The WRF Single-Moment 6-Class Microphysics Scheme (WSM6). Journal of the Korean
Meteorological Society 42(2), 129–151.
Kain, J.S. (2004) The Kain-Fritsch convective parameterization: An update. Journal of Applied Meteorology and Climatology
43, 170–181.
Li, Y., et al. (2009) Application of dynamical downscaling method for assessment of wind energy resources. Climatic and
Environmental Research 14(2), 192–200.
Lu, G.H., et al. (2006) Application of a coupled atmospheric-hydrological modeling system to real-time flood forecast.
Advances in Water and Science 17(6), 847–852.
Olsson, P. Q., Volz, K. P. and Liu, H. (2013). Forecasting near-surface weather conditions and precipitation in Alaska's Prince
William Sound with the PWS-WRF modeling system. Continental Shelf Research, 63, S2–S12.
Shi, J.L., et al. (2012) Simulation research of different resolution ratio on WRF model. Meteorology Journal of Inner Mongolia
(5), 19–26.
Wang, J., et al. (2008) Numerical simulation and analysis of influence of complex topography on a Fujian rainstorm. Journal of
Nanjing Institute of Meteorology 31(4), 546–554.
Wei, J.S., et al. (2011) A case study of a heavy precipitation in Jiangsu with WRF model. Trans.Atmospheric Sciences 34(2),