Strain Localization during Equal-Channel Angular
Pressing analyzed by Finite Element Simulations
Tobias D. Horn1*ID, Christian B. Silbermann1, Philipp Frint2 ID, Martin F.-X. Wagner2 ID, and Jörn Ihlemann1
1 Chair of Solid Mechanics, Chemnitz University of Technology, Reichenhainer Str. 70, D-09126 Chemnitz,
Germany; [email protected]
2 Chair of Materials Science, Institute of Material Science and Engineering, Chemnitz University of
Technology, Erfenschlager Str. 73, D-09125 Chemnitz, Germany
* Correspondence: [email protected]; Tel.: +49-371-531-31730
Abstract: Equal-Channel Angular Pressing (ECAP) is a method used to introduce severe plastic 1
deformation into a metallic billet without changing its geometry. In special cases strain localization 2
occurs and a pattern consisting of regions with high and low deformation (so-called shear and matrix 3
bands) can emerge. This paper studies this phenomenon numerically adopting two-dimensional 4
finite element simulations of one ECAP pass. The mechanical behavior of aluminum is modeled 5
using phenomenological plasticity theory with isotropic or kinematic hardening. The effects of the 6
two different strain hardening types are investigated numerically by systematic parameter studies: 7
While isotropic hardening only causes minor fluctuations in the plastic strain fields, a material 8
with high initial hardening rate and sufficient strain hardening capacity can exhibit pronounced 9
localized deformation after ECAP. The corresponding finite element simulation results show a regular 10
pattern of shear and matrix bands. This result is confirmed experimentally by ECAP-processing of 11
AA6060 material in a severely cold worked condition, where microstructural analysis also reveals the 12
formation of shear and matrix bands. Excellent agreement is found between the experimental and 13
numerical results in terms of shear and matrix band width and length scale. The simulations provide 14
additional insights regarding the evolution of the strain and stress states in shear and matrix bands. 15
Keywords:equal-channel angular pressing; ECAP; shear band; matrix band; kinematic hardening; 16
FEM; strain localization 17
1. Introduction 18
Equal-Channel Angular Pressing (ECAP) is a severe plastic deformation (SPD) process developed 19
by Segal [1,2]. During ECAP a billet with a typically square or circular cross-section is pressed through 20
an angeled channel. Both channels (entrance and exit channel) are intersected by a shear plane, where 21
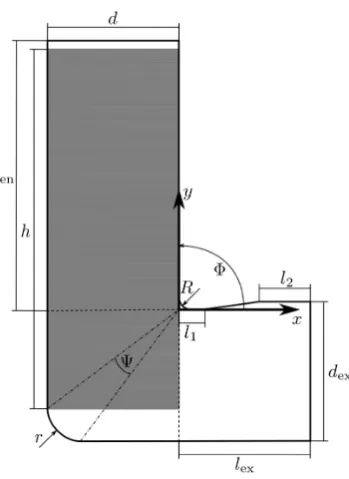
a shear deformation is introduced into the material. The angle between these two channels (Φ) and the 22
angle of the outer curvature (Ψ) inside the “L”-shaped channel (cf.Figure 1) control the amount of 23
introduced (effective) strain [3]. 24
In the most common ECAP dies (Φ=90◦,Ψ=0◦) the introduced effective strain is approximately 25
1.15 after a single pass. As a consequence of the severe plastic deformation grain refinement occurs. 26
Grain refinement results in a higher yield strength since geometrical boundaries are effective obstacles 27
for dislocation motion [4,5]. In addition, an extraordinarily high ductility is observed in many 28
materials after multiple ECAP passes [6–8]. 29
30
Figure 1.Sketch of an ECAP channel with the channel angleΦand the angleΨdefining the outer curvature.
Figure 2.Sketch of the simulation model with the relevant geometrical parameters.
31
For most metallic materials the billet is deformed predominantly homogeneously during ECAP 32
[8–10]. However, under certain conditions, pronounced strain localization occurs and results in 33
heterogeneous microstructures consisting of regions with large inherent strain (shear bands) and 34
regions with much lower strains (matrix bands) [11–15]. 35
In addition to experimental investigations, finite element (FE) simulations have been carried 36
out to understand the ECAP process in greater detail. For this purpose, multiple parameter studies 37
were conducted, e.g. studying the effect of variations of the channel angleΦ[16–19], the angle of the 38
outer curvatureΨ[18–23], the strain rate [24–26] as well as the friction between the channel and the 39
billet [16,18,23,26,27]. However, within this huge body of scientific work only a few papers address the 40
simulation of strain localization [24,28,29]. In those papers strain softening behavior had to be used in 41
order to simulate strain localization in distinct bands. Figueiredo et al. showed that the occurrence 42
of shear bands depends on the initial flow-softening rate and the steady-state stress [28] as well as 43
the strain rate [24]. Furthermore, most of the aforementioned finite element studies do not contain a 44
convergence study for their simulation model and in some cases an automatic remeshing function was 45
used to reach a stable simulation [18,20,24,29]. 46
The present paper shows both experimentally and numerically that strain localization during 47
ECAP can even occur for a strainhardeningmaterial. To this end, explicit finite element simulations are 48
conducted. In order to achieve reliable FE solutions, systematic convergence studies are performed. 49
As a special feature, the billet is meshed with pre-oriented rhomboid-shaped elements such that 50
remeshing is not necessary. The role of two types of hardening – isotropic and kinematic – is 51
investigated numerically by varying the corresponding material parameters. It is found that only 52
kinematichardening leads to the emergence of localized deformation in form of shear and matrix bands. 53
The simulation results are compared thoroughly to corresponding ECAP experiments on billets made 54
of an AA6060 alloy. Finally, the origin of the heterogeneous plastic flow is discussed both from a 55
microstructural and a mechanical point of view, representing a starting point for further basic research 56
2. Simulation model 58
Isothermal and frictionless 2D plane-strain finite element simulations of one pass of ECAP were 59
conducted using the commercial explicit finite element code Abaqus. The geometry parameters 60
specifying the ECAP process are shown inFigure 2:Φis the channel angle,Ψthe angle of the outer 61
curvature, r is the outer and R the inner edge radius. The outer edge radius is defined via the 62
diameterd, the angle of the outer curvature and the channel angle: 63
r= Ψd
χcos
1
2(χ−Ψ)
with:χ=π−Φ.
The gray area inFigure 2is a representation of the billet with the lengthhand the widthd, which 64
is equal to the diameter of the entrance channel. The geometry parameters inTable 1are chosen in 65
analogy to the parameters used for the experimental investigations shown later. 66
Table 1.Geometry parameters for the simulation model (cf.Figure 2)
Φ Ψ R d dex h len lex l1 l2
90◦ 1◦ 5r 50 mm 52 mm 300 mm 300 mm 75 mm 5 mm 41 mm
To simulate the ECAP process a version of the elastic visco-plastic material model of Shutov 67
and Kreißig [30] is used. It is based on the multiplicative decomposition of the deformation gradient 68
F = Fi·Fe and of the inelastic part of the deformation gradient Fi = Fii·Fie. The rheological 69
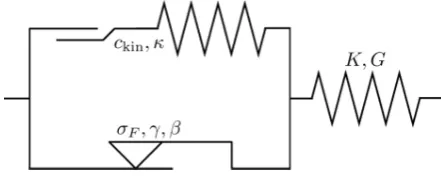
representation of the model [31] is shown schematically inFigure 3.
Figure 3.Rheological representation of the material model with the material parameters.
70
The elastic behavior is modeled with a Neo-Hookean spring and the plastic flow is represented by 71
a parallel connection of a St. Venant element with an endochrone element that describes the kinematic 72
hardening of Armstrong-Frederick type [32]. Furthermore, the St. Venant element incorporates the 73
yield stress and the isotropic hardening of Voce type [33]. Normally, the visco-plastic flow is prescribed 74
with Perzyna’s rule [34]. However, in the present study rate-independent plastic flow was assumed. 75
Note that the constitutive model is a purely phenomenological elastic-plastic model with 76
isotropic and kinematic hardening. It is not based on specific assumptions regarding microstructural 77
deformation mechanisms and therefore allows for a quite general analysis of shear localization during 78
ECAP. As indicated in the constitutive equations (1)-(10) seven parameters are needed to describe 79
the material behavior.KandGare the bulk and shear modulus,σF0is the yield stress and the other 80
constants represent the parameters of the isotropic (β,γ) and kinematic (κ,ckin) hardening. As shown in 81
[35]βandκckindefine the initial hardening rate (IHR) while γβ andκ 1determine the strain hardening 82
capacity (SHC)1. 83
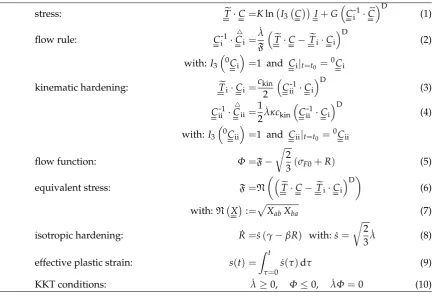
Table 2.Constitutive equations of the applied elastic-plastic material model
stress: T
e
·C=Kln I3 C
I+GCi1·CD (1)
flow rule: Ci1·C4i=
˙
λ F
e
T·C−
e
Ti·Ci D(2)
with:I3
0C i
=1 and Ci|t=t0 = 0C
i
kinematic hardening:
e
Ti·Ci= ckin2
Cii1·Ci D
(3)
Cii1·
4
Cii=1 2λκ˙ ckin
Cii1·Ci
D
(4)
with: I3
0C ii
=1 and Cii|t=t0 = 0C
ii
flow function: Φ=F−
r 2
3(σF0+R) (5)
equivalent stress: F=N
e
T·C−T
e
i·Ci D(6)
with:N X
:=pXabXba (7)
isotropic hardening: R˙ =s˙(γ−βR) with: ˙s=
r 2
3λ˙ (8)
effective plastic strain: s(t) = Z t
τ=0
˙
s(τ)dτ (9)
KKT conditions: λ˙ ≥0, Φ≤0, λΦ˙ =0 (10)
In the material model summarized in tableTable 3further appear the Cauchy-Green tensor 84
C=FT·F, two internal state variablesCi,Ciiand the second Piola-Kirchoff stress T
e
, which is related 85to the Cauchy stressσby 86
e
T =I3 FF 1·σ·F T.
Here, the third invariantI3of a second order tensorX=Xabea⊗ebis defined byI3(X) =det[Xab].
87
Furthermore,
4
Xdenotes the material time derivative andXDrepresents the deviatoric part ofX. Finally, 88
C =I3 C 13
Cdenotes the unimodular part ofC. The identity tensor is prescribed as initial condition 89
for the internal state variables 0Ci = I,0Cii= Ithroughout this paper. The inelastic multiplier 90
˙
λis calculated iteratively from the Karush-Kuhn-Tucker (KKT) conditions (10) applying a Newton 91
iteration. 92
The material model was implemented in the VUMATuser subroutine of Abaqus/Explicit. Further 93
details on the material model and applications to the simulation of metal forming can be found 94
elsewhere [30,36–38]. For an adequate interpretation of the results some simplifications in the 95
simulation model must be kept in mind: 96
1. A two-dimensional plane-strain simulation is used. Therefore, boundary effects perpendicular 97
to the simulated plane have to be neglected. The main reason for this simplification is the 98
computational effort, which increases excessively when changing to a three-dimensional model. 99
However, the comparison of simulation and experimental results (section 3) demonstrates that 100
2. As the investigation of viscous effects goes beyond the scope of this study, a rate-independent 102
model was chosen. The aluminum material used in the experimental studies exhibits only a 103
minor rate dependence. This keeps the error of this limitation small. 104
3. A frictionless model was used to simulate ECAP. In the experimental studies the ECAP die is 105
always lubricated such that the friction coefficient is low [39]. In addition, both in the experiments 106
and in the simulations, the exit channel is moved with the billet in order to minimize the 107
friction [40]. Because of this, self-heating due to friction may be neglected. 108
3. Parameter Variation 109
First, convergence studies for element type, element size, mass scaling and velocity scaling were 110
performed to reach a behavior independent of these influences and to avoid artificial effects (e.g. due 111
to inertia forces). The FE model was meshed with rhomboid-shaped CPE4R-elements. The initial 112
inclination was chosen such that the elements’ interior angles remain as close as possible to 90◦during 113
the whole deformation. It turned out that a mesh with a maximum element size of e = 0.5 mm 114
(≈92, 600 elements) has to be used by applying a maximum possible mass scale of fm = 400 and
115
plunger velocity of v = 0.75 ms. After these convergence studies a parameter variation for almost 116
all geometrical and material parameters was conducted. Here, only the most important results are 117
presented, for a more detailed depiction see [35]. 118
3.1. Reference Simulation 119
As a reference, a single ECAP pass is simulated with elastic ideal-plastic behavior. The material 120
parameters corresponding to aluminum are shown inTable 3. 121
Table 3.Material parameters for aluminum with ideal-plastic behavior, used in the reference simulation.
K/MPa G/MPa σF0/MPa β γ/MPa ckin/MPa κ/MPa1
73500.0 28200.0 270.0 0.0 0.0 0.0 0.0
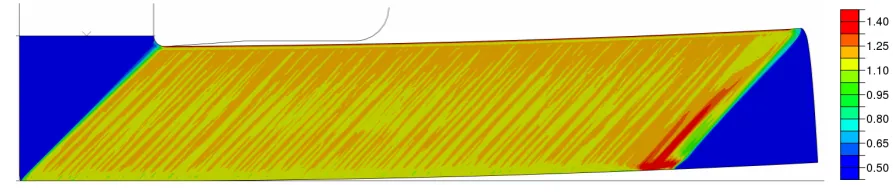
In the contour plot inFigure 4some inhomogeneities in the strain field are visible. However, 122
because of the low difference between maximum and minimum value and the missing regularity they 123
do not represent fully developed shear or matrix bands (seesection 1). Instead, this state will be called 124
“minor fluctuation” in the following. Furthermore, the outer edge of the ECAP die is completely filled 125
with material (lower left corner inFigure 4), which is in line with experimental investigations [23]. 126
Finally, there is a small curvature of the billet because of internal stresses developed during ECAP [41]. 127
This is also known from ECAP experimentswithoutapplying any backpressure. In summary, the 128
simulation result corresponds well with the expectations gained from experiments.
Figure 4.Contour plot of the effective plastic strains(cf.Equation 9) for the reference simulation: some inhomogeneities are visible. Compared to experimental observations of shear and matrix bands, these variations are negligible; they are therefore considered as minor fluctuations.
3.2. Effects of Isotropic Hardening 130
Strain localization is observed in experiments if the SHC of the material subjected to ECAP is 131
low. Motivated by these experimental observations, two different levels of the hardening capacity: 132
γ
β =15 MPa and γ
β =200 MPa and three different levels of the initial hardening rate (IHR):β=0.1, 133
β=1.0 andβ=10.0 are chosen for a systematic comparison. Forβ=0.1 the material has a low and 134
forβ=1.0 it has a high hardening rate during the whole deformation. Forβ=10.0 the material has a 135
pronounced IHR and a very small hardening rate at the end of the deformation. 136
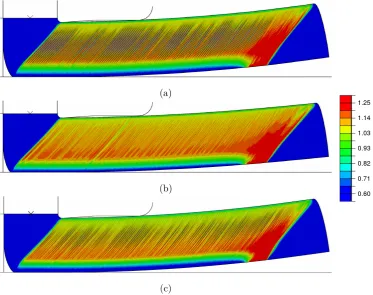
Figure 5. Effective plastic strains(cf. Equation 9) for simulations with isotropic hardening with
γ
β =15 MPa in combination with a)β=0.1, b)β=1.0 and c)β=10.0. σF =270 MPa. In all cases
only minor fluctuations occur.
The results of the simulations withγ
β =15 MPa and with γ
β =200 MPa are shown inFigure 5 137
andFigure 6, respectively. Minor strain fluctuations occur for all simulations, except the one with 138
a high SHC and a high hardening rate during the whole deformation, Figure 6 (b). In this case 139
even minor fluctuations are suppressed yielding a quasi-homogeneous distribution. The situation is 140
different for the low SHC γ
β =15 MPa
: even the high hardening rate during the whole deformation 141
is still too low to suppress fluctuations. Consequently, the SHC controls the heterogeneity of plastic 142
deformation in case of isotropic hardening. However, the difference between the ideal-plastic behavior 143
and this hardening behavior is very small and therefore the results are similar. 144
For γ
β = 200 MPa the SHC is much higher. Still, for low IHR the material behavior is almost 145
ideal-plastic as well and due to this, fluctuations occur. For high IHR the material is hardening during 146
the whole deformation and any heterogeneities are suppressed. For pronounced IHR the SHC is 147
already exhausted at the initial stage of the deformation process. Thus, at the end of the deformation 148
the material behaves almost ideal-plastically with a higher yield stress. For this reason, heterogeneities 149
occur in this case, too. 150
There is another feature which becomes visible looking at the bottom zone of the billets shown in 151
Figure 6. Effective plastic strains(cf. Equation 9) for simulations with isotropic hardening with
γ
β =200 MPa in combination with a)β=0.1, b)β=1.0 and c)β=10.0.σF=270 MPa. In a) and c)
minor fluctuations occur, b) shows a quasi-homogeneous distribution of the effective plastic strain.
the bottom zone and the higher is the vertical gradient of the effective plastic strain and the billet’s 153
curvature. This detail is in perfect agreement with experimental observations [40,42,43], which further 154
indicates that the FE simulations presented here accurately capture various subtle experimental details. 155
156
3.3. Effects of Kinematic Hardening 157
The difference between kinematic and isotropic hardening is the plastic anisotropy induced by 158
the kinematic hardening. While modeling of isotropic hardening usually involves only thescalar 159
equivalent stress, kinematic hardening is based on the stress and back stresstensor(seeEquation 3). 160
Hence, kinematic hardening not only depends on the principal stresses, but also on the principal 161
directions. 162
A high SHC ofκ 1 = 200 MPa was chosen and the IHR was varied in a similar way as in the 163
investigations for isotropic hardening. The results shown inFigure 7are similar to those of isotropic 164
hardening. At low IHR and at pronounced IHR strain inhomogeneities occur and at high IHR the 165
inhomogeneities are suppressed. However, there is an important difference: At pronounced IHR 166
the deformation is not only inhomogeneous but, as an entirely new feature, a very regular pattern 167
emerges. Additionally, the difference between the minimum and maximum strain values in the 168
distinctly different regions is high (∆s≈1.0).2 This type of localized deformation is very similar to 169
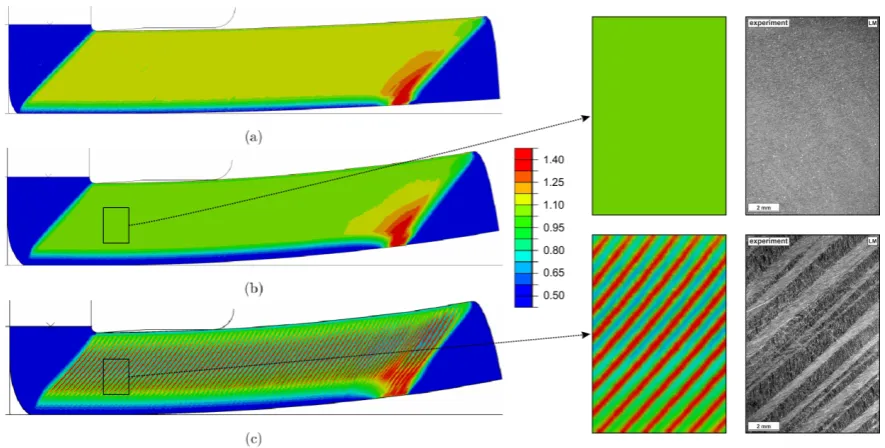
Figure 7. Left: Effective plastic strains(cf. Equation 9) for simulations with kinematic hardening withκ 1 = 200 MPa in combination with a)κckin = 0.075, b)κckin = 0.25 and c) κckin = 3.75.
Right: Comparison of the simulations with optical micrographs after one pass of ECAP for a fully recrystallized (top) and a severely cold worked conventional 6000 series aluminum alloy (bottom).
the shear and matrix band structure observed in experiment (cf. subsection 3.4). The regularity of 170
these bands can also be documented by plotting the progression of the effective plastic strain along 171
the length of the billet, Figure 8.3 Furthermore, an animation of this simulation is provided in the 172
supplementary material of this paper. 173
Figure 8.The effective plastic strains(cf.Equation 9) as function of the position in the billet (cf.Figure 7). Undeformed areas and the unsteady flow at the beginning of the process are omitted.
In order to further analyze and confirm the observation that shear bands are formed when 174
there is a pronounced IHR, addtional simulations were carried out, varyingκandckin. InFigure 9 175
three examples are shown: In simulation a),ckin was doubled resulting in an increase of the IHR 176
(seesection 2). With this increase of the IHR many more shear bands are formed. In simulation b), 177
κ 1is halved, which decreases the SHC and reduces the IHR. This also increases the number of shear 178
bands, but the difference in effective strain between shear and matrix bands is considerably decreased 179
(∆s≈0.2). In simulation c),κ 1andckinare halved such that the hardening capacity is lower, but the 180
IHR remains unchanged. In this case the number of shear bands increases as well. Based on these 181
(and many other performed) simulations it can be concluded: There is a strong effect of the kinematic 182
hardening parameters on the emergence, number, and shape of the bands as well as on the amount of 183
plastic strains within them. However, this effect is strongly nonlinear and the occurrence of distinct 184
shear bands cannot be simply related to a single material parameter in the framework of the present 185
material model. 186
Figure 9.Effective plastic strains(cf.Equation 9) for simulations with kinematic hardening with the parameters a)κ1=200 MPa,κckin=7.5, b)κ1=100 MPa,κckin=7.5 and c)κ1=100 MPa,κckin=
3.75. In all cases shear and matrix bands occur.
Finally, one key result of the present study is that – while fluctuations in terms of the distribution 187
of effective strains along the billet can in principle be simulated both by assuming isotropic or kinematic 188
hardening, and using a wide variety of material parameters – only kinematic hardening appears to be 189
suitable for an accurate simulation of distinct shear bands that differ from the adjacent matrix bands 190
by relatively large amounts of plastic strain. 191
The results may be summarized in a generalized diagram where the parameter regions are 192
indicated with corresponding uniaxial flow curves as function ofs(Figure 10). Heterogeneities occur in 193
two different regions, defined approximately by the solid lines: In the region where the hardening rate 194
is too low during the whole deformation such that the material behavior is similar to ideal-plastic, as 195
(a) (b)
Figure 10.Generalized diagram with uniaxial flow curves as functions of the effective plastic strain depicting the regions where localized deformation occurs for a) isotropic and b) kinematic hardening. Material parameters corresponding to flow curves in the marked regions lead to the indicated solution. Note that despite the apparent similarity of theuniaxialflow curves, isotropic and kinematic hardening are fundamentally different in themultiaxialcase.
the deformation. For isotropic hardening (cf.Figure 10a) all heterogeneities remain minor fluctuations 197
whereas for kinematic hardening (cf.Figure 10b) shear and matrix bands are formed. The region 198
defined approximately by the dotted curves corresponds to the quasi-homogeneous solution. 199
3.4. Experimental validation 200
In order to validate the simulation results, complementary experimental studies were carried out 201
using technical parameters where shear localization has been reported before. It is well known that 202
ECAP typically introduces a homogeneous shear deformation for many metallic materials [9]. One 203
main requirement for a homogeneous deformation is a sufficient SHC of the processed material. In 204
case of processing conventional fully recrystallized 6000 series aluminum alloys a homogeneous 205
introduction of strain is generally observed [42–44]. Figure 11 shows the microstructure of an 206
ECAP-processed billet (AA6060) that has been processed conventionally (hot extrusion including 207
full recrystallization) prior to ECAP.Figure 11a shows an optical micrograph of the severely sheared 208
microstructure without any macroscopic heterogeneities. A detailed view into the microstructure 209
by scanning electron microscopy (in electron back-scatter diffraction mode, EBSD) reveals minor 210
differences regarding the locally introduced strains that result from the different crystallographic 211
orientations ofFigure 11b and c. These microstructural results are completely in line with earlier 212
reports [9,45,46] showing macroscopic homogeneous deformation for similar alloys. 213
These results were obtained for a fully recrystallized material that exhibits a sufficiently high 214
hardening rate throughout the whole deformation process. The analogous simulation parameters 215
in the conducted simulations for isotropic hardening are γ
β = 200 MPa,β =1.0 and for kinematic 216
hardeningκ 1=200 MPa,κckin =0.25. Both simulations result in a homogeneous solution, as shown 217
for isotropic hardening inFigure 6b and for kinematic hardening inFigure 7b. Thus, a very good 218
accordance between simulation and experiments is achieved for this kind of material condition. 219
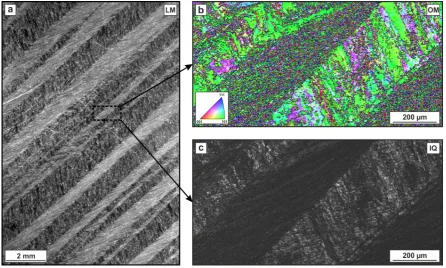
Figure 12.Microstructure after heterogeneous deformation by one pass of ECAP of a severely cold worked conventional 6000 series aluminum alloy. Optical micrograph (a) showing a microstructural overview and color-coded orientation map OM (b) and image quality map IQ (c) from EBSD measurement.
In contrast to the homogeneous microstructure observed after ECAP of a fully recrystallized 220
material, a strongly heterogeneous structure was found after processing a severely cold-worked 221
condition (cold extrusion [47]) of the same alloy. As a consequence of cold extrusion the material 222
microstructure after ECAP. It is characterized by an alternating arrangement of two fundamentally 224
different types of macroscopic bands: Shear bands, where the material got severely sheared and 225
matrix bands that exhibit much lower strains. Figure 12c shows an image quality map of an EBSD 226
measurement. Darker areas are associated with a low band contrast as a result of severe distortion of 227
the lattice due to inherent strain. The band structure is oriented under an angle of exactly 45◦with 228
respect to the pressing direction which corresponds to an alignment parallel to the theoretical shear 229
zone [3,48] of the ECAP die. The mean width of both band types is approximately 400µmresulting in 230
an almost equal area fraction (≈50%). 231
The material behavior in this case corresponds to the simulations for isotropic hardening with 232
γ
β =200 MPa,β=10.0 or for kinematic hardening withκ
1=200 MPa,κc
kin =3.75. These simulations 233
show a very small SHC during the entire ECAP pass.4As shown inFigure 7there exists a very good 234
agreement between the result of the simulation with kinematic hardening and the experimental 235
strain distributions of shear and matrix band.5 Consequently, a scale comparison was conducted 236
inFigure 13, which also shows excellent agreement. The length scale of the shear and matrix bands in 237
the experiments and in the simulations are nearly equal. 238
Figure 13.Comparison of shear and matrix bands in simulation (right) and experiment (left). In the optical micrograph the shear bands are shown in bright and the matrix bands in dark gray. In the simulation the opposite is the case: The shear bands are depicted in dark and the matrix bands in bright gray. Additionally the positions of the chosen elements in the billet far away from all boundaries are shown in red.
Despite the inherent simplifying assumptions (cf.section 2) and even though the experiments are 239
affected by various technological influencing factors like friction, there is a close agreement between 240
the simulations and the experimental observations. This encourages and motivates further analysis 241
4 More exactly, these simulations show at the beginning of the process a high SHC, but also a pronounced hardening rate. With this particular material behavior the hardening of the material during the extrusion prior to ECAP can be captured. However, after a minimal plastic deformation in the simulation the material already reached the state of a very small remaining SHC.
of the microstructural and mechanical mechanisms that lead to the formation of shear bands during 242
ECAP. A first attempt to more generally understand which conditions lead to distinct shear localization 243
is given below. 244
4. Remarks on the mechanism of heterogeneous plastic flow 245
To get a more detailed description of the localization mechanism, two representative finite 246
elements are chosen: one element of a shear and one element of a matrix band, as depicted inFigure 13 247
(simulation). These elements are selected far away from all boundaries of the ECAP tool, such that no 248
boundary effects affect the results. For these elements the stress and strain state is evaluated. 249
At first the evolution of stresses and strains during one ECAP pass in the shear and matrix bands 250
is investigated.6As shown inFigure 14, the evolution is equal for both types of bands for a long time. 251
However, at a certain point after the plastic flow has already set in, the solution diverges abruptly. 252
At this point of the deformation the effective plastic strain rate ˙sincreases rapidly in the shear bands 253
whereas in the matrix bands ˙sdecreases. It follows that at this point the plastic flow increases rapidly 254
in the shear band as the rate of plastic deformation is directly proportional to the effective plastic strain 255
rate: λ˙ = √
3/2 ˙s
. Interestingly, the duration of plastic flow is equal for both bands, as shown in 256
the yellow domain inFigure 14. This is in contrast to results given in the literature [11], where it is 257
assumed that plastic flow occursonlyin the shear bands. The simulation results show that also in the 258
matrix bands plastic flow occurs while passing through the shear zone, even though to a very small 259
extent. They also indicate that the deformation of both types of bands occurs in the same shear zone 260
region within the ECAP die.
Figure 14.The evolution of the effective plastic strains(cf.Equation 9) in shear and matrix band in the representative elements corresponding to shear and matrix bands, respectively (see highlighted elements inFigure 13).
261
To reach a better comprehension of the evolution of the shear and matrix bands, the evolution 262
of the corresponding stress states is also considered.Figure 15acompares the von Mises stress of the 263
shear and the matrix band. Interestingly, the von Mises equivalent stress remains almost equal until 264
far after the divergence of the effective plastic strain. For a justification of this fact, the definition of the 265
von Mises stress 266
σvM = r
1 2 h
σxx−σyy2+ (σxx−σzz)2+ σzz−σyy2
i
+3σxy2 +σxz2 +σyz2
(11)
has to be considered. It is clear that equal normal stresses are not required for an equal von Mises 267
stress; only the difference between the coefficients of the stress tensor has to be equal. This observation 268
gives an explanation why shear bands only appear by involving kinematic hardening and not by 269
isotropic hardening: Isotropic hardening is based on the equivalent stress (cf.Equation 8). If there is no 270
difference between shear and matrix band in terms of the equivalent stress, there will be no differences 271
in material behavior. Therefore, there is no difference concerning effective strain. As a consequence of
(a) (b)
Figure 15.The evolution of the effective plastic strains(orange) and of a) the von Mises equivalent stress (blue) and of b) the principal stress in ECAP pressure direction (blue). The solid lines are used for the shear band and the dotted lines for the matrix band.
272
almost equal von Mises stresses all components of the stress tensor have to be analyzed. The focus 273
here is placed on the normal component with respect to the pressing directiony(cf.Figure 2). Again, 274
the evolution ofσyywithin shear and matrix bands remains very similar for a long time. As indicated
275
inFigure 15ba difference inσyy7occurs just in time with the difference in the effective plastic strain
276
within shear and matrix bands. The fact that it is difficult to identify a precise source/origin of the 277
divergence of the solution into shear and matrix bands is typical for pattern-forming systems. In such 278
systems, assigning cause and effect is not always directly possible [49,50]. Moreover, one peculiarity 279
becomes obvious: the difference in stress and strain state emerges abruptly and there is no indicator 280
for a slowly increasing gap between the bands. This indicates an analogy to a supercritical pitchfork 281
bifurcation in the solution (cf.Figure 16). The control parameter in such a theoretical scenario is likely 282
to be a combination ofckinandκ, as shown insection 3. There are domains in the parameter space 283
where only one stable solution occurs, the homogeneous distribution of strain. However, in other 284
domains two stable solutions occur: the shear and the matrix band. The choice of the stable solution 285
is affected by the previously deformed material segment. A material segment which experiences 286
an overlarge plastic flow (the shear band) is followed by a material segment which experiences an 287
undersized plastic flow (the matrix band). It is worth noting that the application of bifurcation analysis 288
(which is common in studying pattern-forming systems) to ECAP represents a novel approach to 289
understand the formation of shear and matrix bands. While the fundamental idea is presented here for 290
the first time, it is highlighted that further work is required to fully describe and understand localized 291
flow during ECAP in the conceptual framework of pattern formation and self-organizing systems. 292
Figure 16.Assumed supercritical pitchfork bifurcation of the effective plastic strains(cf.Equation 9) in the parameter space. The control parameter is a function of both parameters of kinematic hardening.
5. Conclusions 293
Adopting phenomenological plasticity theory with isotropic and kinematic hardening and using 294
two-dimensional explicit finite element simulations, strain localization during ECAP can be reproduced. 295
To this end, a systematic convergence study helps to ensure a stable and reliable FE solution, which is 296
suitable for gaining new insights in the localization process. The FE simulations show that isotropic 297
hardening can only cause minor fluctuations in the plastic strain fields. Kinematic hardening with 298
high initial hardening rate and sufficient strain hardening capacity can lead to pronounced localized 299
deformation in form of shear and matrix bands. This enables the numerical analysis of the evolution of 300
this band structure during ECAP with a phenomenological material model. Neither micro-mechanical 301
material features nor strain softening of the material have to be considered. It is confirmed that 302
kinematic harding plays thus an important role for simulating strain localization during ECAP. 303
Additionally we find a surprisingly accurate match between simulation and our experimental results. 304
A detailed analysis of shear and matrix bands revealed that not only the shear bands but also the 305
matrix bands deform plastically during ECAP. Although the plastic deformation is very small in the 306
whole shear zone the effective plastic strain rate is always larger than zero. 307
In future work the influences of the different hardening mechanisms have to be studied in 308
greater detail. Especially the effect of the parameters of kinematic hardening but also the influence 309
of the formative hardening on the evolution of shear bands is not fully understood yet. Because 310
of the complex relationship of strain hardening behavior and local (plastic) deformation behavior 311
including strain localization in certain cases an in-depth understanding of the acting microstructural 312
and micro-mechanical mechanisms is needed to describe and predict the material’s behavior during 313
severe plastic deformation. Applying the theoretical concepts used to describe pattern-formation in 314
self-organizing systems may provide a novel pathway to distinguish stable vs. unstable deformation 315
modes. 316
Supplementary Materials:The following are available online at www.mdpi.com/link, Video S1: Effective strain
317
for kinematic hardening with the hardening parametersκ 1=200 MPa,κckin=3.75. The shear and matrix band 318
formation in the shear zone is shown.
Acknowledgments: The authors gratefully acknowledge the German Research Foundation (Deutsche
320
Forschungsgemeinschaft, DFG) for supporting this work carried out within the framework of the Collaborative
321
Research Center SFB 692 (projects A1, C2, C5).
322
Author Contributions: Tobias Horn performed the FE simulations, based on a pilot study from Christian
323
Silbermann. Philipp Frint conceived and designed the experiments. All authors discussed the results.
324
Conflicts of Interest:The authors declare no conflict of interest.
325
Abbreviations 326
The following abbreviations are used in this manuscript:
327
ECAP Equal-Channel Angular Pressing SPD severe plastic deformation IHR initial hardening rate SHC strain hardening capacity
KKT Karush-Kuhn-Tucker
FE finite element
328
329
1. Segal, V. The method of material preparation for subsequent working. Patent of the USSR1977,575892.
330
2. Segal, V.; Reznikov, V.; Dobryshevshiy, A.; Kopylov, V. Plastic working of metals by simple shear.Russian
331
Metallurgy (Metally)1981, pp. 99–105.
332
3. Iwahashi, Y.; Wang, J.; Horita, Z.; Nemoto, M.; Langdon, T.G. Principle of equal-channel angular pressing
333
for the processing of ultra-fine grained materials. Scripta materialia1996,35, 143–146.
334
4. Hall, E. The deformation and ageing of mild steel: III discussion of results. Proceedings of the Physical
335
Society. Section B1951,64, 747.
336
5. Petch, N. The cleavage strength of polycrystals. J. Iron Steel Inst.1953,174, 25–28.
337
6. Valiev, R.; Alexandrov, I.; Zhu, Y.; Lowe, T. Paradox of strength and ductility in metals processed bysevere
338
plastic deformation. Journal of Materials Research2002,17, 5–8.
339
7. Wang, Y.; Chen, M.; Zhou, F.; Ma, E. High tensile ductility in a nanostructured metal. Nature2002,
340
419, 912–915.
341
8. Ma, A.; Jiang, J.; Saito, N.; Shigematsu, I.; Yuan, Y.; Yang, D.; Nishida, Y. Improving both strength and
342
ductility of a Mg alloy through a large number of ECAP passes. Materials Science and Engineering: A2009,
343
513, 122–127.
344
9. Valiev, R.Z.; Langdon, T.G. Principles of equal-channel angular pressing as a processing tool for grain
345
refinement.Progress in materials science2006,51, 881–981.
346
10. Kim, W.; Chung, C.; Ma, D.; Hong, S.; Kim, H. Optimization of strength and ductility of 2024 Al by equal
347
channel angular pressing (ECAP) and post-ECAP aging. Scripta Materialia2003,49, 333–338.
348
11. Frint, P. Lokalisierungsphänomene nach kombinierter hochgradig plastischer Umformung durch Extrusion
349
und ECAP einer 6000er-Aluminiumlegierung. Dissertation, Chemnitz University of Technology, 2015.
350
12. Lapovok, R.; Tóth, L.S.; Molinari, A.; Estrin, Y. Strain localisation patterns under equal-channel angular
351
pressing.Journal of the Mechanics and Physics of Solids2009,57, 122–136.
352
13. Zhilyaev, A.; Swisher, D.; Oh-Ishi, K.; Langdon, T.; McNelley, T. Microtexture and microstructure evolution
353
during processing of pure aluminum by repetitive ECAP. Materials Science and Engineering: A2006,
354
429, 137–148.
355
14. Segal, V. Equal channel angular extrusion: from macromechanics to structure formation. Materials Science
356
and Engineering: A1999,271, 322–333.
357
15. Miyamoto, H.; Ikeda, T.; Uenoya, T.; Vinogradov, A.; Hashimoto, S. Reversible nature of shear bands in
358
copper single crystals subjected to iterative shear of ECAP in forward and reverse directions. Materials
359
Science and Engineering: A2011,528, 2602–2609.
360
16. Prangnell, P.; Harris, C.; Roberts, S. Finite element modelling of equal channel angular extrusion. Scripta
361
Materialia1997,37, 983–989.
362
17. Raab, G. Plastic flow at equal channel angular processing in parallel channels. Materials Science and
363
Engineering: A2005,410, 230–233.
18. Dumoulin, S.; Roven, H.; Werenskiold, J.; Valberg, H. Finite element modeling of equal channel angular
365
pressing: Effect of material properties, friction and die geometry.Materials Science and Engineering: A2005,
366
410, 248–251.
367
19. Kim, H.S.; Seo, M.H.; Hong, S.I. Finite element analysis of equal channel angular pressing of strain rate
368
sensitive metals.Journal of Materials Processing Technology2002,130, 497–503.
369
20. Yoon, S.C.; Kim, H.S. Finite element analysis of the effect of the inner corner angle in equal channel angular
370
pressing.Materials Science and Engineering: A2008,490, 438–444.
371
21. Kim, H.S.; Seo, M.H.; Hong, S.I. Plastic deformation analysis of metals during equal channel angular
372
pressing.Journal of Materials Processing Technology2001,113, 622–626.
373
22. Park, J.W.; Suh, J.Y. Effect of die shape on the deformation behavior in equal-channel angular pressing.
374
Metallurgical and materials transactions A2001,32, 3007–3014.
375
23. Li, S.; Bourke, M.; Beyerlein, I.; Alexander, D.; Clausen, B. Finite element analysis of the plastic deformation
376
zone and working load in equal channel angular extrusion. Materials Science and Engineering: A2004,
377
382, 217–236.
378
24. Figueiredo, R.B.; Cetlin, P.R.; Langdon, T.G. Stable and unstable flow in materials processed by
379
equal-channel angular pressing with an emphasis on magnesium alloys. Metallurgical and Materials
380
Transactions A2010,41, 778–786.
381
25. Semiatin, S.; Delo, D.; Shell, E. The effect of material properties and tooling design on deformation and
382
fracture during equal channel angular extrusion.Acta Materialia2000,48, 1841–1851.
383
26. Oruganti, R.; Subramanian, P.; Marte, J.; Gigliotti, M.F.; Amancherla, S. Effect of friction, backpressure
384
and strain rate sensitivity on material flow during equal channel angular extrusion.Materials Science and
385
Engineering: A2005,406, 102–109.
386
27. Bowen, J.; Gholinia, A.; Roberts, S.; Prangnell, P. Analysis of the billet deformation behaviour in equal
387
channel angular extrusion.Materials Science and Engineering: A2000,287, 87–99.
388
28. Figueiredo, R.B.; Aguilar, M.T.P.; Cetlin, P.R. Finite element modelling of plastic instability during ECAP
389
processing of flow-softening materials. Materials Science and Engineering: A2006,430, 179–184.
390
29. Ghazani, M.S.; Vajd, A. Finite Element Simulation of Flow Localization During Equal Channel Angular
391
Pressing.Transactions of the Indian Institute of Metals2016, pp. 1–6.
392
30. Shutov, A.; Kreißig, R. Finite strain viscoplasticity with nonlinear kinematic hardening: Phenomenological
393
modeling and time integration.Computer Methods in Applied Mechanics and Engineering2008,197, 2015–2029.
394
31. Kießling, R.; Landgraf, R.; Scherzer, R.; Ihlemann, J. Introducing the concept of directly connected
395
rheological elements by reviewing rheological models at large strains. International Journal of Solids and
396
Structures2016,97, 650–667.
397
32. Frederick, C.O.; Armstrong, P. A mathematical representation of the multiaxial Bauschinger effect.Materials
398
at High Temperatures2014.
399
33. Voce, E. The relationship between stress and strain for homogeneous deformation. J Inst Met1948,
400
74, 537–562.
401
34. Perzyna, P. The constitutive equations for rate sensitive plastic materials.Quarterly of applied mathematics
402
1963, pp. 321–332.
403
35. Horn, T. Simulation und FE-Analyse der Verformungslokalisierung bei der ECAP-Umformung. Master
404
thesis, Chemnitz University of Technology, 2016.
405
36. Shutov, A.V.; Kreißig, R. Geometric integrators for multiplicative viscoplasticity: Analysis of error
406
accumulation. Computer Methods in Applied Mechanics and Engineering2010,199, 700–711.
407
37. Shutov, A.V.; Kuprin, C.; Ihlemann, J.; Wagner, M.F.X.; Silbermann, C. Experimentelle Untersuchung
408
und numerische Simulation des inkrementellen Umformverhaltens von Stahl 42CrMo4 Experimental
409
investigation and numerical simulation of the incremental deformation of a 42CrMo4 steel. Mat.-wiss. u.
410
Werkstofftech.2010,41, 765–775.
411
38. Silbermann, C.B.; Shutov, A.V.; Ihlemann, J. On operator split technique for the time integration within
412
finite strain viscoplasticity in explicit FEM.PAMM2014,14, 355–356.
413
39. Frint, P.; Wagner, M.F.X.; Weber, S.; Seipp, S.; Frint, S.; Lampke, T. An experimental study on optimum
414
lubrication for large-scale severe plastic deformation of aluminum-based alloys. Journal of Materials
415
Processing Technology2017,239, 222–229.
40. Frint, S.; Hockauf, M.; Frint, P.; Wagner, M.F.X. Scaling up Segal’s principle of Equal-Channel Angular
417
Pressing.Materials & Design2016,97, 502–511.
418
41. Horn, T.; Silbermann, C.; Ihlemann, J. FE-Simulation based analysis of residual stresses and strain
419
localizations in ECAP processing. Proceedings in Applied Mathematics and Mechanics2017,16.
420
42. Frint, P.; Hockauf, M.; Dietrich, D.; Halle, T.; Wagner, M.F.X.; Lampke, T. Influence of strain gradients on the
421
grain refinement during industrial scale ECAP.Materialwissenschaft und Werkstofftechnik2011,42, 680–685.
422
43. Frint, P.; Hockauf, M.; Halle, T.; Wagner, M.F.X.; Lampke, T. The role of backpressure during large scale
423
Equal-Channel Angular Pressing. Materialwissenschaft und Werkstofftechnik2012,43, 668–672.
424
44. Frint, P.; Hockauf, M.; Halle, T.; Strehl, G.; Lampke, T.; Wagner, M.F.X. Microstructural Features and
425
Mechanical Properties after Industrial Scale ECAP of an Al 6060 Alloy. Materials Science Forum. Trans
426
Tech Publ, 2011, Vol. 667, pp. 1153–1158.
427
45. Lefstad, M.; Pedersen, K.; Dumoulin, S. Up-scaled equal channel angular pressing of AA6060 and
428
subsequent mechanical properties.Materials Science and Engineering: A2012,535, 235–240.
429
46. Chaudhury, P.K.; Cherukuri, B.; Srinivasan, R. Scaling up of equal-channel angular pressing and its
430
effect on mechanical properties, microstructure, and hot workability of AA 6061. Materials Science and
431
Engineering: A2005,410, 316–318.
432
47. Berndt, N.; Frint, P.; Böhme, M.; Wagner, M.F.X. Microstructure and mechanical properties of an AA6060
433
aluminum alloy after cold and warm extrusion. Materials Science and Engineering: A2017,707, 717–724.
434
48. Beyerlein, I.J.; Tomé, C.N. Analytical modeling of material flow in equal channel angular extrusion (ECAE).
435
Materials Science and Engineering: A2004,380, 171–190.
436
49. Ebeling, W.; Feistel, R.Chaos und Kosmos: Prinzipien der Evolution; Spektrum Akad. Verlag, 1994; pp. 109,18.
437
50. Ebeling, W. Chaos, Ordnung, Information: Selbstorganisation in Natur und Technik; Vol. 74, Harri Deutsch
438
Verlag, 1989; p. 40.