http://www.sciencepublishinggroup.com/j/ajce doi: 10.11648/j.ajce.20170502.14
ISSN: 2330-8729 (Print); ISSN: 2330-8737 (Online)
Modelling and Simulation of Water Absorption from Locally
Occurring 3/8 Gravel at Different Water Cement Ratio and
Curing Age Applying Deterministic Modelling Approach
Ode. T.
1, Eluozo S. N.
21Department of Civil Engineering, Faculty of Engineering Rivers State University of Sciences and Technology Nkpolu, Port Harcourt, Nigeria
2Subaka Nigeria Limited, Port Harcourt, Nigeria
Email address:
[email protected] (Ode. T.), [email protected] (Eluozo S. N.), [email protected] (Eluozo S. N.)
To cite this article:
Ode.T., Eluozo S. N. Modelling and Simulation of Water Absorption from Locally Occurring 3/8 Gravel at Different Water Cement Ratio and Curing Age Applying Deterministic Modelling Approach. American Journal of Civil Engineering. Vol. 5, No. 2, 2017, pp. 90-103.
doi: 10.11648/j.ajce.20170502.14
Received: August 23, 2016; Accepted: October 31, 2016; Published: March 4, 2017
Abstract:
Water absorption in all in one aggregate concrete formation was monitored applying deterministic modeling approach. Several experts in the field has been applying empirical method through calibrating of experimental values, these has been developing water absorption parameters in various mix proportions to monitor strength development of concrete. But the application of deterministic concept has not been applied to monitor water absorption thus all in one aggregate concrete, the study applying these concept monitored water absorption at every twenty four hours and the conventional method of seven days interval, predictive values express the increase and decline rate of water absorption at various water cement ratios and curing age, these concept predicted different method expressing best fits of both concepts, the vacillation found in the study at different water cement ratios were base on the variations of mix proportions thus compaction level that determine the rate of concrete porosity in all in one aggregate concrete. The study is imperative because the application of these concept has been developed thus it can generate water absorption in hours and interval of days.Keywords:
Modeling and Simulation, Water Absorption, 3/8 Gravel, Water Cement Ratio and Deterministic Approach1. Introduction
As construction technology becomes more highly developed, there is need for better environment to improve it level of performance on regarding vibration resistance, reduced noise, and fireproofing in structures. It has been observed that there lots of structural defects and deteriorations in existing structures. The construction industry is experiencing difficulties in managing early age concrete because there is no reliable technique to measure its compressive strength [5]. Currently, due to expansion of different hydraulic structures such as dams, the stability issue of concrete is very imperative parameter of hydraulic structures. The fundamental subject in this regard is the concrete resistance against abrasion which is connected to water and cement including the crystalline structure of the element in concrete. To improve the abrasion resistance of
shrinkage, cracking, surface wear and cavitations are other establishes parameters of good concretes. Several experts has applied different types of model in determining porosity permeability for several types such as Various types of concrete include high-alumina concrete, fibrous concrete, lateritic concrete, etc. [6, 7, 8, 9, 10, 11, 14, and 16].
2. Governing Equation
l
C
G
l
C
V
z
C
W
A AS A C
∂
∂
+
∂
∂
=
∂
∂
β
(1)Equation (1) is solve using method of separation of variable whereby we let C (z, l) =Z (z) L (l).
[
]
2'
τ
β
=
+
L
L
G
Vs
(2)Therefore, we have a solution of the forms;
2 2
Vs G WC
Z
A
andL
B
τ τ β +
=
ℓ
=
ℓ
(3)Which when combine gives equation (4) as thus;
+
=
W V GA S C
B
Ae
l
z
C
β ττ2 2
)
,
(
ℓ
(4)2
)
,
(
τ β + +=
V Gl W z A S C
AB
l
z
C
ℓ
(5)3. Material and Methods
Standard laboratory experiment where performed to monitor water absorption on concrete at different curing age, the quantity of water in concrete were determined at different water cement ratios, the experimental result are applied to be compared with the theoretical values to determined the validation of the model.
4. Results and Discussion
Results and discussion are presented in tables including graphical representation of predictive values for water absorption.
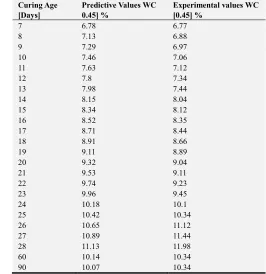
Table 1. Predictive Values of Water Absorption at Different Curing Age.
Curing Age [Days] Water Absorption [WC % 0.45]
7 6.78
8 7.13
9 7.29
10 7.46
11 7.63
12 7.8
Curing Age [Days] Water Absorption [WC % 0.45]
13 7.98
14 8.15
15 8.34
16 8.52
17 8.71
18 8.91
19 9.11
20 9.32
21 9.53
22 9.74
23 9.96
24 10.18
25 10.42
26 10.65
27 10.89
28 11.13
60 10.14
90 9.87
Table 2. Predictive and Experimental Values for Water Absorption at Different Curing Age.
Curing Age [Days]
Predictive Values WC 0.45] %
Experimental values WC [0.45] %
7 6.78 6.77
8 7.13 6.88
9 7.29 6.97
10 7.46 7.06
11 7.63 7.12
12 7.8 7.34
13 7.98 7.44
14 8.15 8.04
15 8.34 8.12
16 8.52 8.35
17 8.71 8.44
18 8.91 8.66
19 9.11 8.89
20 9.32 9.04
21 9.53 9.11
22 9.74 9.23
23 9.96 9.45
24 10.18 10.1
25 10.42 10.34
26 10.65 11.12
27 10.89 11.44
28 11.13 11.98
60 10.14 10.34
90 10.07 10.34
Table 3. Predictive Values of Water Absorption at Different Curing Age.
Curing Age Water Absorption WC [0.45] %
7 2.2
8 2.24
9 2.29
10 2.35
11 2.4
12 2.45
13 2.51
14 2.56
15 2.62
16 2.68
17 2.74
18 2.81
Curing Age Water Absorption WC [0.45] %
20 2.93
21 3
22 3.06
23 3.14
24 3.21
25 3.28
26 3.36
27 3.43
28 3.51
60 3.82
90 3.39
Table 4. Predictive and Experimental Values for Water Absorption at Different Curing Age.
Curing Age [Days]
Predictive Values WC [0.45] %
Experimental values WC [0.45] %
7 2.2 2.17
8 2.24 2.25
9 2.29 2.26
10 2.35 2.31
11 2.4 2.39
12 2.45 2.41
13 2.51 2.49
14 2.56 2.52
15 2.62 2.58
16 2.68 2.61
17 2.74 2.69
18 2.81 2.78
19 2.87 2.81
20 2.93 2.89
21 3 2.97
22 3.06 3.09
23 3.14 3.16
24 3.21 3.17
25 3.28 3.25
26 3.36 3.31
27 3.43 3.39
28 3.51 3.49
60 3.82 3.78
90 3.39 3.18
Table 5. Predictive Values of Water Absorption at Different Curing Age.
Curing Age [Days] Water Absorption [WC 0.50%]
7 4.58
14 4.37
21 4.05
28 4.66
60 4.24
90 6.61
Table 6. Predictive and Experimental Values for Water Absorption at Different Curing Age.
Curing Age [Days]
Predictive Values WC [0.50] %
Experimental values WC [0.50] %
7 4.58 4.64
14 4.37 4.74
21 4.05 4.89
28 4.66 5.43
60 4.24 4.64
90 6.61 5.76
Table 7. Predictive Values of Water Absorption at Different Curing Age.
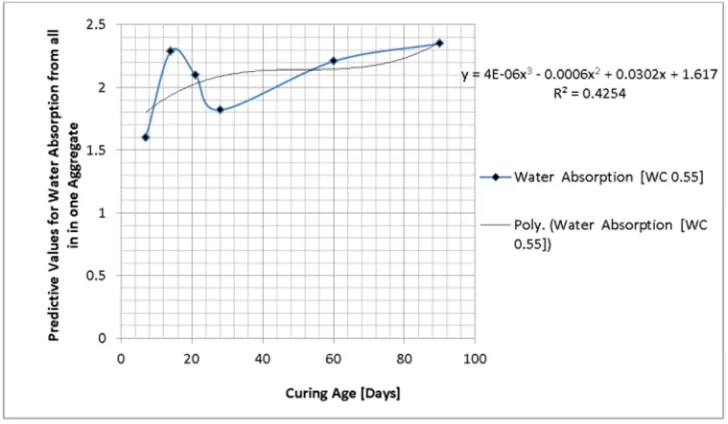
Curing Age [Days] Water Absorption [WC 0.55]%
7 1.6
14 2.29
21 2.1
28 1.82
60 2.21
90 2.35
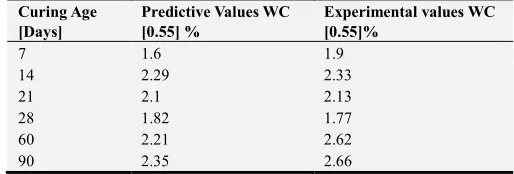
Table 8. Predictive and Experimental Values for Water Absorption at Different Curing Age.
Curing Age [Days]
Predictive Values WC [0.55] %
Experimental values WC [0.55]%
7 1.6 1.9
14 2.29 2.33
21 2.1 2.13
28 1.82 1.77
60 2.21 2.62
90 2.35 2.66
Table 9. Predictive Values of Water Absorption at Different Curing Age.
Curing Age [Days] Water Absorption [WC 0.60]
7 0.8
14 0.6
21 1.05
28 1.74
60 3.38
90 2.68
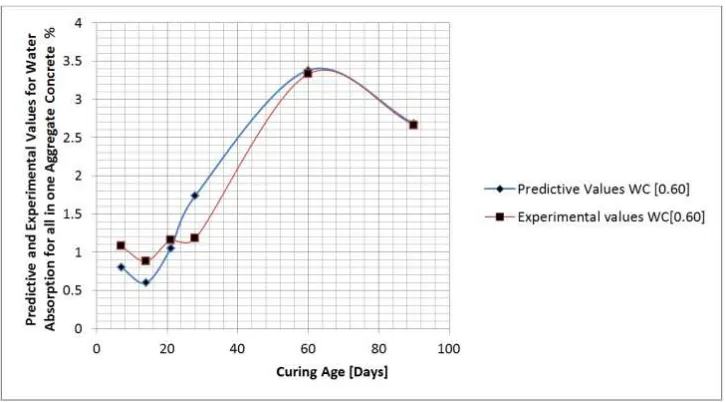
Table 10. Predictive and Experimental Values for Water Absorption at Different Curing Age.
Curing Age Predictive Values WC [0.60]%
Experimental values WC [0.60]%
7 0.8 1.08
14 0.6 0.88
21 1.05 1.16
28 1.74 1.18
60 3.38 3.33
90 2.68 2.66
Table 11. Predictive Values of Water Absorption at Different Curing Age.
Curing Age [Days] Water Absorption [WC 0.65]%
7 0.82
14 0.92
21 1.76
28 0.7
60 2.75
90 2.75
Table 12. Predictive and Experimental Values for Water Absorption at Different Curing Age.
Curing Age [Days]
Predictive Values WC [0.65] %
Experimental values WC [0.65] %
7 0.82 0.91
14 0.92 0.81
21 1.76 1.23
28 0.7 0.92
60 2.75 2.55
Table 13. Predictive Values of Water Absorption at Different Curing Age.
Curing Age [Days] Water Absorption [WC 0.70] %
7 1.21
14 0.56
21 0.61
28 2.1
60 3.01
90 1.66
Table 14. Predictive and Experimental Values for Water Absorption at Different Curing Age.
Curing Age [Days]
Predictive Values WC [0.70] %
Experimental values WC [0.70] %
7 1.21 1.6
14 0.56 0.9
21 0.61 0.93
28 2.1 2.26
60 3.01 3.23
90 1.66 1.83
Table 15. Predictive Values of Water Absorption at Different Curing Age
Curing Age [Days] Water Absorption [WC 0.75] %
7 0.82
14 1.31
21 1.09
28 1.19
60 1.65
90 1.52
Table 16. Predictive and Experimental Values for Water Absorption at Different Curing Age.
Curing Age [Days] Predictive Values WC [0.75] %
Experimental values WC [0.75]%
7 0.82 0.7
14 1.31 1.04
21 1.09 1.18
28 1.19 1.28
60 1.65 1.57
90 1.52 1.63
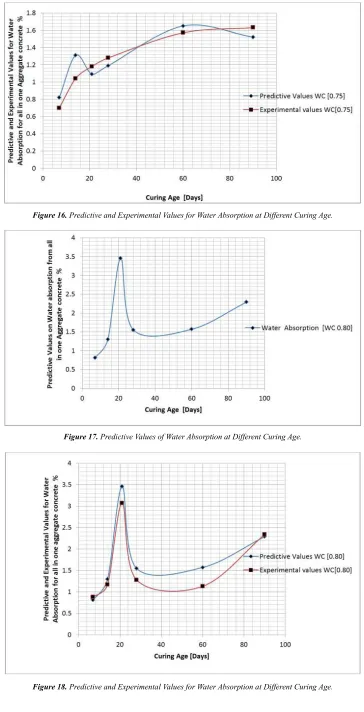
Table 17. Predictive Values of Water Absorption at Different Curing Age.
Curing Age [Days] Water Absorption [WC 0.80] %
7 0.81
14 1.3
21 3.46
28 1.55
60 1.57
90 2.29
Table 18. Predictive and Experimental Values for Water Absorption at Different Curing Age.
Curing Age [Days]
Predictive Values WC [0.80] %
Experimental values WC [0.80]%
7 0.81 0.88
14 1.3 1.17
21 3.46 3.07
28 1.55 1.28
60 1.57 1.13
90 2.29 2.34
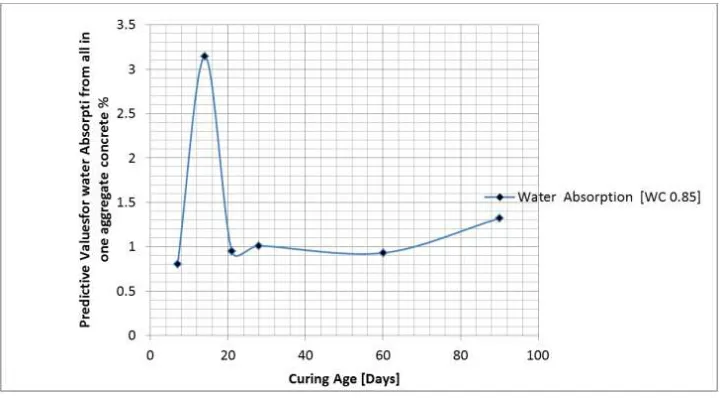
Table 19. Predictive Values of Water Absorption at Different Curing Age.
Curing Age [Days] Water Absorption [WC 0.85] %
7 0.8
14 3.14
21 0.95
28 1.01
60 0.93
90 1.32
Table 20. Predictive and Experimental Values for Water Absorption at Different Curing Age.
Curing Age [Days]
Predictive Values WC [0.85] %
Experimental values WC [0.85] %
7 0.8 0.95
14 3.14 3.47
21 0.95 1.3
28 1.01 0.88
60 0.93 0.92
90 1.32 1.09
Table 21. Predictive Values of Water Absorption at Different Curing Age.
Curing Age [Days] Water Absorption [WC 0.90] %
7 0.81
14 2.07
21 1.06
28 1.1
60 0.9
90 2.02
Table 22. Predictive and Experimental Values for Water Absorption at Different Curing Age.
Curing Age [Days]
Predictive Values WC [0.90] %
Experimental values WC [0.90] %
7 0.81 0.95
14 2.07 2.42
21 1.06 0.95
28 1.1 1.02
60 0.9 0.93
90 2.02 2.01
Table 23. Predictive Values of Water Absorption at Different Curing Age.
Curing Age [Days] Water Absorption [WC 0.95] %
7 1.13
14 1.26
21 1.36
28 3.58
60 0.86
90 0.82
Table 24. Predictive and Experimental Values for Water Absorption at Different Curing Age.
Curing Age [Days]
Predictive Values WC [0.95] %
Experimental values WC [0.95] %
7 1.13 1.39
14 1.26 1.55
21 1.36 1.5
28 3.58 3.28
60 0.86 0.7
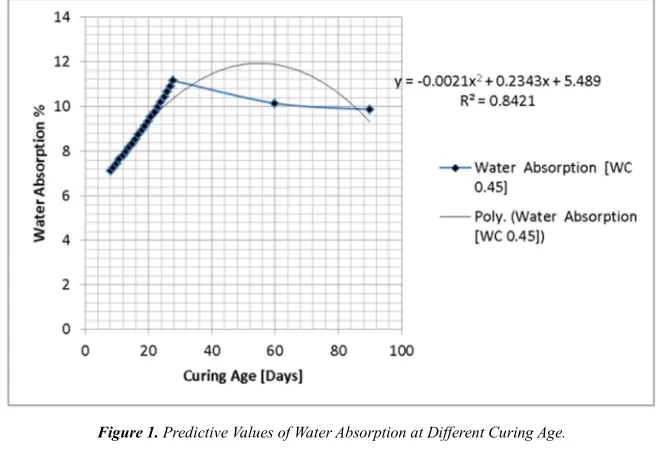
Figure 1. Predictive Values of Water Absorption at Different Curing Age.
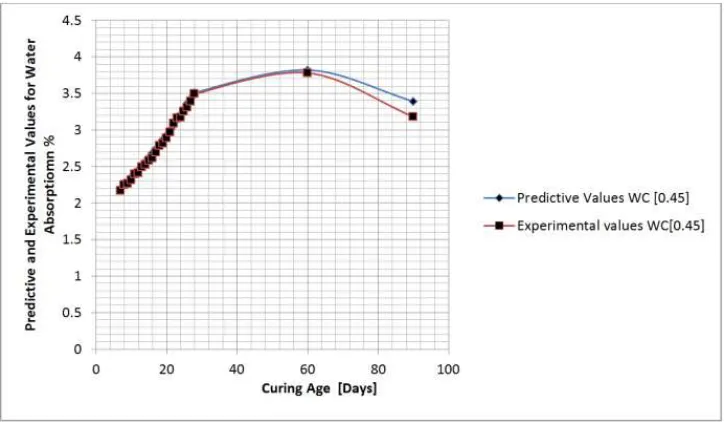
Figure 2. Predictive and Experimental Values for Water Absorption at Different Curing Age.
Figure 4. Predictive and Experimental Values for Water Absorption at Different Curing Age.
Figure 5. Predictive Values of Water Absorption at Different Curing Age.
Figure 7. Predictive Values of Water Absorption at Different Curing Age.
Figure 8. Predictive and Experimental Values for Water Absorption at Different Curing Age.
Figure 10. Predictive and Experimental Values for Water Absorption at Different Curing Age.
Figure 11. Predictive Values of Water Absorption at Different Curing Age.
Figure 13. Predictive Values of Water Absorption at Different Curing Age.
Figure 14. Predictive and Experimental Values for Water Absorption at Different Curing Age.
Figure 16. Predictive and Experimental Values for Water Absorption at Different Curing Age.
Figure 17. Predictive Values of Water Absorption at Different Curing Age.
Figure 19. Predictive Values of Water Absorption at Different Curing Age.
Figure 20. Predictive and Experimental Values for Water Absorption at Different Curing Age.
Figure 22. Predictive and Experimental Values for Water Absorption at Different Curing Age.
Figure 23. Predictive Values of Water Absorption at Different Curing Age.
The rate of water absorption inall in - one aggregate forconcrete strength were developed using deterministic model, the graphical representation are expressed showing various rate of absorption at different water cement ratio and curing age. Figure one shows gradual increase of water absorption to the optimum level recorded at twenty eight days, slight decline in water absorption were observed in stable state between sixty and ninety days. Figure two also express it in the same vein were the predictive and experimental were compared for best fits, decline in water absorption were experiences between sixty and ninety days. Figure three maintained similar condition from figure one and two, gradual increase were experienced to the optimum values recorded at twenty eight days with slight decrease in water absorption between sixty and ninety days, figure four express the rate of both parameters the experimental and predictive in like manner, thus developed decline in water absorption between sixty and ninety days was noticed. Figure five developed fluctuation from seven to sixty days and suddenly increase in water absorption to the optimum values at ninety days. Figure six expression of both predictive and experimental values maintained fluctuation to the optimum point of water absorption at ninety days. Figure seven also express vacillation to the point where the optimum water absorption was recorded; figure eight in like manner express the comparison between predictive and experimental in the same vein. Figure nine developed gradual increase from the lowest at seven days to the point where the optimum values were recorded at twenty eight days before sudden decline was observed at ninety days. Figure ten express comparison of both predictive and experimental values whereby gradual increase were experienced developing the optimum values at twenty eight days declining slightly at ninety days. Figure eleven express gradual increase with fluctuation between seven and twenty one days, sudden increase were observed to the optimum values at sixty days thus developed slight decline at ninety. Figure twelve express predictive and experimental values comparing for best fits with fluctuation to the maximum values at sixty day with slight decline at ninety days. Figure thirteen vacillations between seven and fourteen with sudden increase to the optimum values at sixty days with sudden decline at ninety days. Figure fourteen maintained similar condition between the predictive and experimental sudden increase fluctuating down the optimum at sixty days with rapid decline at ninety days. Figure fifteen express oscillation between seven and twenty one days and suddenly increase rapidly to the optimum level of water absorption at sixty days with slight decrease at ninety days, figure sixteen maintained the state of water absorption by rapidly increasing to the optimum values at sixty thus decline slightly at ninety days. Figure seventeen express rapid fluctuation whereby the optimum was recorded at twenty one with sudden decrease in water absorption between twenty eight and sixty thus express slight increase
at ninety days. Figure eighteen in the same vein maintained rapid state of vacillation, the optimum recorded at twenty one thus observed sudden decrease between the predictive and experimental values with slight increase at ninety days. Figure twenty experienced fluctuation between seven and fourteen and sudden experienced sudden decline between fourteen and twenty eight days with slight increase between sixty and ninety days. Figure twenty one express similar increase fluctuating to the optimum rate of water absorption at fourteen was declining rapidly between fourteen and twenty eight days expressing slight increase at ninety days. Figure twenty two maintain the same condition the optimum at fourteen declining rapidly between twenty one and sixty days and suddenly experienced slight increase at ninety days. Figure twenty three express slight fluctuation between seven and fourteen thus express rapid increase at twenty one day declining down between twenty eight and sixty days with slight increase at ninety days. Figure twenty four maintained the same condition where the predictive and experimental values developed slight vacillation and suddenly increase to the optimum values at twenty eight days thus experienced decrease between twenty one and twenty eight days with slight increase at ninety days.
5. Conclusion
The behaviuor of water ingress in all in one aggregate concrete has been express applying the deterministic modeling approach, the rate of water absorption were express through simulation of the developed model in the system, the derived solution express these values through simulation thus at different water cement ratios and curing age, the rate of absorption at different curing age were influenced by concrete properties, the rate of compaction varying at various mix proportion determined the rate of water absorption at various samples, these effect were observed to reflect on the variation of all in one aggregate concrete express from various figures in the study, the slight decline in water absorption can be attributed to decrease in concrete porosity and permeability in various mix proportion. The predictive and experimental values were compared to developed fitness validating the developed model; experts in the field will find these methods a useful tool to monitor the rate of water absorption all-in one aggregate and other granite concrete mixes.
Nomenclature
References
[1] Aiu, M. and C. Huang, 2006 The Chemistry and Physics of Nano-Cement. Submitted to National Science Foundation Research Experiences for Undergraduates, University of Delaware, Newark, Vol. No. (2006).
[2] Kamal R, Abolfazl S, Bahram S and \Saber P, 2012 Effect of Water and Cement Ratio on Compressive Strength and Abrasion of Microsilica Concrete Middle-East Journal of Scientific Research 12 (8): 1056-1061, 2012.
[3] Collepardi, M., S. Collepardi, U. Skarp and R. Troli 2004. Optimization of silica fume, fly ash and amorphous nano-silica in superplasticized high-performance concretes. in Proceedings of 8 CANMET/ACI International Conference on Fly AshSilica Fume, Slag and Natural Pozzolans in Concrete, SP-221, Las Vegas, USA.
[4] Collepardi, M., J. OgoumahOlagot, F. Simonelli and S. Collepardi, 2004. Combination of Silica Fume, Fly Ash and Amorphous Nano-Silica in Superplasticized High-performance Concretes. in Proceedings of VII AIMAT Congress. Ancona, Italy.
[5] Bui, D., J. Hu and P. Stroeven, 2005. Particle size effect on the strength of rice husk ash blended gap- graded Portland cement concrete. Cement and Concrete Composites, 27 (3): 357-366. [6] Ode. T. and Eluozo S. N. 2016 Predictive Model on
Compressive Strength of Concrete Made with Locally 3/8 Gravel from Different Water Cement Ratios and Curing Age; International Journal of Scientific and Engineering Research, Volume 7, issue 1 pp 1528-1551.
[7] Ode. T. and Eluozo S. N.- 2016 Model Prediction to Monitor the Rate of Water Absorption of Concrete Pressured by Variation of Time and Water Cement Ratios International
Journal of Scientific and Engineering Research, Volume 7, issue 1 pp 1514-1527.
[8] Ode. T. and Eluozo S. N. 2016 Calibrating the Density of Concrete from Washed and Unwashed Locally 3/8 Gravel Material at Various Curing Age International Journal of
Scientific and Engineering Research, Volume 7, issue 1 January- pp 1514-1552-15574.
[9] Ode. T. and Eluozo S. N; 2016 Compressive Strength Calibration of Washed and Unwashed Locally Occurring 3/8 Gravel from Various Water Cement Ratios and Curing Age; International Journal Engineering and General Science Volume 4 Issue 1, pp 462-483.
[10] Ode. T. and Eluozo S. N; 2016 Predictive Model to Monitor Variation of Concrete Density Influenced by Various Grade from Locally 3/8 Gravel at Different Curing Time International Journal Engineering and General Science Volume 4 Issue 1, pp 502-522.
[11] Ode. T. and Eluozo S. N; 2016 Predictive Model to Monitor Vitiation of Stress –Strain Relationship of 3/8 Gravel Concrete with Water Cement Ration [0.45] at Different Load International Journal Engineering and General Science Volume 4 Issue 1, pp 409-418.
[12] Eluozo S. N. and Ode. T. 2015 Modeling and simulation of Compression Strength for Firm Clay in Swampy Area of Ahoada East International Journal of Advance Research in
Engineering and Technology Volume 6, Issue 12, pp 73-85. [13] Eluozo S. N. and Ode. T. 2015 Mathematical Model to Predict
Compression Index of Uniform Loose Sand in Coastal Area of Degema, Rivers State of Nigeria International Journal of
Advance Research in Engineering and Technology Volume 6, Issue 12, pp 86-103.
[14] Eluozo S. N. and Ode. T. 2015 Mathematical to Monitor Stiff Clay Compression Index in Wet Land Area of Degema
International Journal of Advance Research in Engineering and Technology Volume 6, Issue 12, pp 59-72.
[15] Alawode O and. Idowu, O. I. 2011: Effects of Water-Cement Ratios on the Compressive Strength and Workability of Concrete and Lateritic Concrete Mixes. The Pacific Journal of Science and Technology.